Final Report Phases 1-3 (2002)
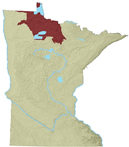
Location of Agassiz Lowlands
8.7 AGASSIZ LOWLANDS SUBSECTION OF NORTHERN MINNESOTA & ONTARIO PEATLANDS
8.7.1 Environmental Context
8.7.2 Site Probability Model
8.7.3 Survey Probability Model
8.7.4 Survey Implementation Model
8.7.5 Other Models
This regional model report is organized as described in Sections 8.2.1 through 8.4.1. Refer to these sections of the report for explanations of the tables, variables, and statistics.
8.7.1 Environmental Context
Agassiz Lowlands is a subsection of the Northern Minnesota and Ontario Peatlands Section of the Laurentian Mixed Forest Province (Figure 8.1) (Minnesota DNR 1998). It encompasses the portion of Glacial Lake Agassiz where peatland is now dominant.
The southern boundary is the southern extent of Glacial Lake Agassiz where it meets Des Moines Lobe ground moraines and end moraines. The eastern boundary is the interface between the peatland’s eastern edge and the western edge of the landscape dominated by dry mineral soils. The western boundary is the western extent of the large peatlands and conifer bogs and swamps, as delineated on Marschner’s "Original Vegetation of Minnesota" map (Marschner, 1974).
The Agassiz Lowlands is a landscape of peatlands on a large flat, poorly drained glacial lakebed (Figure 8.7.1.a). Remnant beach ridges of sandy, well-drained soils are distributed throughout these peatlands (Figure 8.7.2.b). Soils are mostly organic (Figure 8.7.2.b). The Big Fork and Rainy Rivers drain the subsection to the north. Three large remnants of Glacial Lake Agassiz, Lower Red Lake, Upper Red Lake and Lake of the Woods, are found here (Figure 8.7.2.a).
The dominant historic vegetation cover type was conifer bogs and swamps, with significant areas of wet prairie, and muskeg (Figure 8.7.1.b). Aspen-birch forests were located along beach ridges and major watercourses throughout the area. Today the climate is cold, with a short growing season (98-111 days) and 21-25 inches annual rainfall (Minnesota DNR, 1998).
8.7.2 Site Probability Model
8.7.2.1 Description
This site probability model (Figure 8.7.3) for Agassiz Lowlands is based on the combined data of three subsections: Littlefork-Vermilion Uplands, Agassiz Lowlands, and Aspen Parklands. Zones of high site potential are located primarily along rivers and large lakeshores. The larger contiguous areas are along the major rivers, notably the Rainy River (located along the US/Canada border) and its tributaries; the lower Big Fork, Black, and Rapid Rivers in the northeast corner of the subsection; along the Roseau and South Fork Roseau Rivers and Pine Creek in the northwest; along the Warroad River in the northwest; and along the upper Rapid River in the central portion of the subsection. Zones of high site potential exist along the south and east shores of Lower Red Lake, the east and north shores of Upper Red Lake, along the northern border of the Northwest Angle, and a patch on the north shore of Lake of the Woods around Willow Creek. Around Lower Red Lake is a pattern of high site potential that shows a relation to the variables surface roughness (Figure 8.7.4.b) and height above surroundings (Figure 8.7.4.a).
Smaller zones of high site potential are located along many watercourses throughout the subsection. In the north they include the uplands around Canfield and Williams Creeks; zones along Peppermint Creek and Winter Road River; and zones along Bartons Brook. In the east, zones of high and medium site potential are present along the courses of the Big Fork, Sturgeon, and Bear Rivers. In the southeast zones of high site potential are located at the confluence of the Big Fork and Rice Rivers and north of Coddington Lake. Many of these small areas of high and medium site potential appear to be related to the variable vegetation diversity within 1 km (Figure 8.7.5.b), which itself may be associated with stream course, lakes, and areas of greater relief. Upstream from the confluence of the Big Fork with the Sturgeon River, excepting around its confluence with Caldwell Brook, most of the area of the high site potential along the Big Fork River follows its upper banks. Scattered areas of medium site potential in the southeast correlate to the variable height above surroundings. Many aberrations of this variable, caused by banded elevation grids, appear in the site probability model.
Zones of medium site potential are mostly associated with the high site potential zones described above. In addition, east of Lower Red Lake to the south shore of Upper Red Lake is a large zone of medium site potential. In the east and southeast, zones of medium site potential are scattered along most minor watercourses. In the northwest, several significant medium potential areas are found between Lake of the Woods and the Roseau River. One of these patches ends abruptly along a 24k quad boundary, although the quads on both sides appear to be from the same source. There are other artifacts, caused by elevation data. For example, banded elevation data produced short linear zones of higher site potential in the southeast corner of the subsection near the Itasca – Koochiching county border. These artifacts should not be considered as predictive features.
A challenge in interpreting the site probability model for this region is the linear configuration of artificial drainage networks, typical for the Agassiz Lowlands subsection. Since hydrological features dominate the extent and configuration of higher site potential zones, the latter often repeat linear outlines of drainage ditches. These produce linear patterns in the site probability model similar to those related to elevation variables. However, considering the relatively young historic age of these drainage systems, they are meaningless predictors for presettlement archaeological sites.
8.7.2.2 Evaluation
An individual subsection model was not developed for Agassiz Lowlands. Two models run previously in this individual section using different halves of the known sites had only 77.21 percent agreement (77.21 percent of the cells in the section were classified the same in both models). The Kappa statistic for these models was 0.392085 (Table 8.6.11). The conditional Kappa statistics (Table 8.7.1) are lowest for the medium site potential zone.
Table 8.7.1. Conditional Kappa Values for Site Probability Model, Agassiz Lowlands Individual Subsection.
Class |
Ki |
Proportion Correct |
Low |
0.4468 |
0.8617 |
Medium |
0.0742 |
0.1204 |
High |
0.6332 |
0.7066 |
The site probability model selected to represent this section was developed as a combined model for Littlefork-Vermilion Uplands, Agassiz Lowlands, and Aspen Parklands subsections. The site probability model performed very well. It is based on 9 variables (Table 8.7.2) representing topography, soils, and hydrology.
Table 8.7.2. Combined Site Probability Model, Littlefork-Vermilion Uplands, Agassiz Lowlands, and Aspen Parklands Subsections.
Intercept |
6.447 |
|
ln (nonsites/sites) |
4.026914598 |
|
Variable |
Regression Coefficient |
Probability |
Distance to edge of nearest perennial river or stream |
-0.0286743 |
100.0 |
Distance to nearest lake, wetland, organic soil, or stream |
-0.065035 |
100.0 |
Distance to nearest minor ridge or divide |
-0.0292014 |
91.7 |
Distance to permanent wetland inlets/outlets |
-0.00584929 |
67.1 |
Height above surroundings |
0.142962 |
100.0 |
Size of minor watershed |
0.0000480215 |
51.1 |
Surface roughness |
-0.0540765 |
88.2 |
Vegetation diversity within 1 km |
0.579644 |
100.0 |
Vertical distance to permanent water |
-0.0295729 |
100.0 |
When the combined model is applied to the Agassiz Lowlands section, 86.79 percent of all sites, excluding single artifacts, are in the high and medium site potential areas, which constitute 19.49 percent of landscape (Table 8.7.3). This produces a strong overall gain statistic of 0.77543 (Table 8.6.11). By comparison, 81 percent of modeled sites are in areas mapped as uplands in the National Wetlands Inventory. As these areas constitute only 26% of the area of the subsection, a model using only this variable would produce a gain statistic of 0.67901. The multivariate model does a better job of distinguishing between archaeological sites and their surrounding environment. The model performed almost as well with the test data as will the training data, predicting 85.71 percent of the test sites. This produced a gain statistic of 0.77258. However, the number of new sites in this region is quite low (7), and test results could change dramatically on the basis of two or three sites.
Table 8.7.3. Evaluation of Agassiz Lowlands Portion of Combined Site Probability Model, Littlefork-Vermilion Uplands, Agassiz Lowlands, and Aspen Parklands Subsections.
Region (30 meter cells) |
Random Points |
Negative Survey Points |
Modeled Sites |
Test Sites |
||||||
# |
% |
# |
% |
# |
% |
# |
% |
# |
% |
|
Low |
13480539 |
67.64 |
2728 |
68.29 |
65 |
47.45 |
7 |
13.21 |
1 |
14.29 |
Medium |
2651165 |
13.30 |
556 |
13.92 |
31 |
22.63 |
15 |
28.30 |
2 |
28.57 |
High |
1233486 |
6.19 |
243 |
6.08 |
41 |
29.93 |
31 |
58.49 |
4 |
57.14 |
Water |
2563333 |
12.86 |
468 |
11.71 |
0 |
0 |
0 |
0 |
0 |
0 |
Steep Slopes |
24 |
0.00 |
0 |
0 |
0 |
0 |
0 |
0 |
0 |
0 |
Mines |
0 |
0 |
0 |
0 |
0 |
0 |
0 |
0 |
0 |
0 |
Total |
19928547 |
100.0 |
3995 |
100.0 |
137 |
100.0 |
53 |
100.0 |
7 |
100 |
Of the 137 sites used to build the model, 53 sites were in this subsection. Two preliminary models for the combined subsections, using different halves of the known sites, had 81.7 percent agreement within this section (81.7 percent of the cells in the section were classified the same in both models). The Kappa statistic for these models, which is adjusted for the amount of agreement expected by chance alone, was 0.55809 (Table 8.6.11). The conditional Kappa statistics (Table 8.7.4) are lowest for the medium site potential zone, but this is only 13 percent of the subsection area.
Table 8.7.4: Conditional Kappa Values for the Agassiz Lowlands portion of the Site Probability Model, Littlefork-Vermilion Uplands, Agassiz Lowlands, and Aspen Parklands Combined Site Model
Class |
Ki |
Proportion Correct |
Low |
0.6932 |
0.9227 |
Medium |
0.3455 |
0.4444 |
High |
0.5750 |
0.6179 |
8.7.2.3 Interpretation
There are nine variables involved in the construction of the Agassiz Lowlands model. Four variables are related to topographic features while four are hydrologic in nature (Table 8.7.5). The other variable is vegetation diversity within 1 km.
Table 8.7.5. Model Variable Statistics, Agassiz Lowlands
Agassiz Lowlands |
Modeled |
Surveyed |
Modeled Sites |
Sites in |
Negative Survey Points |
Random |
||||||
Model Variable |
Coeff. |
Sign. |
Coeff. |
Sign. |
Mean |
S.D. |
Mean |
S.D. |
Mean |
S.D. |
Mean |
S.D. |
Distance to nearest major ridge or divide |
- |
- |
-0.073 |
0.938 |
76.14 |
43.16 |
98.37 |
45.93 |
77.33 |
49.1 |
76.46 |
35.25 |
Distance to nearest minor ridge or divide |
-0.555 |
0 |
-0.342 |
0 |
21.49 |
17.56 |
33.97 |
23.04 |
23.01 |
15.61 |
34.95 |
20.1 |
Elevation |
- |
- |
-0.342 |
0 |
1139.09 |
83.85 |
1218.14 |
75.18 |
1158.04 |
63.54 |
1179.7 |
74.11 |
Height above surroundings |
0.323 |
0 |
0.278 |
0 |
6.43 |
10.69 |
1.71 |
1.7 |
2.91 |
5.32 |
1.11 |
2.98 |
Size of major watershed |
- |
- |
0.093 |
0.252 |
1710.43 |
423.1 |
1864.63 |
328.95 |
1733.31 |
396.94 |
1715.1 |
395.24 |
Size of minor watershed |
-0.273 |
0 |
- |
- |
11727.86 |
12122 |
17943.3 |
17291.09 |
12547.73 |
12734.16 |
15532 |
12879 |
Surface roughness |
-0.206 |
0.105 |
- |
- |
180.21 |
19.22 |
187.86 |
11.14 |
179.03 |
11.64 |
180.94 |
12.31 |
Direction to nearest water or wetland (sine) |
- |
- |
-0.124 |
0 |
0.31 |
0.72 |
0.77 |
0.36 |
0.36 |
0.79 |
0.77 |
0.54 |
Distance to edge of nearest large wetland |
- |
- |
-0.095 |
0 |
23.89 |
16.46 |
20.04 |
17.29 |
17.26 |
15.57 |
29.91 |
22.61 |
Distance to edge of nearest large lake |
- |
- |
-0.098 |
0 |
141.06 |
81.35 |
97.59 |
82.97 |
88.26 |
52.6 |
124.3 |
56.97 |
Distance to edge of nearest perennial river or stream |
-0.635 |
0 |
-0.319 |
0 |
26.91 |
30.37 |
65.14 |
28.35 |
39.42 |
30.4 |
53.51 |
28.53 |
Distance to nearest confluence between perennial or intermittent streams and large rivers |
- |
- |
-0.499 |
0 |
57.6 |
47.1 |
107.67 |
49.08 |
87.59 |
38.55 |
107.28 |
41.19 |
Distance to nearest intermittent stream |
- |
- |
-0.019 |
0 |
42.77 |
21.13 |
60.21 |
27.12 |
44.68 |
23.43 |
65.95 |
33.81 |
Distance to nearest lake inlet/outlet |
- |
- |
-0.334 |
0 |
76.09 |
38.83 |
99.21 |
25.6 |
68.38 |
28.46 |
88.14 |
32.47 |
Distance to nearest permanent wetland inlet/outlet |
-0.494 |
0 |
- |
- |
183.71 |
65.17 |
229.6 |
46.82 |
243.24 |
57.23 |
232.52 |
59.91 |
Distance to nearest lake, wetland, organic soil, or stream |
-0.098 |
0 |
-0.416 |
0 |
6.72 |
6.21 |
6.06 |
8.45 |
9.73 |
8.68 |
29.95 |
24.7 |
Distance to nearest permanent lake inlet/outlet |
- |
- |
-0.44 |
0 |
85.75 |
40.09 |
115.9 |
26.13 |
84.55 |
33.06 |
99.28 |
34.69 |
Vertical distance to permanent water |
0.142 |
0.557 |
- |
- |
6.55 |
19.76 |
10.57 |
25.79 |
13.39 |
18.13 |
7.49 |
14.5 |
Distance to aspen-birch |
- |
- |
-0.192 |
0 |
20.86 |
28.49 |
17.17 |
21.51 |
16.93 |
19.26 |
31.92 |
29.39 |
Distance to conifers |
- |
- |
-0.059 |
0 |
19.92 |
28.1 |
13.49 |
19.77 |
13.53 |
16.14 |
30.69 |
30.05 |
Distance to hardwoods |
- |
- |
-0.078 |
0.012 |
53.77 |
49.44 |
73.17 |
58.52 |
105.01 |
64.1 |
99.45 |
42 |
Distance to mixed hardwoods and pine |
- |
- |
-0.14 |
0.054 |
238.57 |
95.06 |
222.98 |
83.88 |
255.85 |
103.18 |
240.55 |
77.46 |
Distance to oak woodland |
- |
- |
0.358 |
0 |
267.59 |
48.44 |
229.01 |
69.16 |
251.59 |
50.8 |
226.25 |
67.88 |
Distance to pine barrens or flats |
- |
- |
0.457 |
0.039 |
104.36 |
55.86 |
87.54 |
64.52 |
113.51 |
70.77 |
101.51 |
48.33 |
Distance to river bottom forest |
- |
- |
-0.02 |
0.007 |
62.56 |
51.26 |
116.12 |
35.92 |
123.19 |
64.36 |
116.09 |
47.15 |
Vegetation diversity within 1 km |
0.402 |
0 |
0.257 |
0 |
2.72 |
0.82 |
2.14 |
0.69 |
2.26 |
0.75 |
1.85 |
0.75 |
Distance to edge of nearest area of organic soils |
- |
- |
-0.111 |
0 |
38.78 |
19.84 |
42.88 |
10.13 |
33.2 |
19.53 |
45.69 |
23.53 |
Distance to glacial lake sediment |
- |
- |
0.28 |
0 |
14.65 |
25.98 |
21.45 |
21.3 |
10.38 |
15.41 |
31.04 |
31.42 |
Frequency counts |
53 |
195 |
53 |
7 |
137 |
3994 |
||||||
See Section 8.7.3 for documentation of the statistics:
Coeff. = correlation coefficient
Sign. = significance of the Mann-Whitney U test
S.D. = standard deviation
Distances and areas are expressed in square roots of meters. Square the values in the table to get actual values.
8.7.2.3.1 Differences between Modeled Sites and Random Points for Individual Model Variables
This section attempts to illuminate the relationship between archaeological sites and their surroundings, as expressed by the site probability model. Data for variable values at random points are used to represent the overall environment of the subsection. Values in parentheses below refer to mean values for modeled sites (first) vs. mean values for random points (second). Means and standard deviations are summarized in Table 8.7.5.
Compared to random points, there is a tendency for sites to be in smaller minor watersheds (137.5 vs. 241 km2, Figure 8.7.9b) and closer to the nearest minor ridge or divide (462 vs.1222 meters, (Figure 8.7.8b). These variables differ so dramatically because of the geography of the subsection. The large lakes (Lake of the Woods, Upper and Lower Red Lake) and extensive peatlands occupy large watersheds in the north and south-central portions of the subsection (Figure 8.7.1a). Most known sites are in the smaller watersheds, with better drainage, forming an east-west band between the lakes. Sites are close to the edge of water than random points, whether it be the nearest perennial river or stream (724 vs. 2863 meters, Figure 8.7.10c) or the nearest lake, wetland, organic soil, or stream (45 vs. 897 meters, Figure 8.7.11d). One must remember, however, that in this subsection the highest values for these variables are in the centers of very large lakes and peatlands, which together occupy 76 percent of the subsection (Figure 8.7.1a). The proximity of sites to permanent wetland inlets/outlets (33,749 vs. 54,066 meters, Figure 8.7.11c) again reflects the subsection's geography. The nearest features of this type are peripheral to the Agassiz Lowlands, so that the lowest values for this variable are found in the eastern and western border areas, where sites are concentrated. The highest values are in the central area dominated by large lakes and peatlands. Sites are situated on terrain that is higher than its surroundings (6.43 vs. 1.11 feet, Figure 8.7.8d). but does not exhibit much difference in surface roughness (Figure 8.7.9c) or vertical distance to permanent water (6.55 vs. 7.49 feet, Figure 8.7.12b) than random sites. Perhaps because of their proximity to rivers and streams, sites tend to be situated in environments with higher vegetation diversity (Figure 8.7.14b). Vegetation diversity is, of course, lowest within lakes and peatlands.
Results of the Mann-Whitney U tests indicate that the differences in the values of sites and random points are significantly different at the 0.05 level for all except two variables (surface roughness and vertical distance to permanent water). In other words, the values of sites and random points are different enough on most variables to suggest they are derived from different populations. Variables that do not show a significant difference in the univariate analysis still contribute to the multivariate model. However, it is not possible to illustrate this contribute through univariate analysis.
8.7.2.3.2 Relationships between Variable Pairs
There are three sets of variables from the site model, all topographic in nature, that have moderately high correlations (i.e. 0.5 and above, Table 8.7.6). Height above surroundings (Figures 8.7.4a and 8.7.8d) is positively associated with surface roughness (0.68, Figures 8.7.4b and 8.7.9c) and vertical distance to permanent water (0.55, Figure 8.7.5a and 8.7.12b). Vertical distance from permanent water, in turn, is directly related to surface roughness (0.53). These relationships indicate that higher ground in this region is more rugged than lower ground adjacent to or within water bodies.
Table 8.7.6. Variable Correlation Matrix, Agassiz Lowlands.
Agassiz Lowlands |
Distance to nearest minor ridge or divide |
Height above surroundings |
Size of minor watershed |
Surface roughness |
Distance to edge of nearest perennial river or stream |
Distance to nearest permanent wetland inlet/outlet |
Distance to nearest lake, wetland, organic soil, or stream |
Vertical distance to permanent water |
Vegetation diversity within 1 km |
Distance to nearest minor ridge or divide |
1 |
||||||||
Height above surroundings |
-0.28 |
1 |
|||||||
Size of minor watershed |
0.3 |
0.13 |
1 |
||||||
Surface roughness |
-0.04 |
0.68 |
0.28 |
1 |
|||||
Distance to edge of nearest perennial river or stream |
0.35 |
-0.3 |
0.19 |
-0.08 |
1 |
||||
Distance to nearest permanent wetland inlet/outlet |
0.21 |
-0.34 |
0.3 |
-0.16 |
0.48 |
1 |
|||
Distance to nearest lake, wetland, organic soil, or stream |
-0.01 |
-0.11 |
-0.15 |
-0.26 |
0.07 |
0.13 |
1 |
||
Vertical distance to permanent water |
-0.08 |
0.55 |
0.09 |
0.53 |
-0.21 |
-0.45 |
-0.15 |
1 |
|
Vegetation diversity within 1 km |
-0.14 |
0.1 |
-0.02 |
-0.09 |
-0.15 |
-0.27 |
0 |
0.08 |
1 |
Refer to "Relationships between variable pairs" for interpretation of the table values.
8.7.2.3.3 Sites in Low Probability Areas
Sites in low probability areas are, in general, best described as those that the model predicts least well. They do not fit the pattern modeled. In this model, the average values of sites in low potential areas are closest to random points on 11 variables (Table 8.7.5). Most dramatically, these sites tend to be much farther from the nearest minor ridge or divide (1,154 vs. 462 meters, Figure 8.7.8b), placing them in the larger lake and peatland watersheds. Likewise, they are farther from the nearest perennial river or stream (4,261 vs. 724 meters, Figure 8.7.10c). On the other hand, the mean values of sites in low potential areas and modeled sites are close on three variables, the most dramatic of these being distance to nearest lake, wetland, organic soil, or stream (45 vs. 37 meters, Figure 8.7.11d). Mean values for sites in low potential areas are between all modeled sites and random points on three additional variables.
There are only seven sites in the low probability zones. One is a base camp, two are mortuary/cemetery sites, two are artifact scatters, and two are lithic scatters. If the model predicts all site types equally well, 13.21 percent of each type should be in the low site potential areas. With such a small number of sites, generalizations may not be as significant as in other subsections. The base camp is one of four in the region; the others are in the high probability zone. Proportionately, the model appears to do a poor job predicting mortuary/cemetery sites in this region. The two sites in low probability areas represent 25 percent of all sites of this type in the subsection. Artifact and lithic scatters are predicted at about the expected rate, with 12.5 percent of artifact scatters and 10.5 percent of lithic scatters in the low site potential zone.
8.7.2.3.4 Relationships between Cultural Context, Descriptive, or Settlement Variables and Site Potential.
There are not enough sites in this subsection to permit an analysis of the distribution of sites from various cultural contexts.
8.7.3 Survey Probability Model
8.7.3.1 Description
The following survey probability model description pertains to the Agassiz Lowlands portion of the survey probability model, selected to represent this section (Figure 8.7.6). This model was originally developed as a combined model for Littlefork-Vermilion Uplands, Agassiz Lowlands, and Aspen Parklands subsections.
There is a very close similarity in the location of high and medium survey potential zone distribution between the site and survey probability models. As in other subsections, the survey probability model displays a greater extent of high and medium survey potential zones than does the site probability model.
Several high and medium survey potential zones are present in locations not assigned high or medium site potential. Examples are near Lake of the Woods, east and south of Upper Red Lake, and in Marshall County. A chain of high and medium probability stretches from southwest to northeast across Lake of the Woods County. Hydrologic variables determining the survey probability model configuration in most areas, though a proximity to aspen-birch, conifers, and other vegetation types, often occupying the same landscape, plays a role.
There are artifacts in several parts of the survey probability model caused by the low resolution of the original digital elevation grids. Contours are apparent when these digital data are displayed and interpreted, resulting in abrupt changes of variable values for elevation and height above surrounding (Figure 8.7.4a) along their curves. Also, straight north – south and east – west lines appear in the variable grids as artifacts of quad sheet seams, for example in Beltrami county continuing north of the western shore of Lower Red Lake. These lines are reflected, though in a lesser extent than on the variable grids, in several places on the survey probability model.
The Agassiz Lowlands variables were derived primarily from low-resolution elevation data. Higher resolution data were available only for portions of Koochiching county at the northern and eastern edges of the subsection, and for portions of Itasca county at the southeast. The effects of edges between high and low resolution data appear here and there in the survey probability model. For example, the pattern of high/medium survey potential changes along the Sturgeon, Big Fork and Black Rivers in Koochiching County. Aggregated patterns are typical for upstream reaches of these rivers, while downstream reaches, where higher resolution maps were available, have narrow high survey potential zones distinctly tracing riverbanks amidst wider ribbons of medium survey potential zones, covering river valleys.
Considerations should be given to interpreting model artifacts resulting from the linear configuration of artificial drainage networks (Section 8.7.2.1) in this subsection. Since hydrological features dominate the extent and configuration of higher survey potential zones, the latter often repeat linear outlines of drainage ditches. In such cases linear patterns in the survey probability model are not related to flawed elevation variables. However, considering the young age of these drainage systems, they are meaningless predictors for archaeological survey potential. Hence, linear artifacts in the survey probability model should not be considered as predictive features.
8.7.3.2 Evaluation
The survey probability model (Figure 8.7.6), selected to represent this section, was developed as a combined model for Littlefork-Vermilion Uplands, Agassiz Lowlands, and Aspen Parklands subsections. The survey probability model predicted surveyed places in Agassiz Lowlands well, suggesting that surveys are not located randomly within the subsection. The model is based on 24 variables (Table 8.7.7), representing topography, vegetation, soils, geomorphology and hydrology.
Table 8.7.7. Combined Survey Probability Model, Littlefork-Vermilion Uplands, Agassiz Lowlands, and Aspen Parklands Subsections.
Intercept |
15.446 |
|
ln (nonsites/sites) |
1.921357209 |
|
Variable |
Regression coefficient |
Probability |
Direction to nearest water or wetland |
-0.2083746 |
100.0 |
Distance to aspen-birch |
0.009067051 |
100.0 |
Distance to conifers |
-0.01742775 |
100.0 |
Distance to edge of nearest area of organic soils |
-0.02000171 |
100.0 |
Distance to edge of nearest large lake |
-0.006447315 |
100.0 |
Distance to edge of nearest large wetland |
0.007661748 |
81.6 |
Distance to edge of nearest perennial river or stream |
-0.00548944 |
62.6 |
Distance to glacial lake sediment |
0.01206178 |
100.0 |
Distance to hardwoods |
-0.007828774 |
100.0 |
Distance to mixed hardwoods and pines |
-0.005505270 |
100.0 |
Distance to nearest confluence between perennial or intermittent streams and large rivers |
-0.01055636 |
100.0 |
Distance to nearest intermittent stream |
0.005373497 |
67.6 |
Distance to nearest lake inlet/outlet |
-0.008144397 |
100.0 |
Distance to nearest lake, wetland, organic soil, or stream |
-0.05448032 |
100.0 |
Distance to nearest major ridge or divide |
0.006981751 |
100.0 |
Distance to nearest minor ridge or divide |
-0.009719916 |
64.8 |
Distance to nearest permanent lake inlet/outlet |
0.007480810 |
100.0 |
Distance to oak woodland |
-0.009453103 |
100.0 |
Distance to pine barrens or flats |
0.01053629 |
100.0 |
Distance to river bottom forest |
.010036316 |
100.0 |
Elevation |
-0.01302934 |
100.0 |
Height above surroundings |
0.06082276 |
100.0 |
Size of major watershed |
0.00006009177 |
100.0 |
Vegetation diversity within 1 km |
0.4535275 |
100.0 |
When this combined model is applied to the Agassiz Lowlands subsection, 87.17 percent of all surveyed places are in the high and medium site potential areas, which constitute 36.38 percent of landscape (Table 8.7.8). This produces a reasonable gain statistic of 0.58256 (Table 8.6.14). Thus, this model was able to predict surveyed places with somewhat less precision than the site probability model was able to predict sites, indicating a distinct bias in locating surveys. With low numbers of both known sites (58) and negative survey points (137) in this subsection, there is a frequency of only 0.01 surveys per square km and only 0.003 known sites per square km.
Table 8.7.8. Evaluation of Agassiz Lowlands Portion of Combined Survey Probability Model, Littlefork-Vermilion Uplands, Agassiz Lowlands, and Aspen Parklands Subsections.
Region (30 meter cells) |
All random points |
All negative survey points |
All sites |
All sites and negative survey points |
||||||||
# |
% |
# |
% |
# |
% |
# |
% |
# |
% |
|||
Low |
10,093,535 |
50.73 |
2040 |
51.08 |
20 |
14.60 |
7 |
12.07 |
27 |
13.85 |
||
Medium |
3,335,873 |
16.76 |
692 |
17.33 |
28 |
20.44 |
11 |
18.97 |
39 |
20.00 |
||
High |
3,904,299 |
19.62 |
794 |
19.88 |
89 |
64.96 |
40 |
68.97 |
129 |
66.15 |
||
Water |
2,561,438 |
12.87 |
468 |
11.72 |
0 |
0 |
0 |
0 |
0 |
0 |
||
Steep Slopes |
24 |
0.00 |
0 |
0 |
0 |
0 |
0 |
0 |
0 |
0 |
||
Mines |
0 |
0 |
0 |
0 |
0 |
0 |
0 |
0 |
0 |
0 |
||
Total |
19,895,169 |
100.0 |
3994 |
100.0 |
137 |
100.0 |
58 |
100.0 |
195 |
100.0 |
||
Two models run previously in this individual section using different halves of the known surveyed places had 74.86 percent agreement (74.86 percent of the cells in the section were classified the same in both models). The Kappa statistic for these models was 0.42201. The conditional Kappa statistics (Table 8.7.9) are lowest for the medium site potential zone. A comparable individual survey probability model for this subsection was not developed.
Table 8.7.9. Conditional Kappa Values for the Individual Survey Probability Model, Agassiz Lowlands Subsection.
Class |
Ki |
Proportion Correct |
Low |
0.6122 |
0.9031 |
Medium |
0.1229 |
0.2106 |
High |
0.3848 |
0.4771 |
Two preliminary survey probability models had 90.85 percent agreement. The Kappa statistic for these models was 0.63303 (Table 8.6.14). The conditional Kappa statistics (Table 8.7.10) are lowest for the medium site potential zone, but this is less than 8 percent of the subsection area. Since this high stability was achieved by increasing the number of surveyed places for modeling, it is likely that more surveys, particularly throughout the undersurveyed areas, will improve models in this subsection.
Table 8.7.10. Conditional Kappa Values for the Agassiz Lowlands portion of the Survey Probability Model, Littlefork-Vermilion Uplands, Agassiz Lowlands, and Aspen Parklands Combined Site Model.
Class |
Ki |
Proportion Correct |
Low |
0.7195 |
0.9603 |
Medium |
0.3350 |
0.3772 |
High |
0.7111 |
0.7336 |
8.7.3.3 Interpretation
The survey probability model consists of 24 variables, five of which are also shared by the site probability model (Table 8.7.5). Thus, more than half of the site model variables appear in the survey model. Much of the difference between the models is due to the higher representation of vegetation variables in the survey probability model. Variables in the survey probability model include five topographic, nine hydrologic, and eight vegetation variables. Mean variable values for negative survey points and modeled sites are most similar for distance to nearest minor ridge or divide (529 vs. 462 meters, Figure 8.7.8b), distance to nearest lake, wetland, organic soil, or stream (95 vs. 45 meters, Figure 8.7.11d), distance to nearest permanent lake inlet/outlet (7149 vs. 7353 meters, Figure 8.7.12a), distance to nearest intermittent stream (1996 vs. 1829 meters, Figure 8.7.11a), direction to nearest water or wetland (0.36 vs. 0.31, Figure 8.7.9d), surface roughness (179.03 vs. 180.21, Figure 8.7.9c), distance to nearest major ridge or divide (5980 vs. 5797 meters, Figure 8.7.8a) and vegetation diversity within one kilometer (2.26 vs. 2.72, Figure 8.7.14b). Two variables have mean values for negative survey points falling between those for all modeled sites and random points (height above surroundings (Figure 8.7.8d), distance to edge of nearest perennial river or stream (Figure 8.7.10c)). These comparisons show that surveys tend to be in areas similar to sites. This conclusion is also supported by the Mann-Whitney U tests which indicate that the distribution of negative survey points is significantly different (at the 0.5 level) from random points on all except two variables, distance to nearest major ridge or divide (Figure 8.7.8a) and size of major watershed (Figure 8.7.9a, Table 8.7.5). This suggests that surveys in the Agassiz Lowlands have been conducted in a non-random fashion.
Relationships between modeled sites, negative survey points, and random points for the remaining variables in the survey probability model are illustrated in the following figures: elevation (Figure 8.7.8c), size of major watershed (Figure 8.7.9a), distance to edge of nearest large wetland (Figure 8.7.10a), distance to edge of nearest large lake (Figure 8.7.10b), distance to nearest confluence between perennial or intermittent streams and large rivers (Figure 8.7.10d), distance to nearest lake inlet/outlet (Figure 8.7.11b), distance to aspen-birch ( Figure 8.7.12c), distance to conifers (Figure 8.7.12d), distance to hardwoods (Figure 8.7.13a), distance to mixed hardwood and pine (Figure 8.7.13b), distance to oak woodland (Figure 8.7.13c), distance to pine barrens or flats (Figure 8.7.13d), distance to river bottom forest (Figure 8.7.14a), distance to edge of nearest area of organic soils ( Figure 8.7.14c), and distance to glacial lake sediment (Figure 8.7.14d).
8.7.4 Survey Implementation Model
As noted in the discussion above, the Agassiz Lowlands subsection has had few surveys and few sites are known there. Contrary to expectations, this is not reflected by an exceptionally large unknown area in the survey implementation model (Figure 8.7.7 and Table 8.7.11). Only 48.4 percent of the subsection is classified as unknown, which is very close to the state average. This indicates that the few surveys conducted have sampled a range of environment types, though their distribution was not random. The low and possibly low probability areas (low site probability, but in environments like those that have been surveyed) occupy 19.27 percent of the landscape, somewhat less than average. This implies that sites are likely to be found in most of the kinds of environments that have been surveyed.
Table 8.7.11. Evaluation of Survey Implementation Model, Agassiz Lowlands Subsection.
Region (30 meter cells) |
Random Points |
Negative Survey Points |
Single Artifacts |
Sites |
||||||
# |
% |
# |
% |
# |
% |
# |
% |
# |
% |
|
Unknown |
9,629,341 |
48.40 |
1947 |
48.75 |
15 |
10.95 |
0 |
0 |
3 |
5.66 |
Possibly Low |
2,360,138 |
11.86 |
496 |
12.42 |
17 |
12.41 |
0 |
0 |
1 |
1.89 |
Low |
1,474,077 |
7.41 |
284 |
7.11 |
31 |
22.63 |
1 |
20 |
3 |
5.66 |
Suspected Medium |
434,347 |
2.18 |
81 |
2.03 |
2 |
1.46 |
0 |
0 |
3 |
5.66 |
Possibly Medium |
822,312 |
4.13 |
168 |
4.21 |
9 |
6.57 |
2 |
40 |
6 |
11.32 |
Medium |
1,386,795 |
6.97 |
309 |
7.74 |
26 |
18.98 |
0 |
0 |
6 |
11.32 |
Suspected High |
29,847 |
0.15 |
12 |
0.30 |
3 |
2.19 |
0 |
0 |
1 |
1.89 |
Possibly High |
153,423 |
0.77 |
28 |
0.70 |
2 |
1.46 |
0 |
0 |
2 |
3.77 |
High |
1,043,427 |
5.24 |
201 |
5.03 |
32 |
23.36 |
2 |
40 |
28 |
52.83 |
Water |
2,561,438 |
12.87 |
468 |
11.72 |
0 |
0 |
0 |
0 |
0 |
0 |
Steep Slopes |
24 |
0 |
0 |
0 |
0 |
0 |
0 |
0 |
0 |
0 |
Mines |
0 |
0 |
0 |
0 |
0 |
0 |
0 |
0 |
0 |
0 |
Total |
19,895,169 |
100 |
3994 |
100 |
137 |
100 |
5 |
100 |
53 |
100 |
8.7.5 Other Models
The Landscape Suitability Models for the Red Lake Bog (Section 12.6) and a portion of the Rainy River (Section 12.5) are within this subsection. They should be referred to for both surface and subsurface information. At the surface, zones of no geomorphic potential can help rule out areas where surface surveys should be required. Subsurface geomorphic potential can help determine where deep site testing should be required.
8.8 Anoka Sand Plain
8.9 Aspen Parklands
8.10 Big Woods
8.11 Blufflands
8.12 Border Lakes
8.13 Chippewa Plains
8.14 Coteau Moraines / Inner Coteau
8.15 Glacial Lake Superior Plain/Northshore Highlands/ Nashwauk
Uplands
8.16 Hardwood Hills
8.17 Laurentian Highlands
8.18 Littlefork-Vermilion Uplands
8.19 Mille Lacs Uplands
8.20 Minnesota River Prairie
8.21 Oak Savanna
8.22 Pine Moraines & Outwash Plains
8.23 Red River Prairie
8.24 Rochester Plateau
8.25 St. Croix Moraines and Outwash Plains (Twin Cities Highlands)
8.26 St. Louis Moraines/ Tamarack Lowlands
8.27 Conclusion
References
The MnModel Final Report (Phases 1-3) is available on CD-ROM. Copies may be requested by visiting the contact page.