Quick Links
Chapters
- Management Summary
- Research Design & Time Line
- Environment & Native American Culture
- GIS Design
- Archaeological Database
- Archaeological & Environmental Variables
- Model Development & Evaluation
- Model Results & Interpretation
- Project Applications
- Model Enhancements
- Model Implementation
- Landscape Suitability Models
- Summary & Recommendations
Appendices
- Archaeological Predictive Modeling: An Overview
- GIS Standards & Procedures
- Archaeology Field Survey Standards, Procedures & Rationale
- Archaeology Field Survey Results
- Geomorphology Survey Profiles, Sections, & Lists
- Building a Macrophysical Climate Model for the State of Minnesota
- Correspondence of Support for Mn/Model
- Glossary
- List of Figures
- List of Tables
- Acknowledgments
8.25 ST. CROIX MORAINES & OUTWASH PLAINS SUBSECTION OF MINNESOTA & NE IOWA MORAINAL SECTION
8.25.1 Environmental Context
8.25.2 Site Probability Model
8.25.3 Survey
Probability Model
8.25.4 Survey Implementation Model
8.25.5 Other Models
This regional model report is organized as described in Sections 8.2.1 through 8.4.1. Refer to these sections of the report for explanations of the tables, variables, and statistics.
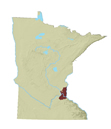
St. Croix Moraines and Outwash Plains is a subsection of the Minnesota and Northeast Iowa Morainal Section of the Eastern Broadleaf Forest Province (Figure 8.1) (Minnesota DNR 1998). It is dominated by a large moraine and areas of outwash plain.
The northern boundary is defined by the interface between Grantsburg Sublobe sediments to the north and Grantsburg Sublobe/Superior Lobe sediments to the south. The western boundary of the subsection is based on the interface between the Grantsburg Sublobe outwash sediments to the northwest and mixed Grantsburg Sublobe/Superior Lobe ice-contact sediments to the southeast. Terraces associated with the Mississippi River separate the St. Croix Moraines from the Anoka Sand Plain subsection. The south border is based on the interface between outwash plains on the north and northern extent of the pre-Wisconsin drift deposits (Dan Hanson, personal communication 1997). The subsection continues eastward into Wisconsin.
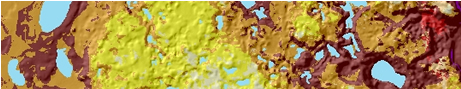
The St. Croix Moraines & Outwash Plains Subsection consists of the Superior Lobe end moraine complex, which cuts a swath from the southwest to the northeast (Figure 8.25.2.a). A series of outwash plains occupy the extreme north, the extreme south, and the center of the subsection. There are some areas of loess plain over bedrock or till in the southeastern portion of the unit. Topography consists of level to rolling hills with steep bluffs and exposed bedrock along the St. Croix River. The Mississippi River, which has a well-developed flood plain, runs through the center of this subsection. There are many lakes in the subsection, primarily in the moraines (Figure 8.25.1.a). Soils are mostly well-drained (Figure 8.25.2.b). Poorly drained and organic soils are found in in southeastern Anoka and northwestern Washington counties, in and around Lino Lakes and Forest Lake. A second large area of poorly drained soils is concentrated along the Vermillion River northeast of Farmington, in Dakota County.
The presettlement vegetation (Figure 8.25.1.b) consisted of a mosaic of oak openings, prairie, and Big Woods, with conifer bog and swamps reaching their southern range in the northern portion of the subsection. The southeast third was primarily prairie with oak savanna along the major river valleys . The far north of the subsection was a mix of aspen-oak woodland and Big Woods with small areas of conifer bog. The central portion was mostly oak savanna interspersed with large patches of Big Woods, most notably in northern Dakota and southeastern Ramsey Counties. Big Woods vegetation was restricted to the portions of the landscape with the greatest fire protection, either in steep, dissected ravines or where stream orientation reduced fire frequency or severity. Other vegetation include the river bottom forest found along the Mississippi and scattered wet prairie and marsh in the west-central part of the subsection.
8.25.2.1 Description
The site probability model for the St. Croix Moraines and Outwash Plains shows a strong relationship between archaeological site locations and surface water features (Figure 8.25.3). The largest areas of high and medium site potential are associated with the alluvium and terraces of the Mississippi, Minnesota, St. Croix, and Vermillion rivers and with lakes in the northern part of the subsection.
High site potential extends upland along the tributaries of the Mississippi and St. Croix rivers. From the Minnesota River valley, high and medium site potential zones scatter southeastward across northern Dakota County, through the area of Big Woods vegetation. This is an area of varied surface roughness (Figure 8.25.4.b), intermediate between the flat river valleys and the more rugged uplands to the south and east. The role of topography in the model is suggested in other places as well. Although places 20 feet or more above their surroundings (Figure 8.25.4.a) almost always are assigned high or medium site potential, there seems to be little distinction between probability classes below this threshold.
High and medium site potential extend upland along Valley Creek, Browns Creek and McKusick, Twin, Lily, and Silver lakes from the St. Croix valley. Along the northern stretch of the St. Croix, high and medium site potential zones widen and continue upland to Square and Big Carnelian lakes in northern Washington County. In the northern part of the subsection, lake size is an important factor determining the extent of high site potential. The larger zones are found around Big Marine, Forest, Clear, Bald Eagle, and White Bear lakes in northern Washington County. North from Bald Eagle Lake, a zone of high site potential extends to the conifer bog area between Oneka, Rice, and Egg lakes, with a similar zone along the northwestern boundary of the subsection.
Farther south, high and medium potential are associated with the confluence of the Mississippi, St. Croix, and Vermillion Rivers in central Dakota County. Another area of high and medium probability surrounds the upper South Branch of the Vermillion River.
High site potential extends the length of the Mississippi River, with river terraces occupied by a combination of high and medium probability. A large area of medium site potential is prominent along the river terrace prairie of southern Washington County. From the bend in the Mississippi in southern Ramsey County, high and medium site potential follow old Sand Creek northward to Sand Lake and Lake Como, to Lake Phalen, to Gervais Lake, and thence north toward Pleasant Lake and northeast toward White Bear Lake. This zone is associated with low values for surface roughness and height above surroundings (Figures 8.25.4a and 8.25.4b).
There is an aberration in the west-central part of the subsection (in central Ramsey County). This straight-line boundary between medium and low site potential follows the boundary between elevation data of different source scales and should not be interpreted as a predictive feature.
8.25.2.2 Evaluation
The site probability model developed for St. Croix Moraines & Outwash Plains is based on five variables (Table 8.25.1) representing topography, soils and hydrology. This is an unusually small number of variables for a model. It is also interesting that, despite the obvious association between high probability areas and rivers, there is no river variable in the model.
Table 8.25.1. Site Probability Model, St. Croix Moraines & Outwash Plains Subsection.
Intercept |
9.172 |
|
ln(nonsites/sites) |
1.848329821 |
|
Variable |
Regression Coefficient |
Probability |
Distance to edge of nearest area of organic soils |
-0.02054463 |
100.0 |
Elevation |
-0.01641109 |
100.0 |
Height above surroundings |
0.03038347 |
92.6 |
Size of nearest lake |
0.02386083 |
83.8 |
Surface roughness |
0.02784445 |
53.1 |
In this model, 86.51 percent of all known sites are in high/medium site potential areas, which make up 48.68 percent of landscape (Table 8.25.2). This produces a weak gain statistic of 0.43729 (Table 8.6.11). The lack of model precision, indicated by the large area classified as high and medium site potential, may be a function of the relatively small population of modeled sites. The model predicted all twelve test sites, producing a test gain statistic of 0.51318. It is apparent that model performance can be improved only by reducing the area designated as high and medium probability.
Table 8.25.2. Evaluation of the Site Probability Model, St. Croix Moraines & Outwash Plains Subsection.
Region (30 meter cells) |
Random Points |
Negative Survey Points |
Modeled Sites |
Test Sites |
||||||
# |
% |
# |
% |
# |
% |
# |
% |
# |
% |
|
Low |
1333270 |
48.68 |
410 |
51.25 |
166 |
32.74 |
16 |
12.70 |
0 |
0 |
Medium |
799951 |
29.21 |
219 |
27.38 |
192 |
37.87 |
17 |
13.49 |
5 |
41.67 |
High |
533305 |
19.47 |
158 |
19.75 |
146 |
28.80 |
92 |
73.02 |
7 |
58.33 |
Water |
66837 |
2.44 |
13 |
1.63 |
0 |
0 |
0 |
0 |
0 |
0 |
Steep Slopes |
5348 |
0.20 |
0 |
0 |
3 |
0.59 |
1 |
0.79 |
0 |
0 |
Mines |
0 |
0 |
0 |
0 |
0 |
0 |
0 |
0 |
0 |
0 |
Total |
2738711 |
100 |
800 |
100 |
507 |
100 |
126 |
100 |
12 |
100 |
The database included 126 sites that were not single artifacts. Two preliminary models using different halves of the known sites had almost full agreement (99.96 percent of the cells in the subsection were classified the same in both models). This is an exceptionally high level of agreement as compared to other regional models. The Kappa statistic, which is adjusted for the amount of agreement expected by chance alone, for this model was 0.99927 (Table 8.6.11). The conditional Kappa statistics (Table 8.25.3) demonstrate high level of agreement in all site potential zones. From this, we can conclude that the available database is internally consistent and that this is likely to be the best model possible of the data at hand. However, a larger database may include more variety and more information for distinguishing between site and nonsite locations.
Table 8.25.3. Conditional Kappa Values for Site Probability Model, St. Croix Moraines & Outwash Plains Subsections.
Class |
Ki |
Proportion Correct |
Low |
1.0000 |
1.0000 |
Medium |
0.9965 |
0.9971 |
High |
1.0000 |
1.0000 |
8.25.2.3 Interpretation
The St. Croix Moraines and Outwash Plains site model consists of five variables including three topographic, one hydrologic and one soils variable (Table 8.25.1).
8.25.2.3.1 Differences between Modeled Sites and Random Points for Individual Model Variables
There are only two variables possessing correlation coefficients with model values greater than 0.3, elevation (Figure 8.25.8a) and height above surroundings (Figure 8.25.8b). These two variables are also the only ones that are significant at the 0.05 level, according to the Mann-Whitney U test (Table 8.25.4). Thus, there is a significantly higher chance of finding sites at lower elevations on land elevated above its surroundings within this subsection. This is reinforced by the differences in mean elevations between sites (830 feet) and random points (911 feet) and in height above surroundings for sites (22 feet) and random points (10 feet). This means that, according to these two variables, sites and random points are not drawn from the same population.
The other three model variables, surface roughness (Figure 8.25.8c), size of nearest lake (Figure 8.25.9d), and distance to edge of nearest area of organic soils (Figure 8.25.12c) are not significant alone, but do provide information to the multivariate model.
Table 8.25.4. Model Variable Statistics.
St. Croix Moraines and Outwash Plains |
Modeled Sites |
Surveyed Areas |
Modeled Sites |
Sites in Low Prob. |
Neg. Survey Points |
Random Points |
||||||
Model Variable |
Coeff. |
Sign. |
Coeff. |
Sign. |
Mean |
S.D. |
Mean |
S.D. |
Mean |
S.D. |
Mean |
S.D. |
Elevation |
-0.614 |
0 |
- |
- |
829.82 |
96.17 |
946.19 |
46.92 |
881.32 |
98.03 |
910.65 |
81.85 |
Height above surroundings |
0.513 |
0 |
0.182 |
0 |
22.13 |
27.52 |
9.38 |
5.21 |
12.29 |
13.28 |
10.17 |
11.27 |
Surface roughness |
0.192 |
0.653 |
- |
- |
151.51 |
25.95 |
153.5 |
7.47 |
146.88 |
19.27 |
149.99 |
16.73 |
Distance to nearest confluence between perennial or intermittent streams and large rivers |
- |
- |
-0.463 |
0 |
87.22 |
37.7 |
91.09 |
27.58 |
81.68 |
33.51 |
92.71 |
30.33 |
Distance to nearest lake inlet/outlet |
- |
- |
-0.226 |
0 |
47.81 |
20.2 |
55.48 |
17.17 |
45.7 |
16 |
52.82 |
18.16 |
Distance to nearest lake, wetland, organic soil, or stream |
- |
- |
-0.172 |
0.016 |
11.28 |
8.18 |
8.28 |
8.98 |
11.55 |
8.82 |
12.94 |
9.25 |
Distance to nearest permanent wetland inlet/outlet |
- |
- |
0.117 |
0.003 |
144.18 |
32.03 |
151.24 |
16.12 |
151.65 |
22.6 |
144.87 |
28.5 |
Size of nearest lake |
-0.006 |
0.456 |
0.139 |
0.861 |
8.62 |
18.01 |
2.73 |
4.26 |
5.32 |
10.96 |
4.94 |
9.76 |
Vertical distance to permanent water |
- |
- |
-0.161 |
0.918 |
23.84 |
69.71 |
46.88 |
72.45 |
38.81 |
66.12 |
37.41 |
61.68 |
Distance to Big Woods |
- |
- |
0.136 |
0.057 |
49.79 |
33.48 |
57.24 |
37.85 |
56.56 |
31.25 |
53.15 |
36.38 |
Distance to conifers |
- |
- |
-0.012 |
0 |
163.69 |
56.26 |
186.29 |
47.93 |
176.56 |
55.94 |
184.65 |
59.41 |
Distance to hardwoods |
- |
- |
-0.437 |
0.001 |
34.03 |
28.53 |
49.18 |
30.87 |
39.19 |
23.23 |
45.67 |
32.34 |
Distance to oak woodland |
- |
- |
-0.136 |
0 |
13.71 |
19.12 |
16.66 |
23.14 |
12.95 |
18.97 |
19.89 |
22.73 |
Distance to prairie |
- |
- |
0.102 |
0.032 |
73.4 |
46.18 |
55.32 |
50.93 |
58.54 |
49.37 |
56.51 |
50.19 |
Distance to river bottom forest |
- |
- |
-0.361 |
0.014 |
100.53 |
69.25 |
95.97 |
42.56 |
95.87 |
57.71 |
102.75 |
48.21 |
Distance to sugar maple |
- |
- |
-0.655 |
0 |
70.11 |
28.9 |
88.24 |
22.65 |
76.28 |
25.93 |
87.23 |
26.79 |
Distance to bedrock used for tools |
- |
- |
-0.09 |
0 |
103.14 |
71.62 |
83.34 |
57.43 |
98.67 |
59.24 |
87.27 |
62.11 |
Distance to glacial lake sediment |
- |
- |
0.014 |
0.239 |
118.61 |
49.44 |
133.69 |
47.23 |
129.17 |
53.49 |
129.51 |
58.65 |
Distance to edge of nearest area of organic soils |
0 |
0.188 |
- |
- |
69.78 |
39.89 |
80.28 |
28.44 |
77.44 |
42.49 |
74.76 |
35.37 |
On river terraces |
- |
- |
0.339 |
0 |
0.28 |
0.45 |
0 |
0 |
0.18 |
0.38 |
0.07 |
0.25 |
Frequency counts |
125 |
641 |
125 |
16 |
504 |
787 |
||||||
See Interpretation section for discussion of the statistics:
Coeff. = correlation coefficient
Sign. = significance of the Mann-Whitney U test
S.D. = standard deviation
Distances and areas are expressed in square roots of meters. Square the values in the table to get actual values.
8.25.2.3.2 Relationships between Variable Pairs
From this model, only one variable pair has a correlation coefficient above 0.3 (Table 8.25.5). As height above surroundings increases, there is a tendency for surface roughness to also increase.
Table 8.25.5. Variable Correlation Matrix.
St. Croix Moraines and Outwash Plains |
Elevation |
Height above surroundings |
Surface roughness |
Size of nearest lake |
Distance to edge of nearest area of organic soils |
Elevation |
1 |
||||
Height above surroundings |
-0.16 |
||||
Surface roughness |
0.41 |
0.54 |
|||
Size of nearest lake |
0.19 |
-0.11 |
0.06 |
||
Distance to edge of nearest area of organic soils |
-0.38 |
0.38 |
0.07 |
-0.1 |
1 |
Refer to "Relationships between variable pairs" for interpretation of the table values.
8.25.2.3.3 Sites in Low Probability Areas
Sites in low site potential areas are at higher elevations, near smaller lakes, and farther from organic soils than either sites or random points. They are similar to random points in their averages for height above surroundings, but are similar to sites in surface roughness.
Of the 16 sites in low probability areas, one is a base camp, one a mound or earthwork, one an artifact scatter, and 13 are lithic scatters. If all sites types were predicted equally well by the model, 12.7 percent of each type should be in the low probability areas. As only two base camps are found in the subsection, no generalizations should be made about this type. Low probability areas hold only two percent of base camps and six percent of mounds/earthworks, indicating that these types are predicted better than expected by the model. Lithic scatters, however, are overrepresented in the low site potential areas, where one third of them occur. The model does a relatively poor job predicting locations of this site type.
8.25.2.3.4 Relationships between Cultural Context, Descriptive, or Settlement Variables and Site Potential
There are enough sites in this subsection to examine the distribution of sites across four cultural context or site type variables (Table 8.25.6). On three of these variables, sites are distributed across the three site potential classes in a non-random fashion, according to the chi-square test. Archaic sites, compared to sites lacking Archaic components, are over represented in the low to medium potential areas. Mirroring this is the distribution of aceramic sites, which also are heavily represented in the low and medium classes. Multiple component sites are also over represented in the two lowest probability classes, perhaps because sites containing Archaic occupations also have other (Woodland) components present.
Table 8.25.6. Summary of Bivariate Relationships between Nine Dichotomous Archaeological Variables and Three Areas of Site Potential, St.Croix Moraines and Outwash Plains (Site Probability Model).
Low Potential |
Medium Potential |
High Potential |
Total |
Chi-square Test |
|||||||
Dichotomous Variable |
N |
% |
N |
% |
N |
% |
N |
% |
value |
df |
p-value |
All Sites |
16 |
12.8 |
17 |
13.6 |
92 |
73.6 |
125 |
100.0 |
- |
- |
- |
Archaic |
2 |
16.7 |
3 |
25.0 |
7 |
58.3 |
12 |
100.0 |
9.71 |
2 |
0.01 |
Not Archaic |
2 |
3.2 |
3 |
4.8 |
57 |
91.9 |
62 |
100.0 |
|||
Aceramic |
2 |
16.7 |
3 |
25.0 |
7 |
58.3 |
12 |
100.0 |
9.71 |
2 |
0.01 |
Not Aceramic |
2 |
3.2 |
3 |
4.8 |
57 |
91.9 |
62 |
99.9 |
|||
Single Component |
1 |
1.8 |
3 |
5.5 |
51 |
92.7 |
55 |
100.0 |
7.92 |
2 |
0.02 |
Not Single Component |
3 |
15.8 |
3 |
15.8 |
13 |
68.4 |
19 |
100.0 |
|||
Mounds |
0 |
0.0 |
1 |
10.0 |
9 |
90.0 |
10 |
100.0 |
0.69 |
2 |
0.71 |
Not Mounds |
4 |
6.3 |
5 |
7.8 |
55 |
85.9 |
64 |
100.0 |
|||
8.25.3 Survey Probability Model
8.25.3.1 Description
The survey probability model (Figure 8.25.6) for the St. Croix Moraines & Outwash Plains subsection indicates that more than 61 percent of the landscape has been adequately surveyed. The highest values for survey potential are found in places that are close to lakes and major rivers. An extensive area of high and medium survey potential occupies western and northern Washington, Ramsey, and southern Anoka counties within the subsection limits. This zone extends southeast along the Mississippi River and southwest along the Minnesota River into northern Dakota County. At the confluence of the St. Croix and Mississippi Rivers, it extends north again into the St. Croix River valley. Areas of low survey potential occupy much of Dakota County, southeastern Washington County, and an urban highland extending from downtown St. Paul to the Highland Park area.
The distribution of surveys in this subsection has a significant effect on the distribution of high survey potential. Though plentiful, surveys are not uniformly distributed. Washington County has less than 45 percent of the subsection territory and 70 percent of all surveys. Within this county, surveys are distributed non-uniformly. A 22-km long linear survey track follows the right bank of the St. Croix River upstream from Hudson. Another densely surveyed corridor extends between White Bear, Bald Eagle, Oneka, and Big Marine lakes in northwestern Washington County. In the south half of this county the pattern of surveys is represented by several concentrations of 20-40 surveyed points, each concentration covering an area of 5-8 sq. km, thus leaving the rest of the territory undersurveyed. Surveys are located in Lake Elmo Regional Park and near the confluence of the St. Croix and the Mississippi Rivers, several are in Woodbury and Cottage Grove, and a linear survey track follows County Road 16.
Most of the surveys in Ramsey County are near lakes and streams, leaving the southwest portion of the county undersurveyed. The lack of surveys here is probably a result of how long the land has been urbanized. Dakota County has had only a few 2-5 km long linear tracks of surveys, usually along county highways. The number and areal extent of surveys in this county has not been adequate. More surveys are needed in this subsection so that a reliable survey probability model can be built without the use of data from adjacent subsections.
8.25.3.2 Evaluation
The survey probability model developed for the combined St. Croix Moraines & Outwash Plains and Oak Savanna subsections has been selected and reclassified to represent this region. The model is based on 17 variables (Table 8.25.7), representing topography, vegetation, soils and hydrology. Only two variables, height above surroundings and size of nearest lake, are shared with the site probability model.
Table 8.25.7. Survey Probability Model, St. Croix Moraines & Outwash Plains and Oak Savanna Subsection.
Intercept |
-23.621 |
|
ln(nonsites/sites) |
0.532424735 |
|
Variables |
Regression coefficient |
Probability |
Distance to Big Woods |
0.01306082 |
100.0 |
Distance to bedrock used for tools |
-0.004833709 |
88.6 |
Distance to conifers |
-0.006814942 |
50.9 |
Distance to glacial lake sediment |
-0.009165590 |
100.0 |
Distance to hardwoods |
-0.02162634 |
100.0 |
Distance to nearest confluence between perennial or intermittent streams and large rivers |
-0.005967824 |
95.8 |
Distance to nearest lake inlet/outlet |
-0.009989391 |
100.0 |
Distance to nearest lake, wetland, organic soils, or stream |
-0.02385895 |
100.0 |
Distance to nearest permanent wetland inlet/outlet |
0.008882318 |
89.1 |
Distance to oak woodland |
-0.01134827 |
100.0 |
Distance to prairie |
-0.01805440 |
100.0 |
Distance to river bottom forest |
0.009958951 |
100.0 |
Distance to sugar maple |
-0.01529638 |
100.0 |
Height above surroundings |
0.02505841 |
100.0 |
On river terraces |
0 0.8195428 |
100.0 |
Size of nearest lake |
0.010439773 |
58.5 |
Vertical distance to permanent water |
-0.004498306 |
100.0 |
When applied to the St. Croix Moraines & Outwash Plains subsection, the survey probability model performs somewhat better than by chance. In this model 87.05 percent of all surveyed places are in the high and medium survey potential areas, which constitute 61.78 percent of landscape (Table 8.25.8). This produces a weak gain statistic of 0.29029 (Table 8.6.14), which is acceptable for a survey probability model.
The survey probability model for the St. Croix Moraines and Outwash Plains predicts surveyed places with somewhat less precision than the site probability model predicts sites. Still, it illustrates a distinct pattern in the locations of past surveys. The St. Croix Moraines and Outwash Plains subsection contains a relatively small number of sites and negative survey points (135 and 504 respectively), slightly less than half the surveyed places used to construct the model. This reduces the level of confidence in the model and may explain why some areas in this subsection with few or no surveys are assigned high survey potential.
Although there are only 641 surveyed places in this subsection, the total land area is relatively small, so that the survey frequency is 0.26 surveys per square km. This is above the average for Phase 3 regions (Table 8.6.14). Site frequency, at 0.05 known sites per square km, is also above average.
Table 8.25.8. Evaluation of Survey Probability Model, St. Croix Moraines & Outwash Plains Subsection.
Region (30 meter cells) |
All random points |
All negative survey points |
All sites |
All sites and negative survey points |
||||||
# |
% |
# |
% |
# |
% |
# |
% |
# |
% |
|
Low |
974,388 |
35.58 |
294 |
37.36 |
69 |
13.69 |
14 |
10.22 |
83 |
12.95 |
Medium |
470,336 |
17.17 |
132 |
16.77 |
62 |
12.30 |
13 |
9.49 |
75 |
11.70 |
High |
1,221,801 |
44.61 |
361 |
45.87 |
373 |
74.01 |
110 |
80.29 |
483 |
75.35 |
Water |
66837 |
2.44 |
0 |
0 |
0 |
0 |
0 |
0 |
0 |
0 |
Steep Slopes |
5348 |
0.20 |
0 |
0 |
0 |
0 |
0 |
0 |
0 |
0 |
Mines |
0 |
0 |
0 |
0 |
0 |
0 |
0 |
0 |
0 |
0 |
Total |
2738710 |
100 |
787 |
100 |
504 |
100 |
137 |
100 |
641 |
100 |
Two preliminary survey probability models had only 77 percent agreement when applied to the St. Croix Moraines and Outwash Plains subsection. The Kappa statistic for these models was 0.44529 (Table 8.6.14). The conditional Kappa statistics (Table 8.25.9) are lowest for the medium potential zone. It is assumed that increasing the number of surveyed places for modeling will allow modeling with data from this subsection alone and improve model stability.
Table 8.25.9. Conditional Kappa Values for Survey Probability Model, St. Croix Moraines & Outwash Plains Subsection.
Class |
Ki |
Proportion Correct |
Low |
0.8081 |
0.8390 |
Medium |
0.0966 |
0.1713 |
High |
0.6464 |
0.9138 |
8.25.3.3 Interpretation
The survey probability model has considerably more variables than the site probability model. The 17 variables in this model include topography (one), hydrology (six), vegetation (seven), and soils (three) (Table 8.25.7). Five of these variables are correlated with site potential at a level of 0.3 or above (Table 8.25.4). These indicate that surveys have been closer to stream confluences (Figure 8.25.8d), hardwoods (Figure 8.25.10d), river bottom forests (Figure 8.25.11c), and sugar maple (Figures 8.25.5.b and 8.25.11d) than would be expected by chance. They are also more likely to be on river terraces than either sites or random points (Figure 8.25.12d).
Negative survey points have average values closer to random points on height above surroundings (Figure 8.25.8b), one of the key variables for distinguishing sites from random points. They are also similar to random points in their values for distance to conifers (Figure 8.25.10c) and distance to prairie (Figure 8.25.11b) . On the other hand, negative survey points are similar to sites in terms of distance to oak woodland (Figure 8.25.11a), distance to nearest lake inlet/outlet (Figure 8.25.9a), distance to nearest lake, wetland, organic soil, or stream (Figure 8.25.9b), and distance to bedrock used for tools (Figure 8.25.12a). They are somewhat farther from permanent wetland inlet/outlets than either sites or random points (Figure 8.25.9c).
All except four of the survey model variables are significant at the 0.05 level, as measured by the Mann-Whitney U test (Table 8.25.4). These variables are size of nearest lake (Figure 8.25.9d), vertical distance to permanent water (Figures 8.25.5.a and 8.25.10a) distance to Big Woods (Figure 8.25.10b), and distance to glacial lake sediment (Figure 8.25.12b). These results indicate that there are real differences in the environmental characteristics of surveyed areas and random points, suggesting that surveys have been conducted in a non-random fashion in this subsection.
8.25.4 Survey Implementation Model
The survey implementation model for St. Croix Moraines and Outwash Plains indicates that 24.57 percent of the subsection is classified as unknown because of inadequate survey (Table 8.25.10 and Figure 8.25.7). The most extensive unknown areas are in Dakota and Washington counties, with a much smaller area in southwest St. Paul. Low and possibly low site potential zones occupy 24.11 percent of the subsection. The largest of these crosses central Ramsey County, extending into western Washington County. Smaller areas of low site potential are found in northern Washington and northern Dakota counties and on the bluff tops above the confluence of the Mississippi and St. Croix rivers. More surveys are needed in this subsection to validate the model results and reduce the extent of the unknown area.
Table 8.25.10. Evaluation of Survey Implementation Model, St. Croix Moraines & Outwash Plains Subsection.
Region (30 meter cells) |
Random Points |
Negative Survey Points |
Single Artifacts |
Sites |
||||||
# |
% |
# |
% |
# |
% |
# |
% |
# |
% |
|
Unknown |
672,891 |
24.57 |
212 |
26.50 |
49 |
9.66 |
3 |
25.00 |
4 |
3.17 |
Possibly Low |
264,055 |
9.64 |
73 |
9.13 |
27 |
5.33 |
2 |
16.67 |
5 |
3.97 |
Low |
396,324 |
14.47 |
125 |
15.63 |
90 |
17.75 |
3 |
25.00 |
7 |
5.56 |
Suspected Medium |
233,549 |
8.53 |
62 |
7.75 |
18 |
3.55 |
0 |
0 |
7 |
5.56 |
Possibly Medium |
141,875 |
5.18 |
43 |
5.38 |
28 |
5.52 |
1 |
8.33 |
1 |
0.79 |
Medium |
424,527 |
15.50 |
114 |
14.25 |
146 |
28.80 |
1 |
8.33 |
9 |
7.14 |
Suspected High |
67,948 |
2.48 |
20 |
2.50 |
2 |
0.39 |
0 |
0 |
0 |
0 |
Possibly High |
64,406 |
2.35 |
16 |
2.00 |
7 |
1.38 |
0 |
0 |
4 |
3.17 |
High |
400,950 |
14.64 |
122 |
15.25 |
137 |
27.02 |
2 |
16.67 |
88 |
69.84 |
Water |
66837 |
2.44 |
13 |
1.63 |
0 |
0 |
0 |
0 |
0 |
0 |
Steep Slopes |
5348 |
0.2 |
0 |
0 |
3 |
0.59 |
0 |
0 |
1 |
0.79 |
Mines |
0 |
0 |
0 |
0 |
0 |
0 |
0 |
0 |
0 |
0 |
Total |
2738710 |
100 |
800 |
100 |
507 |
100 |
12 |
100 |
126 |
100 |
Several landscape suitability models are available for the St. Croix Moraines and Outwash Plains. The eastern subsection border is mapped by the St. Croix River model (Section 12.10). The Anoka Uplands model covers the southeast corner of Anoka County (Section 12.11). A very small portion of the Minnesota River model is within this subsection along the western border (Section 12.3). Finally, the U.S. Army Corps of Engineers has mapped the landform sediment assemblages of the Mississippi River valley through this subsection, but landscape suitability and subsurface characteristics have not been interpreted. The available landscape suitability models should be consulted where they are available. There is a great potential for buried sites within this subsection's river valleys.
8.26 St. Louis Moraines/ Tamarack Lowlands
8.27 Conclusion
References
The Mn/Model Final Report (Phases 1-3) is available on CD-ROM. Copies may be requested by visiting the contact page.

Acknowledgements
MnModel was financed with Transportation Enhancement and State Planning and Research funds from the Federal Highway Administration and a Minnesota Department of Transportation match.
Copyright Notice
The MnModel process and the predictive models it produced are copyrighted by the Minnesota Department of Transportation (MnDOT), 2000. They may not be used without MnDOT's consent.