Quick Links
Chapters
- Management Summary
- Research Design & Time Line
- Environment & Native American Culture
- GIS Design
- Archaeological Database
- Archaeological & Environmental Variables
- Model Development & Evaluation
- Model Results & Interpretation
- Project Applications
- Model Enhancements
- Model Implementation
- Landscape Suitability Models
- Summary & Recommendations
Appendices
- Archaeological Predictive Modeling: An Overview
- GIS Standards & Procedures
- Archaeology Field Survey Standards, Procedures & Rationale
- Archaeology Field Survey Results
- Geomorphology Survey Profiles, Sections, & Lists
- Building a Macrophysical Climate Model for the State of Minnesota
- Correspondence of Support for Mn/Model
- Glossary
- List of Figures
- List of Tables
- Acknowledgments
8.11 BLUFFLANDS SUBSECTION OF DRIFTLESS & DISSECTED PLATEAU SECTION
8.11.1 Environmental Context
8.11.2 Site Probability Model
8.11.3 Survey
Probability Model
8.11.4 Survey Implementation Model
8.11.5 Other Models
This regional model report is organized as described in Sections 8.2.1 through 8.4.1. Refer to these sections of the report for explanations of the tables, variables, and statistics.
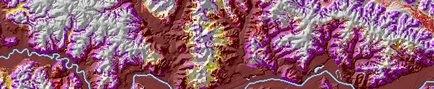
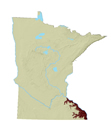
Blufflands is a subsection of the Minnesota and Northeast Iowa Moraine Section of the Eastern Broadleaf Forest Province (Figure 8.1) (Minnesota DNR 1998). The terrain is steeply dissected and dominated by the valley floors, terraces, and steep slopes of the Mississippi River and its major tributaries (Figure 8.11.1.a).
The complex western boundary follows major river valleys, marking a transition from a highly dissected landscape along the Mississippi River and its tributaries to the level to rolling topography of the Rochester Plateau subsection. To the north, the short boundary is based on the interface between the Superior or Des Moines Lobe outwash sediments and the Mississippi River Valley terraces as interpreted by Hobbs and Goebel, 1982 (Minnesota DNR, 1998). This boundary marks the northern extent of the loess deposits that characterize the Blufflands. The Mississippi River bounds the subsection to the east.
Blufflands topography was formed when a loess-covered plateau was deeply cut by rivers and streams (Figure 8.11.2.a). The valleys are up to 600 feet deep, with loess deposits lying directly on bedrock. To the west, the loess deposits thin to several feet where underlying glacial till influences the topography. The dendritic drainage system is highly developed (Figure 8.11.1.a), with numerous small streams feeding the major rivers (Mississippi, Cannon, Root, Whitewater, and Zumbro). Valley floors are covered with alluvial deposits (Figure 8.11.2.b). Natural lakes are absent from this subsection.
Vegetation before modern settlement was primarily deciduous forest (Figure 8.11.1.b). Oak openings and barrens covered the uplands in the western parts of the subsection, while Big Woods dominated in the east and south. River bottom forest and marshes were found on the lowland valley alluvium. Tall grass prairie was found occasionally in the south and the far north of the subsection, and along the Mississippi River.
8.11.2.1 Description
The Blufflands has the highest site frequency (0.12 sites per square km) of any subsection in the state. Sites in this area took advantage of the resources afforded by the river network and the location of a major population center at Red Wing, as well as a relatively long growing season. In the site probability model, high and medium site potential areas are strongly concentrated in the valley bottoms and on lower valley slopes of the Mississippi River and its major tributaries (Figure 8.11.3). From north to south these tributaries include the Cannon River (outlet is north of Red Wing in Goodhue County), the Zumbro River (outlet is south of Wabasha in Wabasha County), Whitewater River (outlet in northern Wabasha County), the Root River (outlet in northern Houston County), and the Crooked and Winnebago Creeks in southern Houston County.
The subsection is strongly dissected, and three elevation-derived variables (height above surroundings, surface roughness, and relative elevation) (Figures 8.11.4.a, Figure 8.11.5a, and 8.11.6.a) appear in the model. In the north, a wide swath of high site potential follows the Mississippi River to and along the Cannon River. In general, low values of the variable height above surroundings delimit the high site potential zone here (Figure 8.11.4.a). South of the Cannon River, a thin strip of high site potential follows the Mississippi River southeast to a second major concentration of high site potential along the wide valley bottom where the Zumbro and Whitewater Rivers join the Mississippi. High and medium site potential follow these two tributaries upstream, contained by the steep slopes that bound the valley bottoms (Figure 8.11.4.b). Throughout the Blufflands, steep slopes often limit the zones of high site potential. However, along the upper courses of smaller streams, a strip of low site potential is typically found between the steep slopes and higher site potential. This may be due to increasing surface roughness (Figure 8.11.5.a). An isolated patch of low site potential along the Mississippi valley between Maloney Lake and the Old Channel Zumbro River appears to correspond to high values of the variable distance to edge of nearest wetland, organic soil, or stream. Downstream high site potential lies along the river flats and tributary valleys, almost entirely confined by steep slopes. Along the South Fork of the Root River, high site potential continues far up the valley. A short stretch of medium site potential along this river in eastern Fillmore County appears to result from the absence of the South Fork Root River in the data defining the variable distance to nearest perennial river or stream. Finally, in the southeast portion of the subsection, the large areas of medium site potential along the river lowlands are relatively distant from tributary streams.
Because 1:24,000 scale DEMs were not available for nine quads in the region, artifacts of the boundaries between the 1:24,000 and 1:250,000 elevation data are apparent in the model. In northeastern Goodhue County, the western and southern edges of the Red Wing quad and the southern edges of the Bay City and Maiden Rock quads create linear artifacts, or false ridges, in the model. In the southern portion of the subsection, in southeastern Fillmore and southwestern Houston counties, the same phenomenon is observed along the northern edges of the Cherry Grove, Greenleafton, Harmony, and Spring Grove quads and along all four edges of the Houston quad in northern Houston and southern Winona Counties. These linear features are reflected locally in the site probability model, but do not appear to exert a great influence on the general pattern. None of these linear artifacts should be interpreted as predictive features.
The low resolution of the 1:250,000 data used in parts of this subsection diminished steep slope values, in effect smoothing the topography in the affected areas. In addition, all of the 1:24,000 DEMs in the subsection exhibit banding. This is manifest in the model as small striations, usually oriented in an east-west direction. These should not be interpreted as predictive features. The State of Minnesota and the USGS have plans to develop 1:24,000 DEMs for the remainder of the state and to construct new DEMs for the quads that now exhibit banding. When this project is completed, it will be possible to improve the models for this subsection.
8.11.2.2 Evaluation
This site probability model performed well. It is based on 14 variables (Table 8.11.1), representing topography, hydrology, geomorphology, and vegetation. In this model, 87.01 percent of all sites, excluding single artifacts, are in the high and medium site potential areas, which constitute 34.35 percent of the landscape (Table 8.11.2). This produces a good overall gain statistic of 0.60522 (Table 8.6.10). However, the model did not test well. Only 54.9 percent of sites from the test population were predicted, producing a gain statistic of 0.37432.
The database included 554 sites that were not single artifacts. Two preliminary models using different halves of the known sites had only 73 percent agreement (73 percent of the cells in the subsection were classified the same in both models).
Table 8.11.1. Site Probability Model, Blufflands Subsection.
Intercept |
5.783 |
|
ln (nonsites/sites) |
0.773 |
|
Variable |
Regression Coefficient |
Probability |
Distance to Big Woods |
-0.03073541 |
100.0 |
Distance to conifers |
0.03345428 |
100.0 |
Distance to edge of nearest perennial river or stream |
-0.03872369 |
100.0 |
Distance to glacial lake sediment |
-0.03701899 |
100.0 |
Distance to hardwoods |
0.02632716 |
70.2 |
Distance to nearest lake, wetland, organic soil, or stream |
0.03002173 |
74.3 |
Distance to nearest major ridge or divide |
-0.01294609 |
100.0 |
Distance to nearest minor ridge or divide |
-0.02665462 |
100.0 |
Distance to river bottom forest |
-0.010547262 |
67.5 |
Distance to sugar maple |
0.009975078 |
43.7 |
Height above surroundings |
0.01727115 |
100.0 |
Relative elevation |
0.01977643 |
100.0 |
Size of major watershed |
0.001164797 |
100.0 |
Surface roughness |
-0.04334543 |
100.0 |
The Kappa statistic, which is adjusted for the amount of agreement expected by chance alone for these models, was 0.52492 (Table 8.6.10). This is slightly less than the statewide average. The conditional Kappa statistics (Table 8.11.3) are lowest for the medium site potential zone, but this is less than nine percent of the subsection area. Replacing the 1:250,000 and banded 1:24,000 DEMs and increasing the number of sites for modeling may improve confidence in the model and model stability.
Table 8.11.2. Evaluation of Site Probability Model, Blufflands Subsection.
Region (30 meter cells) |
Random Points |
Negative Survey Points |
Modeled Sites |
Test Sites |
||||||
# |
% |
# |
% |
# |
% |
# |
% |
# |
% |
|
Low |
2798949 |
51.54 |
622 |
51.83 |
155 |
20.03 |
45 |
8.12 |
22 |
43.14 |
Medium |
466219 |
8.59 |
101 |
8.42 |
53 |
6.85 |
31 |
5.60 |
6 |
11.76 |
High |
1399109 |
25.76 |
295 |
24.58 |
533 |
68.86 |
451 |
81.41 |
22 |
43.14 |
Water |
109837 |
2.02 |
21 |
1.75 |
4 |
0.52 |
0 |
0 |
0 |
0 |
Steep Slopes |
656230 |
12.08 |
161 |
13.42 |
29 |
3.75 |
27 |
4.87 |
1 |
1.96 |
Mines |
0 |
0 |
0 |
0 |
0 |
0 |
0 |
0 |
0 |
0 |
Total |
5430344 |
100 |
1200 |
100 |
774 |
100 |
554 |
100 |
51 |
100 |
Table 8.11.3. Conditional Kappa Values for Site Probability Model, Blufflands Subsection.
Class |
Ki |
Proportion Correct |
Low |
0.6323 |
0.8529 |
Medium |
0.2513 |
0.4010 |
High |
0.6375 |
0.7100 |
8.11.2.3 Interpretation
The Blufflands site probability model is constructed from 14 variables (Table 8.11.4). Most of these are either topographic in nature (six) or relate to vegetation (five); the remaining represent hydrology and soils. The large number of topographic variables and correspondingly low number of hydrological variables, compared to other subsection models, are are attributable to the unique geography of this subsection. The Blufflands is the only part of Minnesota lacking lakes and and exhibiting such an extensive and intensive stream development.
8.11.2.3.1 Differences between Modeled Sites and Random Points for Individual Model Variables
In correlations with modeled sites, most of the model variables have correlation coefficients less than 0.3 (Table 8.11.4). However, compared to random points, sites tend to have, on average, 14 feet less of vertical relief within 90 meters (Figure 8.11.10a) and less surface roughness,a derivative of elevation, slope, and relative elevation (Figure 8.11.5.a and Figure 8.11.10d). Sites are also, on average, 485 meters closer to perennial rivers or streams (Figure 8.11.11a), and 1860 meters closer to river bottom forests (Figure 8.11.13a) than random points or nonsites. This is not particularly surprising, since most sites in the Blufflands are located on the streams and rivers that dissect the subsection.
Although the correlations are weaker, sites tend to be somewhat closer to both major and minor divides (Figures 8.11.9a and 8.11.9b) than do random points and are in slightly larger watersheds (Figure 8.11.10b). They are typically lower with respect to their surroundings (Figure 8.11.9d) and are closer to water (Figure 8.11.11b). Site distributions are correlated with proximity to hardwoods (Figure 8.11.12d) and sugar maple (Figures 8.11.13b and 8.11.5). However, their correlation with Big Woods is insignificant (Figure 8.11.12a).
The greater proximity of sites to glacial lake sediment (Figure 8.11.14b) and conifers (Figure 8.11.12c) is an artifact of the data. Neither glacial lake sediment or coniferous vegetation are present in the Blufflands. The nearest locations of those features are in the adjacent subsection to the north. The variables undoubtedly appear in the model because of the large concentration of known archaeological sites around Red Wing, in the northern portion of the Blufflands.
Values of these model variables for negative survey points are generally intermediate between those for random points and known archaeological sites (Table 8.11.4). This indicates that surveys were conducted in a non-random fashion, in areas similar to those where sites are located.
All variables in this model, except distance to Big Woods, are significantly correlated with sites at the 0.05 level based on the Mann-Whitney U test (Table 8.11.4). This indicates that the distributions of the modeled sites and random points are different enough to consider them as having been drawn from different populations.
Table 8.11.4. Model Variable Statistics
Blufflands |
Modeled Sites |
Surveyed Areas |
Modeled Sites |
Sites in Low Prob. |
Neg. Survey Points |
Random Points |
||||||
Model Variable |
Coeff. |
Sign. |
Coeff. |
Sign. |
Mean |
S.D. |
Mean |
S.D. |
Mean |
S.D. |
Mean |
S.D. |
Distance to nearest major ridge or divide |
-0.185 |
0 |
-0.441 |
0 |
66.48 |
33.75 |
63.52 |
33.27 |
61.87 |
36.54 |
73.64 |
33.19 |
Distance to nearest minor ridge or divide |
-0.278 |
0 |
-0.3 |
0 |
22.91 |
11.06 |
25.22 |
11.69 |
22.99 |
11.95 |
26.47 |
11.67 |
Elevation |
- |
- |
-0.692 |
0 |
821.21 |
147.77 |
1054.71 |
140.27 |
833.41 |
168.11 |
992.23 |
175.87 |
Height above surroundings |
-0.28 |
0 |
- |
- |
23.28 |
26.71 |
30.98 |
24.93 |
17.07 |
22.02 |
36.64 |
32.99 |
Relative elevation |
-0.305 |
0 |
- |
- |
33.05 |
30.56 |
41 |
24.61 |
27.5 |
31.69 |
47.12 |
36.75 |
Size of major watershed |
0.029 |
0 |
-0.236 |
0.001 |
1668.57 |
499.42 |
1554.1 |
600.93 |
1588.01 |
523.17 |
1538 |
560.22 |
Slope |
- |
- |
-0.544 |
0 |
4.7 |
5.08 |
5.73 |
3.79 |
3.94 |
4.89 |
7.44 |
6.6 |
Surface roughness |
-0.491 |
0 |
- |
- |
149.3 |
36.42 |
190.42 |
25.21 |
147.21 |
40.15 |
187.89 |
42.81 |
Distance to edge of nearest perennial river or stream |
-0.335 |
0 |
- |
- |
16.86 |
10.88 |
32.67 |
12.28 |
21.28 |
15.78 |
27.74 |
14.69 |
Distance to nearest lake, wetland, organic soil, or stream |
-0.01 |
0.002 |
- |
- |
10.67 |
6.95 |
11.77 |
8.07 |
11.08 |
9.2 |
11.34 |
7 |
Distance to nearest permanent wetland inlet/outlet |
- |
- |
-0.443 |
0 |
344.84 |
83.29 |
357.1 |
77.06 |
314.28 |
91.39 |
365.85 |
69.09 |
Vertical distance to water |
- |
- |
-0.334 |
0 |
33.97 |
67.67 |
79.38 |
105.06 |
24.78 |
54.14 |
61.81 |
82.85 |
Distance to Big Woods |
-0.213 |
0.24 |
0.001 |
0.001 |
23.14 |
22.28 |
34.55 |
28.82 |
32.59 |
26.3 |
26.84 |
28.17 |
Distance to brushlands |
- |
- |
0.388 |
0 |
23.03 |
25.33 |
19.07 |
31.92 |
22.37 |
22.89 |
19.15 |
24.39 |
Distance to conifers |
-0.237 |
0 |
- |
- |
372.09 |
73.94 |
382.89 |
66.21 |
346.25 |
80.66 |
391 |
60.84 |
Distance to hardwoods |
-0.227 |
0 |
-0.166 |
0.054 |
12.99 |
18.45 |
28.35 |
27.99 |
19.5 |
22.69 |
18.86 |
23.05 |
Distance to river bottom forest |
-0.403 |
0 |
- |
- |
35.44 |
34.71 |
57.91 |
34.21 |
40.95 |
33.96 |
55.8 |
34.06 |
Distance to sugar maple |
-0.253 |
0 |
- |
- |
56.62 |
22.01 |
70.37 |
21.44 |
54.5 |
26.09 |
68.56 |
23.97 |
On alluvium |
- |
- |
0.375 |
0 |
0.34 |
0.47 |
0.16 |
0.37 |
0.35 |
0.48 |
0.18 |
0.39 |
Distance to glacial lake sediment |
-0.241 |
0 |
-0.473 |
0 |
343.06 |
73.24 |
359.98 |
68.16 |
315.53 |
80.49 |
363.39 |
60.33 |
Distance to edge of nearest area of organic soils |
- |
- |
-0.267 |
0 |
207.64 |
76.23 |
218.27 |
85.63 |
195.47 |
66.22 |
222.64 |
70.36 |
Frequency counts |
554 |
1363 |
554 |
45 |
774 |
1200 |
||||||
See
Interpretation section for explanation of the statistics:
Coeff. = correlation coefficient
Sign. = significance of the Mann-Whitney U test
S.D. = standard deviation
Distances and areas are expressed in square
roots of meters. Square the values in the table to get actual values.
8.11.2.3.2 Relationships between Variable Pairs
A number of variables in the site probability model are interrelated. These relationships or variable redundancies can be explored by examining a matrix of all possible correlation coefficients (Table 8.11.5). Selecting only those coefficients with a value of 0.5 or higher, nine relationships are found.
As expected, there is redundancy among the three variables representing deciduous forest types. Distance to Big Woods (Figure 8.11.12a) is strongly correlated (0.69) with distance to hardwoods (Figure 8.11.12d). The Big Woods vegetation association is the most extensive type of hardwood forest in the Blufflands subsection. Distance to hardwoods is also moderately correlated (0.51) with distance to river bottom forest (Figure 8.11.13a), a less extensive hardwood forest variant found on valley floors. However, each variable provides slightly different information than the others. Distance to river bottom forest is most strongly correlated with site locations (Table 8.11.4), indicating the strong tendency for archaeological sites to be on or near valley floors. However, distance to Big Woods may help explain the distribution of sites away from valley floors, yet typically not in Oak Savanna, while distance to hardwoods may also include information about sites located in Oak Savanna, but not prairie.
The correlation (0.58) between distance to nearest perennial river or stream (Figure 8.11.11a) and distance to nearest lake, wetland, organic soil, or stream (Figure 8.11.11b) may be attributable to the dominance of streams in this subsection. In other parts of the state, lakes, wetlands, and organic soils would be more common hydrologic features.
Distance to conifers (Figure 8.11.12c) is highly correlated (0.96) with distance to glacial lake sediment (Figure 8.11.14b), indicating that they are measuring the same underlying dimension. This dimension, as explained in Section 8.11.2.3.1, is almost certainly the direction 'north,' as there is no good reason for sites in this subsection to be influenced by these relatively distant features. The fact that size of major watershed (Figure 8.11.10b) is moderately correlated with distance to conifers (0.59) and distance to glacial lake sediment (0.49) is possibly a fluke as well, as the northernmost watersheds in the subsection are relatively small and the largest major watershed is the most southerly (Figure 8.11.1.a).
The remaining correlations between variable pairs are not surprising. The relatively high positive correlation (0.68) between size of major watershed (Figure 8.11.10b) and distance to major ridge or divide (Figure 8.11.9a) should be expected, as the divides of larger watersheds may be further from their valley floors. Height above surroundings (Figure 8.11.4.a) is positively correlated (0.78) with relative elevation (Figure 8.11.6.a). As the height of a site increases above its surroundings, relative elevation (maximum elevation change within 90 meters) of the site also increases. Both variables have high correlations (0.71 and 0.76) with surface roughness (Figure 8.11.5.a), an index incorporating elevation, slope, and relative elevation.
Table 8.11.5. Variable Correlation Matrix.
The Blufflands |
Distance to nearest major ridge or divide |
Distance to nearest minor ridge or divide |
Height above surroundings |
Relative elevation |
Size of major watershed |
Surface roughness |
Distance to edge of nearest perennial river or stream |
Distance to nearest major ridge or divide |
1 |
||||||
Distance to nearest minor ridge or divide |
0.04 |
1 |
|||||
Height above surroundings |
0.04 |
0.01 |
1 |
||||
Relative elevation |
0.09 |
0.06 |
0.78 |
1 |
|||
Size of major watershed |
0.68 |
0.1 |
0.08 |
0.08 |
1 |
||
Surface roughness |
0.24 |
0.08 |
0.72 |
0.76 |
0.28 |
1 |
|
Distance to edge of nearest perennial river or stream |
-0.06 |
0.05 |
0.17 |
0.1 |
-0.02 |
0.16 |
1 |
Distance to nearest lake, wetland, organic soil, or stream |
-0.15 |
-0.13 |
0.14 |
0.03 |
-0.11 |
0.08 |
0.58 |
Distance to Big Woods |
0.06 |
-0.12 |
-0.08 |
-0.06 |
-0.14 |
-0.1 |
-0.07 |
Distance to conifers |
0.42 |
0.06 |
0.12 |
0.16 |
0.59 |
0.16 |
-0.01 |
Distance to hardwoods |
0.11 |
-0.02 |
-0.1 |
-0.07 |
-0.08 |
-0.04 |
0.05 |
Distance to river bottom forest |
0.1 |
0.12 |
-0.02 |
0.02 |
-0.01 |
0.16 |
0.07 |
Distance to sugar maple |
0.38 |
0.08 |
0.03 |
0.06 |
0.21 |
0.2 |
-0.09 |
Distance to glacial lake sediment |
0.29 |
0.05 |
0.12 |
0.16 |
0.49 |
0.1 |
-0.02 |
Distance to nearest lake, wetland, organic soil, or stream |
Distance to Big Woods |
Distance to conifers |
Distance to hardwoods |
Distance to river bottom forest |
Distance to sugar maple |
Distance to glacial lake sediment |
|
Distance to nearest major ridge or divide |
|||||||
Distance to nearest minor ridge or divide |
|||||||
Height above surroundings |
|||||||
Relative elevation |
|||||||
Size of major watershed |
|||||||
Surface roughness |
|||||||
Distance to edge of nearest perennial river or stream |
|||||||
Distance to nearest lake, wetland, organic soil, or stream |
1 |
||||||
Distance to Big Woods |
-0.02 |
1 |
|||||
Distance to conifers |
-0.17 |
-0.19 |
1 |
||||
Distance to hardwoods |
-0.01 |
0.69 |
-0.11 |
1 |
|||
Distance to river bottom forest |
-0.08 |
-0.05 |
0.1 |
0.51 |
1 |
||
Distance to sugar maple |
-0.14 |
0.19 |
0.29 |
0.28 |
0.33 |
1 |
|
Distance to glacial lake sediment |
-0.18 |
-0.18 |
0.96 |
-0.14 |
0.04 |
0.26 |
1 |
Refer to "Relationships between variable pairs" for interpretation of the table values.
8.11.2.3.3 Sites in Low Probability Areas
For most variables, average values for sites in the low probability areas are closer to those for random points than for all modeled sites (Table 8.11.4). In a number of cases, the variable means of the random points fall between those of modeled sites and sites in the low site potential zone. This implies that sites not well predicted by the model are in quite different environmental contexts than the majority of sites in the subsection. In general, these sites tend to be at higher elevations and on rougher terrain. They are farther from rivers, streams, and other bodies of water, both horizontally and vertically. They are also farther from Big Woods, hardwoods, river bottom forests, and sugar maples and closer to drier brushlands dominated by oaks.
Of these 45 sites, 32 are lithic scatters, eight are mounds or earthworks, four are artifact scatters, and one is a temporary camp. The temporary camp is the only site of its kind in the subsection. Temporary activity sites do not require the same resources as places with longer occupancy, which may make them more difficult to predict. If all sites are predicted equally well by the model, 8.12 percent of each site type should be found in low probability areas. However, only 4.71 percent of mounds and earthworks and 3.96 percent of artifact scatters are found in low probability areas. This implies that the model does a relatively good job predicting such sites in this subsection. Lithic scatters, however, are over represented (13.68 percent) in the low site potential areas. Fourteen of these sites are described in the SHPO database as being on bluffs and several more are described as being in river or stream settings. Given their relationship to the region's dominant hydrologic patterns, the use of better digital elevation models might help predict some of these sites in the future.
8.11.2.3.4 Relationships between Cultural Context, Descriptive, or Settlement Variables and Site Potential
There are enough sites present in this subsection to explore the relationships between seven dichotomous site variables and the three areas of site potential (Table 8.11.6). Three of these pairs are significant at the 0.05 level: Archaic/not-Archaic, aceramic/not-aceramic, and mounds/not-mounds. Sites with Archaic components are over-represented in the low and medium site potential zones (14.8 percent vs. 3.9 percent) and under-represented in areas of high site potential (74.1 percent vs. 90.7 percent) compared to sites lacking Archaic occupations. The situation is similar with aceramic sites, which also tend to occur more frequently in low site potential areas compared to sites containing pottery (12.8 percent vs. 3.9 percent). On the other hand, mound sites tend to be located in areas of medium site potential compared to sites lacking mounds (20.0 percent vs. 5.5 percent). Sites containing Mississippian and Oneota components tend to occur more frequently in high site potential areas compared to the distribution of all sites (96.6 percent and 97.0 percent vs. 85.6 percent). There is virtually no difference in the distribution of sites with single versus multiple components.
It should be no surprise that the model does a good job predicting more recent Mississippian and Oneota sites and a poor job predicting Archaic sites. The modern environmental data used for modeling more representative of the Terminal Woodland (ca. AD 500-1650) period than of the Archaic (prior to ca. 500 B.C.). Aceramic sites are difficult to interpret in the context of the model, because they could represent any number of activities and time periods. All Paleoindian and Archaic sites are aceramic, as are many temporary use sites.
The intermediate position of mounds in the model can only be interpreted by speculation. There are both environmental and cultural components to their locations. In this region, certain kinds of settings, such as bluffs overlooking rivers, had cultural value for locating mounds. These settings are in some ways similar to those used for habitation (along the river valleys), but are also different (higher elevation, farther from water). Thus, they may be somewhat well predicted by the models, but not as well as the majority of sites in the database.
Table 8.11.6. Summary of Bivariate Relationships between Seven Dichotomous Archaeological Variables and Three Areas of Site Potential, Blufflands (Site Probability Model).
Low Potential |
Medium Potential |
High Potential |
Total |
Chi-square Test |
|||||||
Dichotomous Variable |
N |
% |
N |
% |
N |
% |
N |
% |
value |
df |
p-value |
All Sites |
45 |
8.5 |
31 |
5.9 |
451 |
85.6 |
527 |
- |
- |
- |
|
Archaic |
4 |
14.8 |
3 |
11.1 |
20 |
74.1 |
27 |
100.0 |
7.98 |
2 |
0.02 |
Not Archaic |
10 |
3.9 |
14 |
5.4 |
233 |
90.7 |
257 |
100.0 |
|||
Woodland |
13 |
5.1 |
16 |
6.3 |
227 |
88.7 |
256 |
100.0 |
0.47 |
2 |
0.79 |
Not Woodland |
1 |
3.6 |
1 |
3.6 |
26 |
92.9 |
28 |
100.0 |
|||
Mississippian |
0 |
0.0 |
1 |
3.0 |
32 |
97.0 |
33 |
100.0 |
2.64 |
2 |
0.27 |
Not Mississippian |
14 |
5.6 |
16 |
6.4 |
221 |
88.0 |
251 |
100.0 |
|||
Oneota |
1 |
3.4 |
0 |
0.0 |
28 |
96.6 |
29 |
100.0 |
2.28 |
2 |
0.32 |
Not Oneota |
13 |
5.1 |
17 |
6.7 |
225 |
88.2 |
255 |
100.0 |
|||
Aceramic |
35 |
12.8 |
17 |
6.2 |
221 |
81.0 |
273 |
100.0 |
13.69 |
2 |
0.00 |
Not Aceramic |
10 |
3.9 |
14 |
5.5 |
230 |
90.6 |
254 |
100.0 |
|||
Single Component |
10 |
4.4 |
14 |
6.2 |
203 |
89.4 |
227 |
100.0 |
0.71 |
2 |
0.70 |
Not Single Component |
4 |
7.0 |
3 |
5.3 |
50 |
87.7 |
57 |
100.0 |
|||
Mounds |
0 |
0.0 |
3 |
20.0 |
12 |
80.0 |
15 |
100.0 |
6.61 |
2 |
0.04 |
Not Mounds |
45 |
8.8 |
28 |
5.5 |
439 |
85.7 |
512 |
100.0 |
|||
8.11.3 Survey Probability Model
8.11.3.1 Description
The survey probability model for the Bluffland subsection indicates that environmental settings away from river valleys have not been adequately surveyed (Figure 8.11.7). Comparing the site and the survey probability models reveals similarities in the distribution of high and medium potential zones along major rivers and in the appearance of artifacts caused by the digital elevation data. Only four percent more of the landscape is included in the high/medium survey potential category than in the high/medium site potential class of the site probability model. The most neglected areas are the upland plateaus.
An extensive zone of high survey potential surrounds Red Wing, in Goodhue County at the extreme north end of the subsection. This zone extends between the Vermillion River at Hastings south along the Mississippi River and inland. It extends further southwest along the Cannon, the Little Cannon Rivers and the Belle Creek, becoming narrower upstream. Almost 500 surveys are concentrated on less than 200 sq. km within and around this area. Surveys are most frequent in areas close to the Mississippi River, where there was a significant prehistoric city at Red Wing. Further west surveys are more likely to be associated with highway projects. The banded pattern, induced in the site probability model by the digital elevation data, is less visible in the survey probability model as solid high potential zones dominate the landscape without interruption by medium or low survey potential classes.
The Root River basin in Fillmore and Houston Counties, in the southern portion of the subsection, is also well-surveyed. In central/east central Houston County, one 22 km survey begins at the headwaters of Crystal Creek (a tributary of the Root River), then follows northeast along State Highway 44, generally parallel to Thompson Creek. Some survey locations in this area are associated with low survey potential zones. In the middle part of the subsection, within Wabasha County, surveys and the zone of the high survey potential are concentrated along the Zumbro River and its tributaries.
Poorly surveyed areas are generally located on the higher ground between river valleys. Archaeologists have surveyed intensively along drainage networks in this subsection. Thus, the Blufflands exhibits both one of the less random survey records in the state and the highest average survey frequency per unit area (Table 8.6.14).
Table 8.11.7. Survey Probability Model, Blufflands Subsection.
Intercept |
9.821 |
|
ln (non-surveys/surveys) |
-0.1274 |
|
Variable |
Regression coefficient |
Probability |
Distance to Big Woods |
-0.01154711 |
82.5 |
Distance to brushlands |
0.007937504 |
52.4 |
Distance to edge of nearest area of organic soils |
0.007634000 |
100.0 |
Distance to glacial lake sediment |
-0.05201020 |
100.0 |
Distance to hardwoods |
0.01595227 |
81.4 |
Distance to nearest major ridge or divide |
-0.009383893 |
100.0 |
Distance to nearest minor ridge or divide |
-0.02219198 |
100.0 |
Distance to nearest permanent wetland inlet/outlet |
0.03425522 |
100.0 |
Elevation |
-0.006627771 |
100.0 |
On alluvium |
-0.5580510 |
85.8 |
Size of major watershed |
0.001366059 |
100.0 |
Slope |
-0.04975710 |
94.8 |
Vertical distance to water |
0.003174390 |
97.8 |
8.11.3.2 Evaluation
The survey probability model predicted surveyed places significantly better than by chance. The model is based on thirteen variables (Table 8.11.7), representing topography, hydrology, geomorphology, and vegetation. These include six variables from the site probability model. In this model, 85.03 percent of all surveyed places are in the high and medium survey potential areas, which constitute only 38.65 percent of the landscape (Table 8.11.8). This produces a respectable gain statistic of 0.54545 (Table 8.6.13), suggesting that surveys have not been located randomly within the region.
The database included 1363 surveyed places. The Blufflands contains 1363 surveyed places (589 sites and 774 negative survey points) in a relatively small area (Table 8.6.14). Survey frequency is 0.28 surveys per square km, the highest value of all the subsections modeled (Table 8.6.13). However, this model was able to predict surveyed places with only somewhat less precision than the site probability model was able to predict sites. This suggests that surveys have been strongly biased towards the kinds of places where sites are expected to be.
Two preliminary survey probability models had 78 percent agreement. The Kappa statistic for these models was 0.64309 (Table 8.6.14), the fourth highest value in the state. The conditional Kappa statistics (Table 8.11.9) are lowest for the medium site potential zone, but this is less than 13 percent of the subsection area. Better elevation data and more surveys throughout the undersurveyed areas should improve the model.
Table 8.11.8. Evaluation of Survey Probability Model, Blufflands Subsection.
Region (30 meter cells) |
All random points |
All negative survey points |
All sites |
All sites and negative survey points |
||||||
# |
% |
# |
% |
# |
% |
# |
% |
# |
% |
|
Low |
2565459 |
47.24 |
579 |
48.25 |
91 |
11.76 |
52 |
8.83 |
143 |
10.49 |
Medium |
699968 |
12.89 |
156 |
13.00 |
63 |
8.14 |
62 |
10.53 |
125 |
9.17 |
High |
1398850 |
25.76 |
283 |
23.58 |
587 |
75.84 |
447 |
75.89 |
1034 |
75.86 |
Water |
109837 |
2.02 |
21 |
1.75 |
4 |
0.52 |
0 |
0 |
4 |
0.29 |
Steep Slopes |
656230 |
12.08 |
161 |
13.42 |
29 |
3.75 |
28 |
4.75 |
57 |
4.18 |
Mines |
0 |
0 |
0 |
0 |
0 |
0 |
0 |
0 |
0 |
0 |
Total |
5430344 |
100 |
1200 |
100 |
774 |
100 |
589 |
100 |
1363 |
100 |
Table 8.11.9. Conditional Kappa Values for Survey Probability Model, Blufflands Subsection
Class |
Ki |
Proportion Correct |
Low |
0.6609 |
0.8304 |
Medium |
0.4587 |
0.5940 |
High |
0.7645 |
0.8234 |
8.11.3.3 Interpretation
A total of 13 variables are used to create the survey probability model. Six of these variables are shared with the site probability model. The new variables are elevation (Figure 8.11.9c), slope (Figure 8.11.10c), distance to nearest permanent wetland inlet/outlet (Figure 8.11.11c), vertical distance to water (Figure 8.11.11d), distance to brushlands (Figure 8.11.12b), on alluvium (Figure 8.11.14a), and distance to edge of nearest organic soils (Figure 8.11.14c). Nine variables have correlation coefficients greater than 0.3 (Table 8.11.4) with surveyed places. The very strong negative correlations between surveyed places and both elevation and slope indicate that surveys have been conducted in low, flat areas compared to random points and many sites. In fact, surveys in the Blufflands have focused on the terraces along the rivers and streams.
The Mann-Whitney U test indicates that all variables except distance to hardwoods are significant at the 0.05 level (Table 8.11.4). This means that the values of the surveyed places and random points are dissimilar enough for 12 of the 13 variables to be considered drawn from different populations.
8.11.4 Survey Implementation Model
The survey implementation model for the Blufflands subsection classifies 43.48 percent of the land as unknown (Table 8.11.10 and Figure 8.11.8). This is a high proportion for an area with such a large number of surveyed places. As expected, the unknown area occupies the higher elevations above the valley bottoms. With the unknown area removed, the low and possibly low probability areas occupy only 8.07 percent of the landscape. In other words, wherever archaeological site potential can be estimated, it is almost always either high or medium. To reduce the unknown area will require surveys on slopes above the valley terraces. The proportion of the unknown area occupied by wetlands, pavement, and other unsurveyable land covers has not been calculated, but is expected to be small.
Of the 22 test sites not predicted, 20 were in the unknown zone. Sixteen of these are lithic and artifact scatters on terraces and bluffs within 400 meters of Minnesota Highway 58, in the Hay Creek valley. Previously, no sites were recorded in this area. Moreover, these terraces were not identified on the geomorphic data used for modeling. They are delineated on the 1:100,000 scale landform data that will be used for Phase 4 modeling. These data should help improve models for this subsection.
Table 8.11.10. Evaluation of Survey Implementation Model, Blufflands Subsection.
Region (30 meter cells) |
Random Points |
Negative Survey Points |
Single Artifacts |
Sites |
||||||
# |
% |
# |
% |
# |
% |
# |
% |
# |
% |
|
Unknown |
2360954 |
43.48 |
532 |
44.33 |
87 |
11.24 |
11 |
31.43 |
30 |
5.42 |
Possibly Low |
314422 |
5.79 |
66 |
5.5 |
33 |
4.26 |
2 |
5.71 |
13 |
2.35 |
Low |
123573 |
2.28 |
24 |
2 |
35 |
4.52 |
0 |
0 |
2 |
0.36 |
Suspected Medium |
136724 |
2.52 |
32 |
2.67 |
1 |
0.13 |
2 |
5.71 |
6 |
1.08 |
Possibly Medium |
188676 |
3.47 |
43 |
3.58 |
20 |
2.58 |
1 |
2.86 |
14 |
2.53 |
Medium |
140819 |
2.59 |
26 |
2.17 |
32 |
4.13 |
1 |
2.86 |
11 |
1.99 |
Suspected High |
67781 |
1.25 |
15 |
1.25 |
3 |
0.39 |
1 |
2.86 |
2 |
0.36 |
Possibly High |
196870 |
3.63 |
47 |
3.92 |
10 |
1.29 |
0 |
0 |
32 |
5.78 |
High |
1134458 |
20.89 |
233 |
19.42 |
520 |
67.18 |
16 |
45.71 |
417 |
75.27 |
Water |
109837 |
2.02 |
21 |
1.75 |
4 |
0.52 |
0 |
0 |
0 |
0 |
Steep Slopes |
656230 |
12.08 |
161 |
13.42 |
29 |
3.75 |
1 |
2.86 |
27 |
4.87 |
Mines |
0 |
0 |
0 |
0 |
0 |
0 |
0 |
0 |
0 |
0 |
Total |
5430344 |
100 |
1200 |
100 |
774 |
100 |
35 |
100 |
554 |
100 |
River bottoms, terraces, and colluvial features in the Blufflands subsection have the potential to contain deeply buried sites. Within this subsection, only the Root River Valley has been mapped for Mn/Model and landscape suitability models created (Section 12.9). The US Army Corps of Engineers mapped landscape sediment assemblages of the Mississippi River Valley from St. Paul south, but did not model landscape suitability or include mapping of subsurface characteristics. These models should be consulted for information regarding the geomorphic potential for both surface and subsurface archaeological sites.
8.12 Border Lakes
8.13 Chippewa Plains
8.14 Coteau Moraines / Inner Coteau
8.15 Glacial Lake Superior Plain/Northshore Highlands/ Nashwauk
Uplands
8.16 Hardwood Hills
8.17 Laurentian Highlands
8.18 Littlefork-Vermilion Uplands
8.19 Mille Lacs Uplands
8.20 Minnesota River Prairie
8.21 Oak Savanna
8.22 Pine Moraines & Outwash Plains
8.23 Red River Prairie
8.24 Rochester Plateau
8.25 St. Croix Moraines and Outwash Plains (Twin Cities Highlands)
8.26 St. Louis Moraines/ Tamarack Lowlands
8.27 Conclusion
References
The Mn/Model Final Report (Phases 1-3) is available on CD-ROM. Copies may be requested by visiting the contact page.

Acknowledgements
MnModel was financed with Transportation Enhancement and State Planning and Research funds from the Federal Highway Administration and a Minnesota Department of Transportation match.
Copyright Notice
The MnModel process and the predictive models it produced are copyrighted by the Minnesota Department of Transportation (MnDOT), 2000. They may not be used without MnDOT's consent.