Quick Links
Chapters
- Management Summary
- Research Design & Time Line
- Environment & Native American Culture
- GIS Design
- Archaeological Database
- Archaeological & Environmental Variables
- Model Development & Evaluation
- Model Results & Interpretation
- Project Applications
- Model Enhancements
- Model Implementation
- Landscape Suitability Models
- Summary & Recommendations
Appendices
- Archaeological Predictive Modeling: An Overview
- GIS Standards & Procedures
- Archaeology Field Survey Standards, Procedures & Rationale
- Archaeology Field Survey Results
- Geomorphology Survey Profiles, Sections, & Lists
- Building a Macrophysical Climate Model for the State of Minnesota
- Correspondence of Support for Mn/Model
- Glossary
- List of Figures
- List of Tables
- Acknowledgments
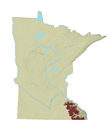
8.24 ROCHESTER PLATEAU SUBSECTION OF DRIFTLESS & DISSECTED PLATEAU SECTION
8.24.1 Environmental Context
8.24.2 Site Probability Model
8.24.3 Survey
Probability Model
8.24.4 Survey Implementation Model
8.24.5 Other Models
This regional model report is organized as described in Sections 8.2.1 through 8.4.1. Refer to these sections of the report for explanations of the tables, variables, and statistics.
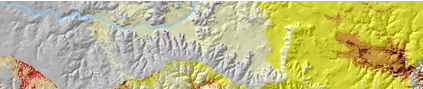
Rochester Plateau is a subsection of the Driftless & Dissected Plateau (or Paleozoic Plateau) Section of the Eastern Broadleaf Forest Province (Figure 8.1) (Minnesota DNR 1998). This subsection consists of level to gently rolling older till plains atop an old plateau.
The eastern boundary is a transition between the level to rolling plateau and steeply dissected landscapes of the Blufflands subsection (Minnesota DNR 1998). This boundary is also marked by the gradient from thin loess deposits on the plateau to much thicker deposits eastward. The western boundary is based on the interface between the plateau's oak/Big Woods/prairie vegetation complex and the oak savanna/prairie complex to the west. The northern boundary is defined by the northern extent of loess deposits and a small outwash plain.
In the west of the subsection, topography is controlled by underlying glacial till (Figure 8.24.2.a). Loess depth is variable, depending on the landscape. Sinkholes are common in the southwestern portion of the subsection. The depth of glacial drift over bedrock varies from 100 to 200 feet in the west to 10 to 100 feet in the east. Bedrock exposures are common, typically in areas with steep slopes. The subsection has a well-developed dendritic drainage system, and there are few lakes (Figure 8.24.1.a). Soils are well drained (Figure 8.24.2.b).
Vegetation in the 19th century was a complex mosaic of mostly fire-adapted vegetation communities (Figure 8.24.1.b). Oak savanna and brush prairie were predominant in the north, central, and southwest portions of the subsection. Tall grass prairie occurred throughout the subsection, interspersed with the oak openings. Big Woods vegetation was found in valleys that were protected from fire by the complex pattern of streams or more rugged topography. River bottom forest was found along the North Branch Root River and the North Fork Zumbro River.
8.24.2.1 Description
The site probability model for the Rochester Plateau shows areas of high and medium site potential concentrated in the western half of the subsection (Figure 8.24.3) and on the plateau above the Root and Zumbro rivers. In fact, the distribution of high and medium site potential corresponds closely with the headwaters of these rivers, of the Cannon River to the north of the subsection, and of the tributaries of these rivers. This is particularly interesting, since there are no river-related variables in the model.
In southern Fillmore County, the boundary between high/medium and low site potential closely follows major watershed boundaries. High and medium probability are found only in the watersheds draining north into the south branch of the Root River. A broad band of high and medium site potential crossing the Mower/Fillmore county lines between Spring Valley and Racine corresponds to the Bear Creek, Deer Creek, Little Kingsley Creek, and Spring Valley Creek valleys, all draining to the Root River. Where Olmsted, Winona, and Fillmore counties meet, east of Chatfield,m high and medium site potential are associated with Lynch Creek, Trout Run, Money Creek, and several unnamed creeks, also draining to the Root River.
Between Stewartville and Rochester, in Olmsted County, a large area of high and medium site potential is associated with the north branch of the Root River, Salem Creek, Cascade Creek, and the south fork of the Zumbro River. This zone spreads into Rochester along Bear Creek and its tributaries. However, all of the areas described thus far are quite broad, including stream valleys, hill slopes, and sometimes ridges.
North of Rochester, the is a close correspondence between the valleys and lower slopes of the middle fork of the Zumbro River and its south branch and high and medium site potential. However, this relationship to water breaks down as this zone nears Rochester and becomes more broad.
In Goodhue County, the North Fork of the Zumbro River and its tributaries broadly define the distribution of high and medium site potential. North of the divide between the Zumbro and Cannon River watersheds, high site potential is found primarily in the upper reaches of streams draining northward to the Cannon River.
The extensive area of low probability in eastern Olmsted, southern Wabasha, and western Winona counties corresponds generally with the large Whitewater River drainage. Other areas of low site potential are found along the north fork of the Zumbrota River between Zumbrota and Mazeppa and extending east from Goodhue along a ridge dividing streams draining south to the Zumbro from streams draining to the north into various minor tributaries of the Mississippi.
All of the 1:24,000 DEMs in the subsection exhibit banding. This is manifest in the model as small striations, usually oriented in an east-west direction. These should not be interpreted as predictive features.
8.24.2.2 Evaluation
The site probability model was developed from combined site data from the Blufflands and Rochester Plateau subsections. It is based on 14 variables (Table 8.24.1) representing topography, vegetation, geomorphology and hydrology.
Table 8.24.1. Site Probability Model, Blufflands and Rochester Plateau Subsections.
Intercept |
6.629 |
|
ln(nonsites/sites) |
1.245 |
|
Variable |
Regression Coefficient |
Probability |
Distance to Big Woods |
-0.01836655 |
100.0 |
Distance to brushlands |
0.03499502 |
61.0 |
Distance to conifers |
0.03900824 |
68.6 |
Distance to edge of nearest swamp |
-0.02135904 |
100.0 |
Distance to glacial lake sediment |
-0.04188619 |
100.0 |
Distance to hardwoods |
0.01454696 |
88.8 |
Distance to nearest major ridge or divide |
-0.010199386 |
100.0 |
Distance to nearest minor ridge or divide |
-0.02323024 |
100.0 |
Distance to oak woodland |
-0.02948146 |
60.7 |
Distance to prairie |
0.007067843 |
58.8 |
Elevation |
-0.008855604 |
100.0 |
Height above surroundings |
0.02285120 |
100.0 |
Size of major watershed |
0.001241987 |
100.0 |
Slope |
-0.10188149 |
100.0 |
The site probability model does not perform well within this subsection. When it is applied to the Rochester Plateau subsection, 85.19 percent of all sites, excluding single artifacts, are in the high and medium site potential areas, which constitute 51.47 percent of landscape (Table 8.24.2). This produces a weak overall gain statistic of 0.39575 (Table 8.6.11).
The database included 635 sites that were not single artifacts, but only 81 of them were in this subsection. Although low site numbers in this region required developing a combined model, the model is likely to perform better in the Blufflands where the bulk of the data were recorded. Only one new site was available for testing the model. It was predicted by the model, but the very small test population makes the results inconclusive. Even with 100 percent of the test sites predicted, the test gain was only 0.48523. The only way to improve model performance will be to reduce the area classified as high and medium probability.
Table 8.24.2. Evaluation of Rochester Plateau Portion of Site Probability Model, Blufflands and Rochester Plateau Subsections.
Region (30 meter cells) |
Random Points |
Negative Survey Points |
Modeled Sites |
Test Sites |
||||||
# |
% |
# |
% |
# |
% |
# |
% |
# |
% |
|
Low |
2,826,531 |
48.33 |
572 |
48.35 |
193 |
37.33 |
12 |
14.81 |
0 |
0 |
Medium |
1,069,227 |
18.28 |
198 |
16.74 |
93 |
17.99 |
15 |
18.52 |
0 |
0 |
High |
1,941,347 |
33.19 |
413 |
34.91 |
231 |
44.68 |
54 |
66.67 |
1 |
100 |
Water |
0 |
0 |
0 |
0 |
0 |
0 |
0 |
0 |
0 |
0 |
Steep Slopes |
11,235 |
0.20 |
0 |
0 |
0 |
0 |
0 |
0 |
0 |
0 |
Mines |
0 |
0 |
0 |
0 |
0 |
0 |
0 |
0 |
0 |
0 |
Total |
5848340 |
100.0 |
1183 |
100.0 |
517 |
100.0 |
81 |
100.0 |
1 |
100 |
Preliminary models, developed for the combined subsections and applied to the Rochester Plateau, had 79 percent agreement. A much lower level of agreement (55 percent) was observed for preliminary site models developed from only the 81 sites in this subsection. However, the Kappa statistic, which is adjusted for the amount of agreement expected by chance alone, for the model, was only 0.44729 (Table 8.6.11) for the combined models. This low Kappa indicates that this is a relatively unstable model. The conditional Kappa statistics (Table 8.24.3) are lowest for the high and medium potential zones, indicating that the greatest instability in this model is in distinguishing between the two zones. Doubling or tripling the number of sites for modeling may allow the subsection to be modeled independently and improve model performance and stability.
Table 8.24.3. Conditional Kappa Values of the Rochester Plateau Portion of Site Probability Model, Blufflands and Rochester Plateau Subsections.
Class |
Ki |
Proportion Correct |
Low |
0.5658 |
0.9026 |
Medium |
0.3498 |
0.4752 |
High |
0.3945 |
0.4136 |
8.24.2.3 Interpretation
The site probability model for the Rochester Plateau consists of six topographic, one hydrologic, six vegetation, and one soil variables (Figure 8.24.1a and 8.24.1.b).
8.24.2.3.1 Differences between Modeled Sites and Random Points for Individual Model Variables
Of these 14 variables, only four (distance to nearest major ridge or divide, elevation, distance to edge of nearest swamp, distance to glacial lake sediment) have correlation coefficients above 0.3 (Table 8.24.4). The differences between modeled sites and random points on these and other variables are small, possibly because the bulk of sites used for modeling were in the Blufflands. The Mann-Whitney U tests indicate that only five variables are significant at the 0.05 level, suggesting that for most of the variables, the sites and random points are not drawn from different populations.
Model values for modeled sites correlate most strongly with the variable distance to edge of nearest swamp (Figure 8.24.9d). Compared to random points, sites are closer to swamps by 661 meters. Swamps in this subsection are in river valleys and often serve as segments of rivers in the digital data. It may identify certain kinds of places in river valleys, perhaps wider and flatter places, that are associated with both swamps and archaeological sites. It may also indicate the value of swamps for protection from fires and as a source of firewood. Sites are further from the nearest major ridge or divide (7,127 vs. 5,027 meters, Figure 8.24.8a) than are random points, again indicating an attraction to river valleys. Sites also tend to be in larger major watersheds (Figure 8.24.9a), farther from conifers (Figure 8.24.11a), farther from prairies (Figure 8.24.12a).
Although the coefficients indicate that sites are higher in elevation (1193 vs. 1183 feet, Figure 8.24.8c) and closer to glacial lake sediment (111,189 vs. 112,024 meters, Figure 8.24.12c) than random points, these relationships are not significant. Elevations in the Rochester Plateau increase to the west and south, and glacial lake sediment occurs only to the west of the subsection. These variables may simply reflect the preponderance of both known sites and negative survey points in the western and southern portions of the subsection. Other variables that are not significant at the 0.05 level include distance to nearest minor ridge or divide (Figure 8.24.8b), slope (Figure 8.24.9b), height above surroundings (Figure 8.24.8d), distance to Big Woods (Figure 8.24.10c), distance to brushlands (Figure 8.24.10d), distance to hardwoods (Figure 8.24.11b), and distance to oak woodland (Figure 8.24.11c).
Table 8.24.4. Model Variable Statistics.
Rochester Plateau |
Modeled Sites |
Surveyed Areas |
Modeled Sites |
Sites in Low Prob. |
Neg. Survey Points |
Random Points |
||||||
Model Variable |
Coeff. |
Sign. |
Coeff. |
Sign. |
Mean |
S.D. |
Mean |
S.D. |
Mean |
S.D. |
Mean |
S.D. |
Distance to nearest major ridge or divide |
0.49 |
0.001 |
-0.437 |
0.007 |
84.42 |
35.72 |
59.03 |
58.44 |
62.62 |
35.74 |
70.9 |
36.32 |
Distance to nearest minor ridge or divide |
-0.071 |
0.794 |
-0.208 |
0.052 |
25.57 |
14.19 |
27.13 |
24.60 |
23.4 |
12.72 |
24.74 |
11.73 |
Elevation |
-0.348 |
0.23 |
0.409 |
0.012 |
1192.78 |
119.05 |
1249 |
125 |
1194.96 |
131.29 |
1183.3 |
91 |
Height above surroundings |
-0.136 |
0.102 |
- |
- |
12.59 |
10.06 |
8.0 |
6.0 |
10.71 |
10.24 |
14.67 |
12.07 |
Size of major watershed |
0.052 |
0 |
- |
- |
1950.38 |
302.81 |
1676.02 |
1328.22 |
1712.32 |
550.78 |
1765.8 |
446.54 |
Slope |
-0.105 |
0.297 |
- |
- |
2.69 |
2.09 |
2.0 |
2.0 |
2.14 |
2.18 |
3.04 |
2.54 |
Distance to edge of nearest large lake |
- |
- |
0.379 |
0 |
233.38 |
23.05 |
245.66 |
89.89 |
233.2 |
26.15 |
217.6 |
30.22 |
Distance to edge of nearest swamp |
-0.67 |
0 |
- |
- |
26.65 |
14.55 |
43.08 |
33.70 |
36.53 |
16.91 |
37.03 |
15.21 |
Distance to nearest intermittent stream |
- |
- |
0.085 |
0 |
18.5 |
7.72 |
16.34 |
13.30 |
17.74 |
6.99 |
15.28 |
6.68 |
Distance to nearest permanent wetland inlet/outlet |
- |
- |
0.721 |
0 |
364.59 |
45.47 |
370.93 |
207.28 |
362.42 |
55.72 |
349.31 |
52.69 |
Distance to Big Woods |
-0.045 |
0.693 |
- |
- |
59.86 |
37.1 |
72.68 |
59.81 |
68.11 |
29.29 |
63.29 |
31.72 |
Distance to brushlands |
0.189 |
0.225 |
- |
- |
8.16 |
13.07 |
7.21 |
13.45 |
6.67 |
12.26 |
9.91 |
13.97 |
Distance to conifers |
-0.268 |
0.001 |
- |
- |
400.74 |
41.21 |
403.19 |
211.80 |
397.51 |
50.33 |
384.48 |
46.14 |
Distance to hardwoods |
-0.244 |
0.571 |
- |
- |
48.61 |
30.99 |
67.26 |
50.10 |
52.42 |
25.16 |
52.51 |
26.64 |
Distance to oak woodland |
-0.054 |
0.065 |
- |
- |
12.41 |
15.34 |
26.17 |
26.93 |
14.48 |
17.01 |
16.18 |
17.57 |
Distance to paper birch |
- |
- |
-0.183 |
0.064 |
99.64 |
22.97 |
93.65 |
47.09 |
91.31 |
24.16 |
95.76 |
28.45 |
Distance to prairie |
0.214 |
0 |
- |
- |
38.7 |
25.12 |
44.81 |
50.99 |
34.42 |
25.54 |
28.09 |
26.47 |
Distance to edge of nearest area of organic soils |
- |
- |
0.803 |
0.602 |
166.93 |
50.99 |
194.29 |
136.87 |
183.47 |
53.32 |
178.77 |
50.33 |
Distance to glacial lake sediment |
-0.398 |
0.779 |
0.707 |
0.378 |
333.45 |
33.3 |
344.62 |
159.35 |
337.7 |
40.4 |
334.65 |
39.45 |
On alluvium |
- |
- |
-0.134 |
0.069 |
0.05 |
0.22 |
0 |
0 |
0.02 |
0.12 |
0.01 |
0.1 |
On river terraces |
- |
- |
-0.109 |
0 |
0.1 |
0.3 |
0 |
0 |
0.07 |
0.25 |
0.02 |
0.12 |
Frequency counts |
81 |
620 |
81 |
12 |
517 |
1183 |
||||||
See Interpretation section for discussion of the statistics:
Coeff. = correlation coefficient
Sign. = significance of the Mann-Whitney U test
S.D. = standard deviation
Distances and areas are expressed in square roots of meters. Square the values in the table to get actual values.
8.24.2.3.2 Relationships between Variable Pairs
There is a modest amount of data redundancy in this model, as indicated by the seven variables forming 11 variable pairs with correlation coefficients above 0.5 (Table 8.24.5). The strongest correlation is between distance to conifers and distance to glacial lake sediment. Since both of these features occur outside of the subsection to the northwest, both variables essentially measure a northwest-southeast gradient. Their correlations with other variables indicate that higher elevations and larger major watersheds tend to be in the southeastern portion of the subsection.
The negative correlation between watershed size and distance to Big Woods may simply reflect the southeasterly distribution of Big Woods. Distance to Big Woods, a hardwood forest type, is correlated with distance to hardwoods, as should be expected. Distances to both Big Woods and hardwoods are negatively correlated with distance to brushlands. However, distance to oak woodland is positively correlated with distance to brushlands. These relationships reflect the role of fire in the pattern of vegetation within this landscape. Big Woods must grow in areas protected from fire, unlike the fire tolerant brushlands and oak savannas (Grimm 1984).
Two topographic variables, height above surroundings (Figure 8.24.4.a) and slope (Figure 8.24.4.b) are positively correlated. As expected, steeper slopes are found in places that are higher above their surroundings.
Table 8.24.5. Variable Correlation Matrix.
Rochester Plateau |
Distance to nearest major ridge or divide |
Distance to nearest minor ridge or divide |
Elevation |
Height above surroundings |
Size of major watershed |
Slope |
Distance to edge of nearest swamp |
Distance to nearest major ridge or divide |
1 |
||||||
Distance to nearest minor ridge or divide |
0 |
1 |
|||||
Elevation |
-0.36 |
-0.01 |
1 |
||||
Height above surroundings |
0.2 |
0.04 |
0.07 |
1 |
|||
Size of major watershed |
0.21 |
0.03 |
0.51 |
0.34 |
1 |
||
Slope |
0.26 |
-0.12 |
-0.05 |
0.65 |
0.3 |
1 |
|
Distance to edge of nearest swamp |
-0.25 |
-0.03 |
0.22 |
0.33 |
0.18 |
0.22 |
1 |
Distance to Big Woods |
-0.36 |
-0.02 |
-0.27 |
-0.26 |
-0.48 |
-0.27 |
-0.22 |
Distance to brushlands |
0.42 |
-0.06 |
-0.25 |
0.22 |
0.12 |
0.33 |
0.14 |
Distance to conifers |
-0.28 |
-0.2 |
0.74 |
0.11 |
0.59 |
0.12 |
0.29 |
Distance to hardwoods |
-0.38 |
0.14 |
0.15 |
0 |
-0.22 |
-0.1 |
0.03 |
Distance to oak woodland |
0.22 |
0 |
-0.23 |
0.11 |
-0.06 |
0.27 |
0.22 |
Distance to prairie |
0.18 |
0.06 |
0.07 |
-0.01 |
-0.03 |
-0.14 |
-0.14 |
Distance to glacial lake sediment |
-0.25 |
-0.27 |
0.58 |
0.2 |
0.53 |
0.22 |
0.4 |
Distance to Big Woods |
Distance to brushlands |
Distance to conifers |
Distance to hardwoods |
Distance to oak woodland |
Distance to prairie |
Distance to glacial lake sediment |
|
Distance to Big Woods |
1 |
||||||
Distance to brushlands |
-0.51 |
1 |
|||||
Distance to conifers |
-0.43 |
0.01 |
1 |
||||
Distance to hardwoods |
0.75 |
-0.57 |
-0.14 |
1 |
|||
Distance to oak woodland |
-0.35 |
0.74 |
-0.05 |
-0.42 |
1 |
||
Distance to prairie |
-0.07 |
-0.25 |
-0.25 |
-0.02 |
-0.3 |
1 |
|
Distance to glacial lake sediment |
-0.41 |
0.07 |
0.92 |
-0.14 |
-0.02 |
-0.26 |
1 |
Refer to "Relationships between variable pairs" for interpretation of the table values.
8.24.2.3.3 Sites in Low Probability Areas
Sites in low potential areas are, on average, distinct from both modeled sites and random points. They are at higher elevations, closer to major ridges or divides and farther from minor divides. Yet they tend to be on flatter slopes, with less height above their surroundings, and in smaller major watersheds. They are much farther from swamps than are most modeled sites. They tend to be close to brushlands and more distant from Big Woods, hardwoods, oak woodland, and prairie than either sites or random points.
All 12 of the sites in low probability areas are lithic scatters. If all site types were predicted equally well by the model, 14.81 percent of all lithic scatters should be in the low probability areas. However, the actual value is 20.69 percent, indicating that the model does a poor job predicting lithic scatters.
8.24.2.3.4 Relationships between Cultural Context, Descriptive, or Settlement Variables and Site Potential
An analysis was undertaken to examine the distribution of sites from different cultural contexts within each of the three site potential classes. As in other subsections, this was done by a series of bivariate tables designed to evaluate the statistical significance of these relationships via the chi-square test. Unfortunately, the sample sizes were not large enough to permit the use of the chi-square test or to obtain reliable and stable percentages. Therefore, the results of this analysis are not presented here.
8.24.3 Survey Probability Model
8.24.3.1 Description
The survey probability model for the Rochester Plateau subsection (Figure 8.24.6) indicates that some areas have been well surveyed and others neglected. Unlike other subsections, however, the pattern of bias appears to be more regional than slanted towards particular environments.
High and medium survey potential zones occupy three main areas in the subsection. The southernmost zone of high survey potential stretches along the southern subsection border, from Fillmore through Houston Counties, across all landscapes. This area contains 262 negative survey points and 48 known sites. Linear surveys, following State Highways 80 and 44, US Highways 52 and 63, and County State Aid Highways 2, 27, and 44. Other surveys in this area are found along stream courses.
North of this area, high and medium survey potential occupy a large portion of southwestern Winona County, the adjacent southeastern corner of Olmsted County, and northern Fillmore County. In contrast to the southern zone, this area contains only 10 negative survey points and no known sites. There are no linear surveys here. However, as this zone is part of the same Root River drainage as the zone to the south, it is likely the model detected environments here that are similar to those surveyed farther south.
The northernmost zone of high and medium survey potential extends from west to east across northern Olmsted through southern Wabasha County and northward into central Goodhue County. This area is part of the Zumbro River drainage, except along the northern subsection boundary where drainage is to the Cannon River. This area contains 168 negative survey points and 17 known sites. The most extensive linear survey is found along US Highway 52 in Olmsted County. Shorter linear surveys are recorded along US Highway 63 and County State Aid Highway 55 in Olmsted County and Minnesota Highway 19 and County State Aid Highway 9 in Goodhue County. Most other surveys in this area have been along streams, but some uplands have been surveyed as well.
The large zone of low survey potential in Olmsted, northeastern Mower, and northwestern Fillmore counties is interrupted by threads of medium survey potential in Olmsted County along major drainage divides and the upper reaches of Bear Creek and Badger Run. A linear survey, consisting of 18 negative survey points, along County State Aid Highway 2 in Fillmore County was apparently not sufficient to generate zones of high and medium survey potential. Likewise, the zone of low survey potential along the northeastern border of the subsection is not affected by a linear survey of 22 negative survey points along Minnesota Highway 58 in Goodhue County.
8.24.3.2 Evaluation
The survey probability model from the Blufflands and Rochester Plateau combined subsections was selected to represent this subsection. It is based on 13 variables (Table 8.24.6), representing topography, vegetation, soils and hydrology.
Table 8.24.6. Survey Probability Model, Blufflands and Rochester Plateau Subsections.
Intercept |
71.563( Actually 1.563 was used) |
|
ln(nonsites/sites) |
0.186 |
|
Variable |
Regression Coefficient |
Probability |
Distance to edge of nearest area of organic soils |
0.01405346 |
100.0 |
Distance to edge of nearest large lake |
0.006334456 |
100.0 |
Distance to glacial lake sediment |
-0.05642551 |
100.0 |
Distance to nearest intermittent stream |
0.01635376 |
96.1 |
Distance to nearest major ridge or divide |
-0.008788315 |
100.0 |
Distance to nearest minor ridge or divide |
-0.01240243 |
100.0 |
Distance to nearest permanent wetland inlet/outlet |
0.03487918 |
93.9 |
Distance to paper birch |
-0.006265096 |
100.0 |
Elevation |
-0.005349913 |
99.5 |
On alluvium |
-0.5232138 |
94.2 |
On river terraces |
0.5513332 |
65.4 |
Size of major watershed |
0.0007829348 |
100.0 |
Slope |
-0.04192310 |
95.8 |
The survey probability model is very weak, indicating a low degree of bias in the placement of past surveys. Within the Rochester Plateau subsection, 84.72 percent of all surveyed places are in the high and medium survey potential areas, which constitute 72.77 percent of landscape (Table 8.24.7). This produces a very weak overall gain statistic of 0.14105 (Table 8.6.14), only slightly better than by chance. This model was able to predict surveyed places with less precision than the site probability model was able to predict sites, indicating that sites are confined to approximately 71 percent of the total area surveyed. This relatively large percentage reflects the low precision of the site probability model.
Until a good model can be built using data only from the Rochester Plateau, confidence in this model should be considered low. With only 98 known sites and 517 negative survey points in this region, the frequency of 0.116 surveyed places per square km is below average for the state. However, linear surveys in some parts of the subsection appear to have been effective in reducing survey bias.
Table 8.24.7. Evaluation of Rochester Plateau Portion of Survey Probability Model, Blufflands and Rochester Plateau Subsections.
Region (30 meter cells) |
All random points |
All negative survey points |
All sites |
All sites and negative survey points |
||||||
# |
% |
# |
% |
# |
% |
# |
% |
# |
% |
|
Low |
1,581,284 |
27.04 |
309 |
26.12 |
74 |
14.31 |
19 |
19.39 |
93 |
15.12 |
Medium |
1,430,242 |
24.46 |
290 |
24.51 |
63 |
12.19 |
21 |
21.43 |
84 |
13.66 |
High |
2,825,579 |
48.31 |
584 |
49.37 |
379 |
73.31 |
58 |
59.18 |
437 |
71.06 |
Water |
0 |
0 |
0 |
0 |
0 |
0 |
0 |
0 |
0 |
0 |
Steep Slopes |
11,235 |
0.19 |
0 |
0 |
1 |
0.19 |
0 |
0 |
1 |
0.16 |
Mines |
0 |
0 |
0 |
0 |
0 |
0 |
0 |
0 |
0 |
0 |
Total |
5,848,340 |
100.0 |
1183 |
100.0 |
517 |
100.0 |
98 |
100.0 |
615 |
100.0 |
The database included 1978 surveyed places, with only 615 of these in the Rochester Plateau. Two preliminary survey probability models run using different halves of the data had 71 percent agreement within the Rochester Plateau. The Kappa statistic for these models was 0.56311 (Table 8.6.14), which is about average. The individual survey models for the Rochester Plateau subsection were rejected because it had only 43 percent agreement and a Kappa statistic of 0.06206. The conditional Kappa statistics (Table 8.24.8) for the combined model are lowest for the medium potential zone, indicating that assignment to this zone is the greatest source of model instability.
Table 8.24.8. Conditional Kappa Values of the Rochester Plateau Portion of Survey Probability Model, Blufflands and Rochester Plateau Subsections.
Class |
Ki |
Proportion Correct |
Low |
0.8527 |
0.9231 |
Medium |
0.2669 |
0.4349 |
High |
0.5755 |
0.7000 |
8.24.3.3 Interpretation
The survey probability model is built from 13 variables, six of which are also included in the site probability model (Table 8.24.6). Correlations between model values at surveyed places and individual variable values points out some survey biases not apparent in the model.
The most significant correlations are with five variables having coefficients above 0.3 and significance of 0.05 or better. Negative survey points tend to be situated closer to the nearest major ridge or divide (Figure 8.24.8a) than either sites or random points. They are also farther from organic soils (Figure 8.24.12b) than either sites or random points. The highest values for this variable are found in the southern and eastern portions of the subsection.
Both sites and negative survey points are at higher in elevations (Figure 8.24.8c) than random points and at similar elevations to sites. However, this may simply be indicative of the preponderance of surveys in the southern part of the subsection. Negative survey points are, on average farther from large lakes (Figure 8.24.9c) and from permanent wetland inlet/outlets (Figure 8.24.10b) than random points and at about the same distance from these as sites.
Surveyed places are not particularly distinct from modeled sites or random points on other variables that are unique to the survey probability model. Although negative survey points are closer to paper birch (Figure 8.24.5.a) than either sites or random points, the correlation with this variable is not significant. Negative survey points have average values between those for sites and random points on distance to nearest intermittent stream (Figure 8.24.10a), on alluvium (Figure 8.24.12d), and on river terraces (Figure 8.24.13a).
8.24.4 Survey Implementation Model
The survey implementation model for the Rochester Plateau indicates that only 13.84 percent of the subsection is classified as unknown because of inadequate survey (Table 8.24.9 and Figure 8.24.7). These areas are located primarily in the central and northern parts of the subsection. Low and possibly low site potential zones occupy 34.5 percent of the subsection. These are along the southern border and in portions of the Root and Zumbro River drainage basins. More surveys are needed in this subsection so that a reliable model can be built without the use of data from the adjacent Blufflands. Until then, this model should be somewhat suspect.
Table 8.24.9. Evaluation of Rochester Plateau Portion of Survey Implementation Model, Blufflands and Rochester Plateau Subsections.
Region (30 meter cells) |
Random Points |
Negative Survey Points |
Single Artifacts |
Sites |
||||||
# |
% |
# |
% |
# |
% |
# |
% |
# |
% |
|
Unknown |
809,185 |
13.84 |
154 |
13.02 |
45 |
8.70 |
2 |
11.76 |
4 |
4.94 |
Possibly Low |
728,603 |
12.46 |
12.51 |
19.27 |
18 |
3.48 |
1 |
5.88 |
1 |
1.23 |
Low |
1,288,743 |
22.04 |
270 |
22.82 |
130 |
25.15 |
3 |
17.65 |
7 |
8.64 |
Suspected Medium |
257,995 |
4.41 |
49 |
4.14 |
6 |
1.16 |
2 |
11.76 |
1 |
1.23 |
Possibly Medium |
292,682 |
5.00 |
60 |
5.07 |
21 |
4.06 |
1 |
5.88 |
3 |
3.70 |
Medium |
518,550 |
8.87 |
89 |
7.52 |
66 |
12.77 |
2 |
11.76 |
11 |
13.58 |
Suspected High |
514,104 |
8.79 |
106 |
8.96 |
23 |
4.45 |
1 |
5.88 |
9 |
11.11 |
Possibly High |
408,957 |
6.99 |
82 |
6.93 |
24 |
4.64 |
1 |
5.88 |
14 |
17.28 |
High |
1,018,286 |
17.41 |
225 |
19.02 |
183 |
35.40 |
4 |
23.53 |
31 |
38.27 |
Water |
0 |
0 |
0 |
0 |
0 |
0 |
0 |
0 |
0 |
0 |
Steep Slopes |
11,235 |
0.19 |
0 |
0 |
1 |
0.19 |
0 |
0 |
0 |
0 |
Mines |
0 |
0 |
0 |
0 |
0 |
0 |
0 |
0 |
0 |
0 |
Total |
5,848,340 |
100 |
1183 |
100 |
517 |
100 |
17 |
100 |
81 |
100 |
There is moderate to high potential for buried sites in portions of this subsection. The upper reaches of the landscape suitability model for the Root River are in the subsection. It should be consulted for both surface and subsurface site suitability whenever projects occur within its bounds. Although the Zumbro River valley has not been modeled, it is expected to have similar potential for buried sites.
8.25 St. Croix Moraines and Outwash Plains (Twin Cities Highlands)
8.26 St. Louis Moraines/ Tamarack Lowlands
8.27 Conclusion
References
The Mn/Model Final Report (Phases 1-3) is available on CD-ROM. Copies may be requested by visiting the contact page.

Acknowledgements
MnModel was financed with Transportation Enhancement and State Planning and Research funds from the Federal Highway Administration and a Minnesota Department of Transportation match.
Copyright Notice
The MnModel process and the predictive models it produced are copyrighted by the Minnesota Department of Transportation (MnDOT), 2000. They may not be used without MnDOT's consent.