Quick Links
Chapters
- Management Summary
- Research Design & Time Line
- Environment & Native American Culture
- GIS Design
- Archaeological Database
- Archaeological & Environmental Variables
- Model Development & Evaluation
- Model Results & Interpretation
- Project Applications
- Model Enhancements
- Model Implementation
- Landscape Suitability Models
- Summary & Recommendations
Appendices
- Archaeological Predictive Modeling: An Overview
- GIS Standards & Procedures
- Archaeology Field Survey Standards, Procedures & Rationale
- Archaeology Field Survey Results
- Geomorphology Survey Profiles, Sections, & Lists
- Building a Macrophysical Climate Model for the State of Minnesota
- Correspondence of Support for Mn/Model
- Glossary
- List of Figures
- List of Tables
- Acknowledgments
8.14 INNER COTEAU AND COTEAU MORAINES SUBSECTIONS OF NORTH CENTRAL GLACIATED PLAINS SECTION
8.14.1 Environmental Context
8.14.2 Site Probability Model
8.14.3 Survey
Probability Model
8.14.4 Survey Implementation Model
8.14.5 Other Models
This regional model report is organized as described in Sections 8.2.1 through 8.4.1. Refer to these sections of the report for explanations of the tables, variables, and statistics.
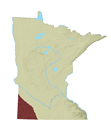
Inner Coteau and Coteau Moraines are subsections of the North Central Glaciated Plains Section of the Prairie Parkland Province (Figure 8.1) (Minnesota DNR, 1998). These two subsections were joined for modeling to provide a larger number of sites for analysis.
8.14.1.1 Coteau Moraines
Coteau Moraines is a subsection of the North Central Glaciated Plains section of the Prairie Parkland Province. The West Fork Des Moines River delineates the southern third of the eastern boundary, starting at the Iowa border. An interface between a till plain to the east and the Coteau to the west is the basis for the northern two-thirds of the eastern boundary. The southwest boundary is based approximately on the eastern margin of an end moraine and general stream and wetland patterns.
This subsection is dominated by a glacial landform that is higher than the surrounding landscape. The highest part is the Buffalo Ridge, an elevated area stretching from the Minnesota-South Dakota border in a southeasterly direction (Figure 8.14.1.a). Glacial till in this area is as thick as 800 feet (Figure 8.14.2.a). This subsection is characterized by two landforms: the middle Coteau (the western portion of the subsection) consists of rolling moraine ridges covered by one to three feet of loess and the outer Coteau (the eastern portion of the subsection) consists of a series of terminal and end moraines separated by ground moraines. There is a distinct escarpment along the northern half of the eastern border containing numerous drainages (Figure 8.14.1.a). Topography ranges from level to hilly. Soils are predominantly well drained, with small areas of poorly drained soils distributed throughout and alluvial soils following the stream drainages (Figure 8.14.2.b). The subsection has two drainage networks. In the western portion, the subsection drains southeast to the Des Moines River. In the east (the outer Coteau), streams flow to the Minnesota River.
Before modern settlement, the entire subsection was covered by prairie (Figure 8.14.1.b). River bottom forest was common along streams flowing northeastward out of the subsection, such as the Lac Qui Parle, Yellow Medicine, and Redwood Rivers. Wet prairies and marsh were scattered throughout much of the subsection, excluding the steeper northeast edge. Small patches of oak openings surrounded lakes in the central and south parts of the subsection.
8.14.1.2 Inner Coteau
Inner Coteau is a subsection of the North Central Glaciated Plains section of the Prairie Parkland Province. This subsection forms the southwestern corner of Minnesota. The northeast boundary is delineated by the eastern margin of an end moraine and general stream and wetland patterns.
This subsection represents the highest portion of the Coteau complex. The Inner Coteau consists of highly dissected moraines of glacial drift capped by thick (6 to 15 feet) loess deposits. Bedrock is covered by up to 800 feet of till through most of the subsection, although there is some local bedrock exposure, including the Pipestone National Monument. Loamy, well drained soils are common across the subsection. Almost the entire subsection drains southwest to the Missouri River. There are few lakes.
Before modern settlement, this area was covered by prairie. Wet prairies and marsh were found in the central and northern areas, often along streams. River bottom forest grew along the Rock River from Champepadan Creek southward. Some small patches of oak openings were found southwest of Lake Benton in the north part of the subsection.
8.14.2.1. Description
The Coteau Moraines and Inner Coteau subsections were combined for modeling to increase the number of known archaeological sites in the database. Coteau Moraines contained 220 sites, excluding single artifacts, that could be used for modeling. Inner Coteau contained only 130. Combined this provided about an average number of sites compared to the other modeled regions.
The site model for Inner Coteau and Coteau Moraines subsections is made up of 10 variables, two topographic, seven hydrologic, and one vegetative (Table 8.14.1).
8.14.2.1.1 Coteau Moraines
Zones of high and medium site potential (Figure 8.14.3) correspond primarily to water features in the Coteau Moraines. Elevated topography in the vicinity of water features also plays a role in determining high and medium site potential.
In general there are three major regions within this subsection that contain concentrated areas of high and medium site potential. From the northwest, the first zone extends southeastward through the center of the subsection as far as Lake Shetek in north central Murray County. Zones of high and medium potential also extend northeastward along river and stream courses in Yellow Medicine, Lincoln, and Lyon Counties. The extent of this zone appears to be influenced by the variables distance to nearest perennial river or stream, height above surroundings (Figure 8.14.4.a), and to a lesser degree, surface roughness (Figure 8.14.5a) and distance to nearest lake, wetland, organic soil, or stream.
In the southeast, the second zone of high and medium site potential follows the Des Moines River and nearby creeks and lakes through northern Jackson and southern Cottonwood Counties. The extent of high site potential in this area appears to be influenced by the same variables cited above for the first area discussed.. However, the influence of distance to nearest lake, wetland, organic soil, or stream is more apparent here than in the first zone.
Along the Iowa-Minnesota border a third zone contains areas of high and medium site potential around numerous small lakes. The variables distance to nearest lake, wetland, organic soil, or stream, distance to nearest perennial river or stream and height above surroundings (Figure 8.14.4.a) influence the distribution of higher site potential in this part of the subsection.
Smaller areas of higher site potential are scattered across much of this subsection, often along streams or around lakes. Along the northeast boundary, a number ridges above stream courses are high site potential, while the stream valleys themselves are assigned low potential. These appear to be closely related to the variable height above surroundings (Figure 8.14.4.a).
8.14.2.1.2 Inner Coteau
Zones of high and medium site potential follow stream courses throughout the Inner Coteau subsection. Their extents are strongly influenced by the variable height above surroundings (Figure 8.14.4.a). To a lesser degree, the distribution of high site potential is affected by the variables distance to nearest perennial river or stream and distance to nearest lake, wetland, organic soil, or stream. In the few places lakes are found, the variable distance to nearest large lake also affects the extent of higher site potential.
The largest contiguous zone of high and medium potential occurs follows the Rock River and two tributaries, Champepadan Creek and Elk Creek in the eastern half of Rock County. The shape of this zone reflects the pattern of the variable vegetation diversity within 1 km (Figure 8.14.6a). Smaller areas of higher site potential follow the upper courses of these and other streams.
8.14.2.2. Evaluation
The model performed well. It is based on 10 variables representing topography, vegetation, soils and hydrology (Table 8.14.1).
Table 8.14.1. Site Probability Model, Inner Coteau and Coteau Moraines Subsections
Intercept |
3.345 |
|
ln (nonsites/sites) |
1.535945136 |
|
Variable |
Regression Coefficient |
Probability |
Distance to edge of nearest large lake |
-0.0153292 |
100.0 |
Distance to edge of nearest perennial river or stream |
-0.0171406 |
100.0 |
Distance to nearest intermittent stream |
0.0367724 |
100.0 |
Distance to nearest lake inlet/outlet |
-0.0222129 |
100.0 |
Distance to nearest lake, wetland, organic soil, or stream |
-0.0916691 |
100.0 |
Distance to nearest permanent lake inlet/outlet |
0.0143835 |
100.0 |
Height above surroundings |
0.0898988 |
100.0 |
Surface roughness |
-0.0201258 |
56.3 |
Vegetation diversity within 1 km |
0.376964 |
53 |
Vertical distance to water |
0.0228874 |
100.0 |
In this model, 86.00% of all known sites are in high/medium probability areas, which make up only 34.76% of landscape (Table 8.14.2). This produces a respectable gain statistic of 0.59577 (Table 8.6.11). The model tested less well. Only 70.73 percent of the test sites were predicted, producing a gain statistic of 0.58815.
Table 8.14.2. Evaluation of Site Probability Model, Inner Coteau and Coteau Moraines Subsections
Region |
Random Points |
Negative Survey Points |
Modeled Sites |
Test Sites |
||||||
# |
% |
# |
% |
# |
% |
# |
% |
# |
% |
|
Low |
7965346 |
64.57% |
1127 |
69.31% |
313 |
51.06% |
46 |
13.14% |
12 |
29.27 |
Medium |
2450861 |
19.87% |
283 |
17.40% |
134 |
21.86% |
63 |
18.00% |
3 |
7.32 |
High |
1837807 |
14.90% |
210 |
12.92% |
165 |
26.92% |
238 |
68.00% |
26 |
63.41 |
Water |
82125 |
0.67% |
6 |
0.37% |
1 |
0.16% |
3 |
0.86% |
0 |
0 |
Steep Slopes |
499 |
0.00% |
0 |
0 |
0 |
0 |
0 |
0 |
0 |
0 |
Mines |
0 |
0 |
0 |
0 |
0 |
0 |
0 |
0 |
0 |
0 |
Total |
12336638 |
100% |
1626 |
100% |
613 |
100% |
350 |
100% |
41 |
100 |
The database included 350 sites that were not single artifacts. Two models run previously using different halves of the known sites had only 73% agreement (73% of the cells in the subsection were classified the same in both models). The Kappa statistic for these models was 0.49626 (Table 8.6.11). This suggests that confidence in the models developed from these combined subsections is limited. Increasing the number of sites for modeling may increase the stability and performance of the model. Conditional Kappa values were lowest for the medium site potential zone (Table 8.14.3).
Table 8.14.3. Conditional Kappa Values for Site Probability Model, Inner Coteau and Coteau Moraines Subsections
Class |
Ki |
Proportion Correct |
Low |
0.6769 |
0.8869 |
Medium |
0.1723 |
0.2965 |
High |
0.6034 |
0.6827 |
When the combined site probability model is evaluated for the Coteau Moraines subsection alone, 91.82% of all sites, excluding single artifacts, are in the high and medium probability areas, which constitute 40.20% of landscape (Table 8.14.4). This produces a respectable overall gain statistic of 0.56219 (Table 8.6.11).
The percent agreement of the preliminary models within the Coteau Moraines subsection was 69%. This is a lower level of agreement than was achieved for models built using only the data from Coteau Moraines (71%). The Kappa statistic for the preliminary combined models within this subsection was 0.47796, as compared to 0.37742 for preliminary subsection models . This indicates that model stability is degraded within Coteau Moraines by including data from Inner Coteau in the model. This degradation is an example of the effect of including sites in different environments to a model that already has a critical number of sites for modeling. In this case, these sites provide more noise than useful information. The conditional Kappa statistics (Table 8.14.5) are lowest for the medium site potential zone, but this is only 22 percent of the subsection area. Increasing the number of sites in the Inner Coteau would be necessary to allow the subsections to be modeled separately.
Table 8.14.4. Evaluation of Coteau Moraines Portion of Site Probability Model, Inner Coteau and Coteau Moraines Subsections
Region (30 meter cells) |
Random Points |
Negative Survey Points |
Modeled Sites |
|||||
# |
% |
# |
% |
# |
% |
# |
% |
|
Low |
4737939 |
58.79 |
493 |
60.86 |
158 |
49.84 |
15 |
6.82 |
Medium |
1774251 |
22.02 |
172 |
21.23 |
63 |
19.87 |
32 |
14.55 |
High |
1464854 |
18.18 |
139 |
17.16 |
95 |
29.97 |
170 |
77.27 |
Water |
81458 |
1.01 |
6 |
0.74 |
1 |
0.32 |
3 |
1.36 |
Steep Slopes |
225 |
0 |
0 |
0 |
0 |
0 |
0 |
0 |
Mines |
0 |
0 |
0 |
0 |
0 |
0 |
0 |
0 |
Total |
8058727 |
100 |
810 |
100 |
317 |
100 |
220 |
100 |
Table 8.14.5. Conditional Kappa Values for the Coteau Moraines Portion of Site Probability Model, Inner Coteau and Coteau Moraines Subsections
Class |
Ki |
Proportion Correct |
Low |
0.6569 |
0.8591 |
Medium |
0.1531 |
0.2938 |
High |
0.5820 |
0.6842 |
8.14.2.2.2 Inner Coteau
When the combined site probability model is applied to the Inner Coteau subsection, 76.16% of all sites, excluding single artifacts, are in the high and medium probability areas, which constitute 24.53% of landscape (Table 8.14.6). This produces a good overall gain statistic of 0.67792 (Table 8.6.11).
The percent agreement of the preliminary models within Inner Coteau subsection was 79%. this is significantly higher than was achieved for the individual subsection preliminary models (65%). The Kappa statistic for the combined model applied to this subsection was 0.50361 (Table 8.6.11), compared to 0.30088 for the individual subsection preliminary models. The conditional Kappa statistics (Table 8.14.7) are lowest for the medium site potential zone, but this is less than 16 percent of the subsection area. Clearly, the stability of the model for Inner Coteau is substantially improved by the infusion of data from Coteau Moraines. This illustrates the importance of site numbers. The 130 sites in Inner Coteau appear to provide insufficient information to develop stable models. Including data from Coteau Moraines, even though the environments are somewhat different, provides information needed to boost model stability. Ideally, the number of sites in this subsection should be at least doubled to support a separate model. As seen in the Coteau Moraines evaluation (Section 8.14.2.2.1), the effects of site numbers and environmental homogeneity are in a delicate balance.
Table 8.14.6. Evaluation of Inner Coteau Portion of Site Probability Model, Inner Coteau and Coteau Moraines Subsections.
Region (30 meter cells) |
Random Points |
Negative Survey Points |
Modeled Sites |
|||||
# |
% |
# |
% |
# |
% |
# |
% |
|
Low |
3237803 |
75.44 |
634 |
77.7 |
155 |
52.36 |
31 |
23.85 |
Medium |
678640 |
15.81 |
111 |
13.6 |
71 |
23.99 |
31 |
23.85 |
High |
374185 |
8.72 |
71 |
8.7 |
70 |
23.65 |
68 |
52.31 |
Water |
914 |
0.02 |
0 |
0 |
0 |
0 |
0 |
0 |
Steep Slopes |
275 |
0.01 |
0 |
0 |
0 |
0 |
0 |
0 |
Mines |
0 |
0 |
0 |
0 |
0 |
0 |
0 |
0 |
Total |
4291817 |
100 |
816 |
100 |
296 |
100 |
130 |
100 |
Table 8.14.7. Conditional Kappa Values for the Inner Coteau Portion of Site Probability Model, Inner Coteau and Coteau Moraines Subsections
Class |
Ki |
Proportion Correct |
Low |
0.6852 |
0.9255 |
Medium |
0.2079 |
0.3029 |
High |
0.6337 |
0.6765 |
8.14.2.3 Interpretation
The site model for Inner Coteau and Coteau Moraines subsections is made up of 10 variables, two topographic, seven hydrologic, and one vegetative (Table 8.14.8).
8.14.2.3.1 Differences between Modeled Sites and Random Points for Individual Model Variables
Modeled sites correlate with five variables in this model with coefficients in excess of 0.3. This is a rather high number of variables compared to other subsection models. These relationships can be illustrated by examining the mean differences between modeled sites and random points (Table 8.14.8). Modeled sites are on average eight feet higher above their surroundings than are random points (Figure 8.14.9b) and are closer to lake inlet/outlets (Figure 8.14.10d) and permanent lake inlet/outlet (Figure 8.14.11b). In the Inner Coteau and Coteau Moraines, the majority of lakes are small and on floodplains adjacent to streams.
Modeled sites are also about 12 feet higher above water than random points (Figure 8.14.12a) and are in areas of greater vegetation diversity (Figure 8.14.12c). While higher diversity values tend to follow streams, the highest values are often associated with lake inlet/outlets. Although the correlations are somewhat weaker, sites are closer to the nearest lake, wetland, organic soil, or stream (Figure 8.14.11a) and to perennial rivers and streams (Figure 8.14.10b) and somewhat closer to large lakes (Figure 8.14.10a), Sites are slightly farther from intermittent streams than random points (Figure 8.14.10c) and are on somewhat less rugged terrain (Figure 8.14.9c).
The Mann-Whitney U tests indicate that all site probability model variables are significant at the 0.05 level (Table 8.14.8). This means that the distribution of modeled sites versus random points is different enough to conclude that they are drawn from separate populations. In other words, this site probability model is able to isolate variables that discriminate between modeled site locations and random points.
Table 8.14.8. Model Variable Statistics
Coteau Moraines - Inner Coteau |
Modeled Sites |
Surveyed Areas |
Modeled Sites |
Sites in Low Prob. |
Neg. Survey Points |
Random Points |
||||||
Model Variable |
Coeff. |
Sign. |
Coeff. |
Sign. |
Mean |
S.D. |
Mean |
S.D. |
Mean |
S.D. |
Mean |
S.D. |
Distance to nearest major ridge or divide |
- |
- |
-0.277 |
0 |
188.46 |
63.79 |
217.27 |
48.75 |
205.69 |
61.46 |
210.07 |
55.46 |
Height above surroundings |
0.585 |
0 |
0.361 |
0 |
14.03 |
12.37 |
6.13 |
4.91 |
6.45 |
6.83 |
5.94 |
6.17 |
Surface roughness |
-0.072 |
0 |
- |
- |
244.46 |
24.2 |
256.87 |
24.97 |
249.83 |
21.74 |
248.35 |
23.44 |
Size of major watershed |
- |
- |
-0.065 |
0.636 |
1386.55 |
297.46 |
1382.35 |
276.05 |
1397.78 |
273.91 |
1381.13 |
318.35 |
Distance to edge of nearest large lake |
-0.293 |
0 |
-0.327 |
0 |
96.86 |
68.23 |
138.17 |
61.14 |
112.64 |
62.67 |
121 |
62.31 |
Distance to edge of nearest perennial river or stream |
-0.244 |
0 |
- |
- |
34.84 |
25.02 |
47.13 |
28.51 |
46.05 |
28.55 |
47.56 |
20.59 |
Distance to nearest intermittent stream |
0.228 |
0 |
0.252 |
0 |
21.94 |
10.44 |
18.33 |
9.79 |
20.64 |
10.92 |
19.25 |
10.32 |
Distance to nearest lake inlet/outlet |
-0.387 |
0 |
-0.558 |
0 |
45.45 |
20.84 |
63.44 |
17.12 |
50.36 |
19.33 |
58.54 |
19.01 |
Distance to nearest lake, wetland, organic soil, or stream |
-0.235 |
0 |
-0.316 |
0 |
9.4 |
5.91 |
13.01 |
6.98 |
10.79 |
7.66 |
12.68 |
7.99 |
Distance to nearest permanent lake inlet/outlet |
-0.303 |
0 |
-0.293 |
0.004 |
132.03 |
63.57 |
171.25 |
51.17 |
149.06 |
58.92 |
151.84 |
61.77 |
Size of nearest lake |
- |
- |
0.088 |
0.18 |
15.9 |
29.72 |
5.98 |
15.62 |
8.48 |
23.78 |
7 |
15.98 |
Size of nearest permanent lake |
- |
- |
0.389 |
0 |
760 |
1029.46 |
427.95 |
788.57 |
762.09 |
1242.91 |
447.47 |
700.13 |
Vertical distance to water |
0.424 |
0 |
0.218 |
0.001 |
24.04 |
25.2 |
12.33 |
15.47 |
12.08 |
16.87 |
12.16 |
13.89 |
Distance to oak woodland |
- |
- |
-0.208 |
0.435 |
129.28 |
60.17 |
146.39 |
64.5 |
142.79 |
56.79 |
141.62 |
57.21 |
Vegetation diversity within 1 km |
0.428 |
0 |
0.558 |
0 |
1.81 |
0.75 |
1.3 |
0.51 |
1.54 |
0.63 |
1.36 |
0.55 |
Frequency counts |
350 |
1002 |
350 |
46 |
613 |
1626 |
||||||
See Interpretation section for discussion of the statistics:
Coeff. = correlation coefficient
Sign. = significance of the Mann-Whitney U test
S.D. = standard deviation
Distances and areas are expressed in square
roots of meters. Square the values in the table to get actual values.
8.14.2.3.2Relationships between Variable Pairs
The correlation matrix indicates little data redundancy in the variables used for constructing the site model (Table 8.14.9). There are only three relationships with correlations of 0.5 or greater. Distance to nearest large lake and distance to nearest permanent lake inlet/outlet are closely related (0.87). Height above surroundings and vertical distance to water are also quite similar (0.66), as would be expected. There is an inverse relationship (-0.5) between distance to nearest large lake and vegetation diversity within one kilometer. This indicates that vegetation diversity is greater around large lakes than further away. The prominence of variables expressing proximity to lakes and variables associated with lake proximity is an interesting component of this model for a region where stream networks are so prominent.
Table 8.14.9. Variable Correlation Matrix
Coteau Moraines - Inner Coteau |
Height above surroundings |
Surface roughness |
Distance to edge of nearest large lake |
Distance to edge of nearest perennial river or stream |
Distance to nearest intermittent stream |
Distance to nearest lake inlet/outlet |
Distance to nearest lake, wetland, organic soil, or stream |
Height above surroundings |
1 |
||||||
Surface roughness |
0.25 |
1 |
|||||
Distance to edge of nearest large lake |
0.12 |
0.08 |
1 |
||||
Distance to edge of nearest perennial river or stream |
-0.09 |
0.13 |
-0.39 |
1 |
|||
Distance to nearest intermittent stream |
-0.15 |
0.08 |
-0.41 |
0.16 |
1 |
||
Distance to nearest lake inlet/outlet |
0.07 |
0.09 |
0.24 |
0.06 |
-0.09 |
1 |
|
Distance to nearest lake, wetland, organic soil, or stream |
0.08 |
0.07 |
0.18 |
0.23 |
0.13 |
0.14 |
1 |
Distance to nearest permanent lake inlet/outlet |
0.03 |
0.26 |
0.87 |
-0.17 |
-0.3 |
0.19 |
0.2 |
Vertical distance to water |
0.66 |
0.16 |
0.18 |
-0.03 |
-0.01 |
0.11 |
0.5 |
Vegetation diversity within 1 km |
-0.09 |
-0.07 |
-0.5 |
0.16 |
0.42 |
-0.44 |
-0.07 |
Distance to nearest permanent lake inlet/outlet |
Vertical distance to water |
Vegetation diversity within 1 km |
|||||
Distance to nearest permanent lake inlet/outlet |
1 |
||||||
Vertical distance to water |
0.1 |
1 |
|||||
Vegetation diversity within 1 km |
-0.46 |
-0.06 |
1 |
Refer to "Relationships between variable pairs" for interpretation of the table values.
8.14.2.3.3Sites in Low Probability Areas
Table 8.14.8 indicates that the means of sites in low site potential zones are more similar to random points than to all modeled sites. In fact, there are seven variables where sites in low probability areas are more different from the modeled sites than are the random points. Compared to all modeled sites, sites in low potential areas tend to be less elevated above their surroundings and closer to water in the vertical dimension. Though one might expect lower ground to be close to water, sites in low probability areas are actually further from the nearest large lake, from the nearest lake, wetland, organic soil, or stream, from the nearest perennial river or stream, from the nearest lake inlet/outlet. Probably because they are farther from water, they are in areas of less vegetation diversity and greater surface roughness.
Of the 46 sites not predicted by the model, 15 are in Coteau Moraines and 31 are in Inner Coteau. Sites not predicted in Coteau Moraines include two burials, one earthwork, three artifact scatters, and nine lithic scatters. In Inner Coteau, two of the sites are earthworks, nine are artifact scatters, 19 are lithic scatters, and one is a rock alignment. If all site types were equally well predicted, 13.14 percent of each should be found in low probability areas. Artifact and lithic scatters approach this, with 12.63 percent of all artifact scatters and 14.58 percent of all lithic scatters in low site potential zones. However, mortuary/cemetery sites (22.22 percent) are overrepresented in low probability areas, while mounds and earthworks (7.5 percent) are underrepresented.
8.14.2.3.4 Relationships between Cultural Context, Descriptive, or Settlement Variables and Site Potential
Table 8.14.10 is a composite of five separate bivariate tables designed to assess the distribution of sites in the three zones of site potential. Sample sizes are large enough to permit the examination of five contextual variables. Only one relationship that is significant at the 0.05 level, Woodland versus not-Woodland. This table indicates that sites with Woodland components are overrepresented in the high and medium site potential areas and underrepresented in the low site potential zones. This implies that the model for this subsection is successful at predicting Woodland sites. Since the non-Woodland sample size is very low, their data may in effect have swamped the analysis, masking the characteristics of sites from other time periods.
Table 8.14.10. Summary of bivariate relationships between nine dichotomous archaeological variables and three areas of site potential, Coteau Moraines/Inner Coteau (Site Probability Model)
Low Potential |
Medium Potential |
High Potential |
Total |
Chi-square Test |
|||||||
Dichotomous Variable |
N |
% |
N |
% |
N |
% |
N |
% |
value |
Df |
p-value |
All Modeled Sites |
31 |
23.8 |
31 |
23.8 |
68 |
52.3 |
130 |
99.9 |
- |
- |
- |
Archaic |
1 |
5.9 |
1 |
5.9 |
15 |
88.2 |
17 |
100.0 |
1.99 |
2 |
0.37 |
Not Archaic |
6 |
7.3 |
16 |
19.5 |
60 |
73.2 |
82 |
100.0 |
|||
Plains Village |
2 |
10.5 |
4 |
21.1 |
13 |
68.4 |
19 |
100.0 |
0.77 |
2 |
0.68 |
Not Plains Village |
5 |
6.3 |
13 |
16.3 |
62 |
77.5 |
80 |
100.0 |
|||
Woodland |
3 |
3.4 |
16 |
18.4 |
68 |
78.2 |
87 |
100.0 |
14.49 |
2 |
0.00 |
Not Woodland |
4 |
33.3 |
1 |
8.3 |
7 |
58.3 |
12 |
100.0 |
|||
Aceramic |
1 |
5.6 |
1 |
5.6 |
16 |
88.9 |
18 |
100.0 |
2.30 |
2 |
0.32 |
Not Aceramic |
6 |
7.4 |
16 |
19.8 |
59 |
72.8 |
81 |
100.0 |
|||
Single Component |
4 |
5.6 |
12 |
16.9 |
55 |
77.5 |
71 |
100.0 |
0.84 |
2 |
0.66 |
Not Single Component |
3 |
10.7 |
5 |
17.9 |
20 |
71.4 |
28 |
100.0 |
|||
8.14.3 Survey Probability Model
8.14.3.1. Description
The Coteau Moraines and Inner Coteau subsections were combined for modeling to increase the number of surveyed places in the database. Coteau Moraines contained 242 sites and 343 negative survey points. Inner Coteau contained 147 sites and 296 negative survey points. Combined this provided somewhat less than an average number of surveyed places compared to the other modeled regions.
8.14.3.1.1. Coteau Moraines
Zones of high survey potential reflect the patterns of the site probability model in the Coteau Moraines portion of the subsection (Figure 8.14.7). However, the areas of high and medium survey potential are much more extensive than the zones of high and medium site potential, though apparently reflecting the same hydrographic and topographic features.
There is a particularly large concentration of surveys near the common borders of Lincoln, Lyon, Pipestone and Murray counties. Almost 300 sites and negative survey points are located within 500 sq. km between Lakes Benton and Shetek. This cluster constitutes 54% of all surveyed places in only 7% of the subsection's area. The frequency of survey points within that area exceeds by eight times that of the entire subsection (0.6 vs. 0.077 surveys per 1 sq. km). Many of the surveyed points are along Highways 14 and 59. These linear surveys have provided comprehensive information for parts of this area that extend away from streams.
Elsewhere, narrow and intermittent high and medium survey potential zones closely follow streams, reflecting a more biased pattern of survey. This can be seen, for example, at the southeast along Plum, Pell and Dutch Charley Creeks, or in parts of Lyon county along Yellow Medicine and Three Mile Creeks. Lakes Heron, Flaherty in Jackson County, and Shaokatan and Stay in Lincoln County serve as focal points for islands of higher potential zones in the peripheral parts of the subsection, where surveys are scarce.
8.14.3.1.2. Inner Coteau
High and medium survey potential zones are concentrated along the major streams of the Inner Coteau subsection. One prominent zone extends through the middle of the subsection for 70 km along the Rock River and up its eastern tributaries. At the western subsection border, upstream reaches of the Lower Big Sioux River tributaries form several smaller zones. Areas adjacent to watershed divides are generally classified as low potential zones.
Zones of high survey potential are similar in pattern to, but about 1-3 km wider than, corresponding zones of high site potential. Archaeologists’ preference to survey along rivers is quite apparent in this subsection. Surveyed places are almost exclusively located at river banks or, at most, within 200-300 meters of the nearest stream. The Rock River and its tributaries have seen the most surveys. Only one relatively short linear survey is recorded, along Interstate 90 in the eastern part of Nobles County.
The survey probability model (Figure 8.14.7) performed only somewhat better than by chance alone, suggesting that there is a random component in survey locations within the combined subsections. The model is based on 13 variables, representing topography, vegetation, soils and hydrology (Table 8.14.11). The model predicts 84.03% of all surveyed places in high/medium probability areas, which make up 54.62% of the landscape (Table 8.14.12). This produces a very weak gain statistic of 0.34994 (Table 8.6.11), a desirable outcome for a survey probability model.
This model was able to predict surveyed places with much less precision than the site probability model was able to predict sites, indicating that sites are confined to only a portion of the total area surveyed. However, the model predicted surveyed places better than by chance, indicating that surveys in the region have not been truly random. Low numbers of both sites (389) and negative survey points (613) in the large area of this region underscore the need for more survey. Survey frequency in this region (0.090 survey points per square km) is below average, while the frequency of known sites (0.035 known sites per square km) is about average.
The database included 1002 surveyed places. Two models run previously using different halves of the surveyed places had only 75% agreement (75% of the cells in the combined region were classified the same in both models). The Kappa statistic for this model was 0.58797 (Table 8.6.14). This is about average within the state, but should be improved. The conditional Kappa statistics (Table 8.14.13) are lowest for the medium site potential zone, but this is less than 20 percent of combined subsections' area. It is assumed that additional surveys in the areas classified as low survey potential will improve confidence in the model.
Table 8.14.11. Survey Probability Model, Inner Coteau and Coteau Moraines Subsections
Intercept |
-2.293 |
|
ln(non-surveys/surveys) |
0.484125008 |
|
Variable |
Regression Coefficient |
Probability |
Distance to edge of nearest large lake |
-0.0137435 |
100.0 |
Distance to nearest intermittent stream |
0.0341957 |
100.0 |
Distance to nearest lake inlet/outlet |
-0.0184581 |
100.0 |
Distance to nearest lake, wetland, organic soil, or stream |
-0.0634713 |
100.0 |
Distance to nearest major ridge or divide |
-0.00514941 |
85.2 |
Distance to nearest permanent lake inlet/outlet |
0.00956873 |
100.0 |
Distance to oak woodland |
0.0132673 |
100.0 |
Height above surroundings |
0.0494137 |
100.0 |
Size of major watershed |
0.000792866 |
92.6 |
Size of nearest lake |
-0.00831575 |
56.1 |
Size of nearest permanent lake |
0.000366204 |
100.0 |
Vegetation diversity within 1 km |
0.312977 |
81.9 |
Vertical distance to water |
0.00965301 |
44.6 |
Table 8.14.12. Evaluation of Survey Probability Model, Inner Coteau and Coteau Moraines Subsections
Region (30 meter cells) |
All random points |
All negative survey points |
All sites |
All sites and negative survey points |
||||||
# |
% |
# |
% |
# |
% |
# |
% |
# |
% |
|
Low |
5515179 |
44.71% |
752 |
46.25% |
127 |
20.72% |
29 |
7.46% |
156 |
15.57% |
Medium |
2451280 |
19.87% |
340 |
20.91% |
115 |
18.76% |
42 |
10.80% |
157 |
15.67% |
High |
4287555 |
34.75% |
528 |
32.47% |
370 |
60.36% |
315 |
80.98% |
685 |
68.36% |
Water |
82125 |
0.67% |
6 |
0.37% |
1 |
0.16% |
3 |
0.77% |
4 |
0.40% |
Steep Slopes |
499 |
0.004% |
0 |
0 |
0 |
0 |
0 |
0 |
0 |
0 |
Mines |
0 |
0 |
0 |
0 |
0 |
0 |
0 |
0 |
0 |
0 |
Total |
12336638 |
100% |
1626 |
100% |
613 |
100% |
389 |
100% |
1002 |
100% |
Table 8.14.13. Conditional Kappa Values for Survey Probability Model, Inner Coteau and Coteau Moraines Subsection
Class |
Ki |
Proportion Correct |
Low |
0.6829 |
0.8256 |
Medium |
0.1971 |
0.3176 |
High |
0.6977 |
0.8186 |
8.14.3.2.1. Coteau Moraines
When the survey probability model is applied to the Coteau Moraines subsection alone, 90.51% of all surveyed points are in the high and medium probability areas, which constitute 54.88% of landscape (Table 8.14.14). This produces a weak overall gain statistic of 0.39288 (Table 8.6.11). Compared to the survey probability model, developed for the Coteau Moraines individual subsection, this model predicts more surveyed places (90.51% vs. 86.59%) and has a larger area classified as high and medium probability (55.07% vs. 49.48%). As a result there is lower gain statistic (0.39288 vs. 0.42857). There are two ways to interpret this. First, that surveyed places in the Inner Coteau subsection are in environments similar to some in Coteau Moraines that are unlike places surveyed in Coteau Moraines itself. Alternatively, increasing the environmental diversity by combining the two subsections may muddle the model, with the additional data creating noise that makes identification of surveyed environments less precise.
The percent agreement of the preliminary models within the Coteau Moraines subsection was 76%. The Kappa statistic for these models was 0.60067, slightly better than average for the state. The conditional Kappa statistics (Table 8.14.15) are lowest for the medium site potential zone, but this is only 17 percent of the subsection area.
Table 8.14.14. Evaluation of the Coteau Moraines Portion of the Survey Probability Model, Inner Coteau and Coteau Moraines Subsections
Region |
All random points |
All negative survey points |
All sites |
All sites and negative survey points |
||||||||
# |
% |
# |
% |
# |
% |
# |
% |
# |
% |
|||
Low |
3548803 |
44.04 |
366 |
45.19 |
36 |
11.36 |
13 |
5.37 |
49 |
8.77 |
||
Medium |
1391988 |
17.27 |
138 |
17.04 |
50 |
15.77 |
18 |
7.44 |
68 |
12.16 |
||
High |
3036253 |
37.68 |
300 |
37.04 |
230 |
72.56 |
208 |
85.95 |
438 |
78.35 |
||
Water |
81458 |
1.01 |
6 |
0.74 |
1 |
0.32 |
3 |
1.24 |
4 |
0.72 |
||
Steep Slopes |
225 |
0.03 |
0 |
0 |
0 |
0 |
0 |
0 |
0 |
0 |
||
Mines |
0 |
0 |
0 |
0 |
0 |
0 |
0 |
0 |
0 |
0 |
||
Total |
8058727 |
100 |
810 |
100 |
317 |
100 |
242 |
100 |
559 |
100 |
||
Table 8.14.15. Conditional Kappa Values for the Coteau Moraines Portion of the Survey Probability Model, Inner Coteau and Coteau Moraines Subsections
Class |
KI |
Proportion Correct |
Low |
0.6668 |
0.8075 |
Medium |
0.1839 |
0.2951 |
High |
0.7381 |
0.8537 |
8.14.3.2.2 Inner Coteau Subsection
When the combined survey probability model is applied to the Inner Coteau subsection, 75.85% of all surveyed points are in the high and medium probability areas, which constitute 54.01% of landscape (Table 8.14.16). This produces a very weak overall gain statistic of 0.28794 (Table 8.6.14). This implies a random component to surveys. However, most survey points used for modeling came from the adjacent Coteau Moraines subsection. All environments classified as high or medium survey potential may not have been surveyed within Inner Coteau itself.
The percent agreement of the preliminary models within the Inner Coteau subsection was 73%. This is slightly lower than for the Coteau Moraines subsection. The Kappa statistics for these models was 0.56119 (Table 8.6.14). The conditional Kappa statistics (Table 8.14.17) are lowest for the medium site potential zone. There was no subsection model for surveyed places in Inner Coteau available for comparison with this combined model.
Table 8.14.16. Evaluation of the Inner Coteau Portion of the Survey Probability Model, Inner Coteau and Coteau Moraines Subsections
Region |
All random points |
All negative survey points |
All sites |
All sites and negative survey points |
||||||
# |
% |
# |
% |
# |
% |
# |
% |
# |
% |
|
Low |
1972467 |
45.96 |
386 |
47.3 |
91 |
30.74 |
16 |
10.88 |
107 |
24.15 |
Medium |
1061971 |
24.74 |
202 |
24.75 |
65 |
21.96 |
24 |
16.33 |
89 |
20.09 |
High |
1256190 |
29.27 |
228 |
27.94 |
140 |
47.3 |
107 |
72.79 |
247 |
55.76 |
Water |
914 |
0.02 |
0 |
0 |
0 |
0 |
0 |
0 |
0 |
0 |
Steep Slopes |
275 |
0.01 |
0 |
0 |
0 |
0 |
0 |
0 |
0 |
0 |
Mines |
0 |
0 |
0 |
0 |
0 |
0 |
0 |
0 |
0 |
0 |
Total |
4291817 |
100 |
816 |
100 |
296 |
100 |
147 |
100 |
443 |
100 |
Table 8.14.17. Conditional Kappa Values for the Inner Coteau Portion of the Survey Probability Model, Inner Coteau and Coteau Moraines Subsections
Class |
Ki |
Proportion Correct |
Low |
0.7156 |
0.8582 |
Medium |
0.2118 |
0.3504 |
High |
0.6221 |
0.7441 |
8.14.3.3 Interpretation
The survey model for this subsection is constructed from 13 variables, over half of them hydrologic in nature. Two variables each are related to topography and vegetation. Of these 13 variables, six have correlation coefficients greater than 0.3 (Table 8.14.8). Compared to random points, surveys have been conducted nearer to large permanent lakes (Figures 8.14.11d and 8.14.11c), lake inlet/outlets (Figure 8.14.10d), and lakes, wetlands, organic soil or streams (Figure 8.14.11a). These places are higher above their surroundings (Figure 8.14.9b) and have greater vegetation diversity (Figure 8.14.12c) than do random points. Although the correlation is less strong, archaeologists have tended to survey somewhat closer to major ridges (Figure 8.14.9a) than would be expected by chance alone. Although the variable distance to oak woodland (Figure 8.14.12b) appears in this model, its univariate correlation is not significant and its mean value at surveyed places is close to the value at random points. Modeled sites, on the other hand, are considerably closer to oak woodland. The significance of this relationship was not measured because the variable did not appear in the site probability model.
Surveyed places are more similar to random points than to modeled sites for all but two variables, size of major watershed (Figure 8.14.9d) and size of nearest permanent lake (Figure 8.14.11d). This contributes to confidence in the model by reinforcing other indicators of randomness, such as the gain statistic (Section 8.14.3.2).
The results of the Mann-Whitney U tests indicate that all variables except two (size of major watershed, distance to oak woodland) are significant at the 0.05 level. This indicates that the survey and random points are drawn from different populations. In other words, the surveys in this subsection are not truly random in relation to most of the variables included in the model. However, the gain statistic and comparison of variable means suggest that there has been less survey bias here than in other parts of the state.
8.14.4 Survey Implementation Model
The survey implementation model for the Inner Coteau and Coteau Moraines subsections indicates that 41.17 percent of the land area is categorized as unknown because of inadequate survey (Figure 8.14.8 and Table 8.14.18). These areas are found throughout the subsection away from water bodies. Seven (17.07 percent) of the test sites were from the unknown area.
High areas adjacent to streams draining towards the northern boundary of the Coteau Moraines subsection are marked by zones of suspected high and possibly high site probability. This indicates that, even though similar environments have not been well surveyed, they are quite similar to other areas where sites have been found. Low and possibly low probability areas occupy 23.4 percent of the landscape. These are typically found on higher ground away from water or in the upper reaches of stream networks.
Table 8.14.18. Evaluation of Survey Implementation Model, Inner Coteau and Coteau Moraines Subsections
Region |
Random Points |
Negative Survey Points |
Single Artifacts |
Sites |
||||||
# |
% |
# |
% |
# |
% |
# |
% |
# |
% |
|
Unknown |
5079090 |
41.17 |
719 |
44.22 |
119 |
19.41 |
4 |
10.26 |
23 |
6.57 |
Possibly Low |
1774982 |
14.39 |
264 |
16.24 |
87 |
14.19 |
3 |
7.69 |
18 |
5.14 |
Low |
1111274 |
9.01 |
144 |
8.86 |
107 |
17.46 |
1 |
2.56 |
5 |
1.43 |
Suspected Medium |
384259 |
3.11 |
30 |
1.85 |
7 |
1.14 |
0 |
0 |
1 |
0.29 |
Possibly Medium |
566076 |
4.59 |
67 |
4.12 |
23 |
3.75 |
0 |
0 |
15 |
4.29 |
Medium |
1500526 |
12.16 |
186 |
11.44 |
104 |
16.97 |
11 |
28.21 |
47 |
13.43 |
Suspected High |
51830 |
0.42 |
3 |
0.18 |
1 |
0.16 |
0 |
0 |
1 |
0.29 |
Possibly High |
110222 |
0.89 |
9 |
0.55 |
5 |
0.82 |
0 |
0 |
6 |
1.71 |
High |
1675755 |
13.58 |
198 |
12.18 |
159 |
25.94 |
20 |
51.28 |
231 |
66 |
Water |
82125 |
0.67 |
6 |
0.37 |
1 |
0.16 |
0 |
0 |
3 |
0.86 |
Steep Slopes |
499 |
0 |
0 |
0 |
0 |
0 |
0 |
0 |
0 |
0 |
Mines |
0 |
0 |
0 |
0 |
0 |
0 |
0 |
0 |
0 |
0 |
Total |
12336638 |
100 |
1626 |
100 |
613 |
100 |
39 |
100 |
350 |
100 |
River valley floors and terraces and lake margins in the Inner Coteau and Coteau Moraines subsections have the potential to contain deeply buried archaeological sites. Mn/Model landscape suitability models were created for the Rock River Valley (Section 12.8) in the Inner Coteau subsection and for the area around Lake Benton (Section 12.14), covering the Lake Benton and Tyler quadrangles, which occupies parts of both subsections. These models should be consulted for information regarding the geomorphic potential for both surface and subsurface archaeological sites.
8.15 Glacial Lake Superior Plain/Northshore Highlands/ Nashwauk
Uplands
8.16 Hardwood Hills
8.17 Laurentian Highlands
8.18 Littlefork-Vermilion Uplands
8.19 Mille Lacs Uplands
8.20 Minnesota River Prairie
8.21 Oak Savanna
8.22 Pine Moraines & Outwash Plains
8.23 Red River Prairie
8.24 Rochester Plateau
8.25 St. Croix Moraines and Outwash Plains (Twin Cities Highlands)
8.26 St. Louis Moraines/ Tamarack Lowlands
8.27 Conclusion
References
The Mn/Model Final Report (Phases 1-3) is available on CD-ROM. Copies may be requested by visiting the contact page.

Acknowledgements
MnModel was financed with Transportation Enhancement and State Planning and Research funds from the Federal Highway Administration and a Minnesota Department of Transportation match.
Copyright Notice
The MnModel process and the predictive models it produced are copyrighted by the Minnesota Department of Transportation (MnDOT), 2000. They may not be used without MnDOT's consent.