Quick Links
Chapters
- Management Summary
- Research Design & Time Line
- Environment & Native American Culture
- GIS Design
- Archaeological Database
- Archaeological & Environmental Variables
- Model Development & Evaluation
- Model Results & Interpretation
- Project Applications
- Model Enhancements
- Model Implementation
- Landscape Suitability Models
- Summary & Recommendations
Appendices
- Archaeological Predictive Modeling: An Overview
- GIS Standards & Procedures
- Archaeology Field Survey Standards, Procedures & Rationale
- Archaeology Field Survey Results
- Geomorphology Survey Profiles, Sections, & Lists
- Building a Macrophysical Climate Model for the State of Minnesota
- Correspondence of Support for Mn/Model
- Glossary
- List of Figures
- List of Tables
- Acknowledgments
8.26 ST. LOUIS MORAINES/TAMARACK LOWLANDS SUBSECTIONS OF NORTH MINNESOTA DRIFT & LAKE PLAINS SECTION
8.26.1 Environmental Context
8.26.2 Site Probability Model
8.26.3 Survey
Probability Model
8.26.4 Survey Implementation Model
8.26.5 Other Models
This regional model report is organized as described in Sections 8.2.1 through 8.4.1. Refer to these sections of the report for explanations of the tables, variables, and statistics.
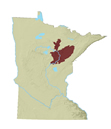
St. Louis Moraines and Tamarack Lowlands are subsections of the North Minnesota Drift and Lake Plains Section of the Laurentian Mixed Forest Province (Figure 8.1) (Minnesota DNR 1998). These two subsections were combined for modeling to provide a larger number of sites for analysis.
8.26.1.1 Saint Louis Moraines
Saint Louis Moraines is characterized by moraines left by the Saint Louis and Koochiching Sublobes (Figure 8.26.2.a). The northeastern quarter of the subsection, in Itasca County, also contains a large deposit of outwash.
The northern boundary is based on the southern extent of Glacial Lake Agassiz. The northern half of the western boundary is the interface between the end moraine of the Des Moines Lobe on the east side of the subsection boundary and Des Moines Lobe ground moraines and outwash deposits on the west. The south half of the west boundary is based on the interface between the end and ground moraines of the Rainy Lobe and the western limits of the ice contact sediments of the Des Moines Lobe. The southern portion of the eastern boundary follows the interface between the end and ground moraines of the St. Louis Sublobe to the west and peat deposits to the east. The northwest boundary is based on the interface between the end moraine to the east and the ground moraines or outwash deposits of the Des Moines Lobe as interpreted by Hobbs and Goebel (1982).
The topography varies from rolling to steep throughout the subsection. Many lakes are interspersed throughout the hills (Figure 8.26.1.a). The Mississippi River is a major river system in the southern part of the region and provides drainage to the south, while the Big Fork River, in the northern part of the subsection, drains to the north. Soils are mostly well-drained (Figure 8.26.2.b).
Aspen-birch forest, with a conifer component, was the prevalent historic vegetation (Figure 8.26.1.b) in the north and south central portions of this subsection. White and red pine covered much of the north central portion, as well as the extreme east and west central parts. Stands of Big Woods were present in the central and east central portion of the subsection. Mixed pine and hardwoods were found on moraines, typically near lakes and were predominant in the southern tip of the subsection. Conifer bogs were scattered throughout the subsection, though they were less prominent than in the subsections to the east and west.
8.26.1.2 Tamarack Lowlands
The borders of the Tamarack Lowlands coincide with the landform boundaries of Glacial Lake Upham and the Aurora Till Plain (NOT, 1998). The south edge of the Nashwauk Moraine forms the central portion of the western boundary (Figure 8.26.2.a). The southern portion of the western boundary corresponds to the interface between end and ground moraines of the St. Louis sublobe on the west, and peat areas of the Aitkin Lacustrine Plain on the east. The southern border of the Rainy Lobe sediments, including iron ore deposits (now mines), forms the northern boundary. The northern half of the eastern border is based on the interface between the St. Croix ground moraine on the east and the St. Louis Sublobe ground and end moraines on the west. The western portion of the southern border is defined by the Aitkin Lacustrine Plain to the north and the Swatara plain to the south (Dan Hanson, personal communication 1997).
The land is level to gently rolling. Peat soils (Figure 8.26.2.b) are deposited over much of the subsection, with glacial lacustrine sediments underlying these deposits. The Toimi drumlin field (Wright 1974) occupies the northeastern portion of the subsection. Despite the level topography of this subsection, a continental divide sends two major rivers in separate directions. The Mississippi River flows south while the Saint Louis River flows east to Lake Superior. There are relatively few lakes in this subsection (Figure 8.26.1.a). The only large lake is Big Sandy, which is actually a reservoir on the Savanna River in northern Aitkin County. Along the northern edge of the subsection are several large iron ore mines.
In the 19th century conifer bogs dominated the Tamarack Lowlands (Figure 8.26.1.b). Some open muskeg was found in the center of the subsection. Aspen-birch forest (with a coniferous component) was located in narrow corridors on the uplands between the bogs. White and red pine were located in extensive regions along the northern border and to a lesser degree in the east and south central areas. Jack pine forest was recorded in the northeastern portion of the subsection. In the southwest, conifer bog was mixed with marshes and scattered hardwoods. Big Woods were found east of the Mississippi River in the northwest. River bottom forest was present along the Mississippi, lower Willow, upper Saint Louis, and Whiteface rivers.
8.26.2.1 Description
The St. Louis Moraines and Tamarack Lowlands subsections were combined for modeling to increase the number of known archaeological sites in the database. St. Louis Moraines contained 112 known sites, while Tamarack Lowlands contained 74. Combined, this provided only about half the average number of sites compared to the other modeled regions.
8.26.2.1.1 St. Louis Moraines
Zones of high site potential are located primarily along lakeshores in the St. Louis Moraines subsection from Pokegama Lake in the narrow central portion of the subsection to Turtle Lake in the northwest (Figure 8.26.3). An area of high site potential extends north from Pokegema Lake to Rice, Long, Loon, and Jay Gould lakes, and along the Mississippi River. A thin strip of medium and high potential in central Itasca County follows the Prairie River northward to Prairie and Shoal lakes. The higher elevation landscape between Shoal Lake and the Mississippi River corresponds to areas of low site potential.
Large areas of high and medium site potential occur around lakes in the northern half of the subsection, for example around Deer, Moose, Little Moose, Fawn, and Cottonwood lakes. The extent of high and medium site potential here is greater than around other lakes. A zone of high site potential is found in a narrower band around Trout, Bluewater, and Wabana lakes in central Itasca County. In the far north of the subsection, the area of high and medium site potential around Deer, Pickerel, and Battle lakes extends away from the lakeshores.
South and east of Pokegama Lake, in southeastern Itasca County, areas of high or medium site potential are very sparse. One notable cluster is at the southern tip of the subsection where areas of high site potential follow the Mississippi River, the lower Pine River, and a number of lakes north of those rivers in northwestern Crow Wing County. Contiguous zones of medium site potential connect the high site potential around Adney, Gaggle, and Perry lakes to the east and surround Island, Roger, and Upper Dean lakes.
8.26.2.1.2 Tamarack Lowlands
There is one large area of high and medium site potential in the Tamarack Lowlands subsection. It surrounds Aitkin, Big Sandy, Rat, Flowage, Round lakes, and Lake Minnewawa in the southern part of the subsection in northeastern Aitkin County. Areas of high and medium site potential in this subsection, though few and far between, correspond to lakeshores and stream courses. In the northeast portion of the subsection, in central St. Louis County, a small cluster of high and medium site potential is found south of the town of Biwabik around Embarrass, Cedar Island, and Esquagama lakes. Southeast of this area Bass Lake, Lost Lake, Loon Lake, and the adjacent stretch of the Saint Louis River contain limited zones of high and medium site potential. South of the town of Virginia, Ely, Saint Mary’s, and Pleasant lakes contain areas of medium site potential along the lake shorelines, a second tier of high site potential, and a final tier of medium site potential.
8.26.2.2 Evaluation
The site probability model performed extremely well. It is based on 11 variables (Table 8.26.1) representing topography, soils and hydrology.
Table 8.26.1. Site Probability Model, St. Louis Moraines and Tamarack Lowlands Subsections.
Intercept |
29.516 |
|
ln(nonsites/sites) |
2.802382386 |
|
Variable |
Regression Coefficient |
Probability |
Direction to edge of nearest water or wetland |
-0.4923678 |
84.6 |
Distance to edge of nearest large lake |
-0.05352755 |
100.0 |
Distance to edge of nearest swamp |
0.07222898 |
100.0 |
Distance to glacial lake sediment |
0.01311252 |
100.0 |
Distance to nearest lake, wetland, organic soil, or stream |
-0.1320485 |
100.0 |
Distance to permanent wetland inlets/outlets |
-0.01370855 |
97.8 |
Distance to pine barrens or flats |
-0.01599101 |
100.0 |
Distance to prairie |
0.01552093 |
88.2 |
Elevation |
-0.02720393 |
100.0 |
Height above surroundings |
0.05650641 |
100.0 |
Size of minor watershed |
0.0001357542 |
30.1 |
In this model, 87.64 percent of all known sites are in high/medium site potential areas, which make up only 9.76 percent of landscape (Table 8.26.2). This produces a very strong gain statistic of 0.88864 (Table 8.6.11). The model tested less well, predicting only 66.67 percent of test sites. The test gain statistic was 0.85361.
Table 8.26.2. Evaluation of Site Probability Model, St. Louis Moraines and Tamarack Lowlands Subsections.
Region (30 meter cells) |
Random Points |
Negative Survey Points |
Modeled Sites |
Test Sites |
||||||
# |
% |
# |
% |
# |
% |
# |
% |
# |
% |
|
Low |
10997285 |
87.81 |
2664 |
86.89 |
360 |
53.65 |
22 |
11.83 |
11 |
33.33 |
Medium |
610940 |
4.88 |
154 |
5.02 |
74 |
11.03 |
22 |
11.83 |
5 |
15.15 |
High |
610950 |
4.88 |
161 |
5.25 |
232 |
34.58 |
141 |
75.81 |
17 |
51.52 |
Water |
224189 |
1.79 |
69 |
2.25 |
3 |
0.45 |
1 |
0.54 |
0 |
0 |
Steep Slopes |
960 |
0.01 |
1 |
0.03 |
0 |
0 |
0 |
0 |
0 |
0 |
Mines |
80117 |
0.64 |
17 |
0.55 |
2 |
0.30 |
0 |
0 |
0 |
0 |
Total |
12524441 |
100 |
3066 |
100 |
671 |
100 |
186 |
100 |
33 |
100 |
The database included 186 sites that were not single artifacts (Table 8.26.2). Two preliminary models for this region, using different halves of the known sites, had 90.89 percent agreement. This is a very high level of agreement. However, the Kappa statistic, which is adjusted for the amount of agreement expected by chance alone, for the model was 0.50751, which is close to average for the state (Table 8.6.11). The conditional Kappa statistics (Table 8.26.3) are lowest for the medium and high site potential zones, indicating instability in distinguishing between these two zones. Increasing the number of sites for modeling may improve confidence in the model and model stability.
Table 8.26.3. Conditional Kappa Values for Site Probability Model, St. Louis Moraines and Tamarack Lowlands Subsections.
Class |
Ki |
Proportion Correct |
Low |
0.6085 |
0.9609 |
Medium |
0.2179 |
0.2569 |
High |
0.6057 |
0.6254 |
8.26.2.2.1 St. Louis Moraines
When the site probability model is applied to the St. Louis Moraines subsection, 88.39 percent of all sites, excluding single artifacts, are in the high and medium site potential areas, which constitute 18.72 percent of landscape (Table 8.26.4). This produces a strong overall gain statistic of 0.78821.
Table 8.26.4. Evaluation of St Louis Moraines Portion of Site Probability Model, St. Louis Moraines and Tamarack Lowlands Subsections.
Region (30 meter cells) |
Random Points |
Negative Survey Points |
Modeled Sites |
|||||
# |
% |
# |
% |
# |
% |
# |
% |
|
Low |
3480403 |
77.70 |
936 |
77.81 |
111 |
62.71 |
13 |
11.61 |
Medium |
410163 |
9.16 |
103 |
8.56 |
36 |
20.34 |
19 |
16.96 |
High |
428014 |
9.56 |
109 |
9.06 |
28 |
15.82 |
80 |
71.43 |
Water |
156570 |
3.50 |
53 |
4.41 |
2 |
1.13 |
0 |
0 |
Steep Slopes |
605 |
0.01 |
1 |
0.08 |
0 |
0 |
0 |
0 |
Mines |
3326 |
0.07 |
1 |
0.08 |
0 |
0 |
0 |
0 |
Total |
4479081 |
100 |
1203 |
100 |
177 |
100 |
112 |
100 |
There was 83 percent agreement for this model within the St. Louis Moraines subsection. The Kappa statistic for the model, which is adjusted for the amount of agreement expected by chance alone, applied to this subsection, was 0.49479. The conditional Kappa statistics (Table 8.26.5) are lowest for the medium and high site potential zones.
Table 8.26.5. Conditional Kappa Values for the St Louis Moraines Portion of Site Probability Model, St. Louis Moraines and Tamarack Lowlands Subsections.
Class |
Ki |
Proportion Correct |
Low |
0.6168 |
0.9251 |
Medium |
0.1943 |
0.2702 |
High |
0.5917 |
0.6331 |
8.26.2.2.2 Tamarack Lowlands
When the site probability model is applied to the Tamarack Lowlands subsection, 82.48 percent of all sites, excluding single artifacts, are in the high and medium site potential areas, which constitute 4.77 percent of landscape (Table 8.26.6). This produces a very strong overall gain statistic of 0.94484. This is an exceptionally high level of site probability model performance.
Table 8.26.6. Evaluation of Tamarack Lowlands Portion of Site Probability Model, St. Louis Moraines and Tamarack Lowlands Subsections.
Region (30 meter cells) |
Random Points |
Negative Survey Points |
Modeled Sites |
|||||
# |
% |
# |
% |
# |
% |
# |
% |
|
Low |
7532656 |
93.43 |
1727 |
92.75 |
248 |
50.30 |
9 |
12.16 |
Medium |
201623 |
2.50 |
51 |
2.74 |
38 |
7.71 |
3 |
4.05 |
High |
183388 |
2.27 |
52 |
2.79 |
204 |
41.38 |
61 |
82.43 |
Water |
67701 |
0.84 |
16 |
0.86 |
1 |
0.20 |
1 |
1.35 |
Steep Slopes |
355 |
0.00 |
0 |
0 |
0 |
0 |
0 |
0 |
Mines |
76879 |
0.95 |
16 |
0.86 |
2 |
0.41 |
0 |
0 |
Total |
8062602 |
100 |
1862 |
100 |
493 |
100 |
74 |
100 |
Agreement of the preliminary models for Tamarack Lowlands was 95 percent. The same level of agreement was observed for preliminary models developed for this individual subsection. The Kappa statistic for the model, which is adjusted for the amount of agreement expected by chance alone, applied to this subsection, was 0.46132, which is below average. The conditional Kappa statistics (Table 8.26.7) are lowest for the medium and high site potential zones.
Table 8.26.7. Conditional Kappa Values for the Tamarack Lowlands Portion of Site Probability Model, St. Louis Moraines And Tamarack Lowlands Subsections.
| Class | Ki |
Proportion
Correct |
| Low | 0.5188 |
0.9770 |
| Medium | 0.2012 |
0.2218 |
| High | 0.5961 |
0.6049 |
8.26.2.3 Interpretation
The site probability model for St. Louis Moraines/Tamarack Lowlands combined subsections is composed of 11 variables (three topographic, five hydrologic, two vegetation, one soils) (Table 8.26.1).
8.26.2.3.1 Differences between Modeled Sites and Random Points for Individual Model Variables
Model values correlate with five model variables with correlation coefficients of 0.3 or greater (Table 8.26.8). According to these variables, site potential is higher at lower elevations (Figure 8.26.7c), closer to large lakes (Figure 8.26.8d), lakes, wetlands, organic soils or streams (Figure 8.26.9d), and pine barrens or flats (Figure 8.26.11b), but farther from swamps (Figure 8.26.9b).
Differences in mean variable values between modeled sites and random points (Table 8.26.8) also indicate that sites are higher above their surroundings (Figures 8.26.4.a and Figure 8.26.7d), in larger minor watersheds (Figure 8.26.8b), in a less northerly direction from water bodies (Figure 8.26.8c), closer to permanent wetland inlet/outlets (Figure 8.26.10a), closer to prairie (Figure 8.26.11c), and farther from glacial lake sediment (Figure 8.26.12c).
The Mann-Whitney U tests (Table 8.26.8) indicate that all differences in variables between modeled sites and random points are significant at the 0.05 level. This means that the distribution in values between sites and random points is different enough for them to be considered originating from different populations.
Table 8.26.8. Model Variable Statistics.
St. Louis Moraines/ Tamarack Lowlands |
Modeled Sites |
Surveyed Areas |
Modeled Sites |
Sites in Low Prob. |
Neg. Survey Points |
Random Points |
||||||
Model Variable |
Coeff. |
Sign. |
Coeff. |
Sign. |
Mean |
S.D. |
Mean |
S.D. |
Mean |
S.D. |
Mean |
S.D. |
Distance to nearest major ridge or divide |
- |
- |
0.29 |
0.476 |
71.94 |
33.15 |
70.81 |
26.76 |
77.27 |
32.31 |
76.01 |
34.91 |
Distance to nearest minor ridge or divide |
- |
- |
0.089 |
0.959 |
28.26 |
13.5 |
20.96 |
11.35 |
23.43 |
11.5 |
24.54 |
11.6 |
Elevation |
-0.396 |
0 |
-0.501 |
0 |
1287.67 |
63.48 |
1322.91 |
81.03 |
1270.47 |
54.06 |
1318.6 |
69.13 |
Height above surroundings |
-0.142 |
0 |
0.037 |
0 |
9.4 |
10.35 |
8.68 |
7.24 |
5.44 |
8.3 |
4.79 |
7.65 |
Size of minor watershed |
0.092 |
0 |
- |
- |
8090 |
2588.44 |
7172.33 |
2433.16 |
7080.14 |
2166.22 |
7084.2 |
2001.1 |
Size of major watershed |
- |
- |
-0.014 |
0 |
2163.37 |
261.43 |
2045.31 |
426.93 |
2263.19 |
117.99 |
2185.1 |
288.91 |
Direction to nearest water or wetland (sine) |
-0.014 |
0 |
0.126 |
0 |
0.24 |
0.75 |
0.41 |
0.78 |
0.39 |
0.7 |
0.47 |
0.71 |
Distance to edge of nearest large lake |
-0.814 |
0 |
- |
- |
11.21 |
16.94 |
46.67 |
16.92 |
41.86 |
37.59 |
57.94 |
29.39 |
Distance to edge of nearest perennial river or stream |
- |
- |
0.248 |
0 |
34.32 |
15.28 |
21.95 |
19.01 |
38 |
17.37 |
33.88 |
16.84 |
Distance to edge of nearest swamp |
0.538 |
0 |
- |
- |
13.59 |
7.45 |
9.06 |
6.53 |
9.98 |
7.63 |
8.83 |
7.29 |
Distance to nearest confluence between perennial or intermittent streams and large rivers |
- |
- |
-0.15 |
0 |
69.27 |
24.61 |
62.43 |
36.14 |
64.43 |
25.38 |
78.84 |
28.16 |
Distance to nearest lake, wetland, organic soil, or stream |
-0.576 |
0 |
-0.468 |
0 |
3.5 |
4.83 |
5.33 |
5.62 |
7.53 |
10.53 |
10.62 |
9.97 |
Distance to nearest permanent wetland inlet/outlet |
0.295 |
0.002 |
- |
- |
138.58 |
34.27 |
132.77 |
36.78 |
154.27 |
27.88 |
148.01 |
38.39 |
Size of nearest permanent lake |
- |
- |
0.658 |
0 |
2896.79 |
2117.84 |
247.28 |
244.71 |
1477.41 |
2092.52 |
458.37 |
807.51 |
Distance to aspen-birch |
- |
- |
0.041 |
0 |
21.32 |
18.6 |
23.57 |
16.26 |
31.31 |
22.62 |
22.7 |
20.3 |
Distance to Big Woods |
- |
- |
-0.087 |
0 |
75.74 |
45.95 |
93.35 |
60.02 |
72.62 |
34.11 |
92.94 |
58.51 |
Distance to hardwoods |
- |
- |
-0.06 |
0 |
59.93 |
30.5 |
67.67 |
42.27 |
52.21 |
27.6 |
61.07 |
33.82 |
Distance to pine barrens or flats |
-0.374 |
0 |
-0.603 |
0 |
73.51 |
36.12 |
83.71 |
38.92 |
80.3 |
47.14 |
111.27 |
43.34 |
Distance to prairie |
-0.237 |
0.003 |
-0.403 |
0 |
320.38 |
48.74 |
333.09 |
63.17 |
313.72 |
38.09 |
330.33 |
57.95 |
Distance to river bottom forest |
- |
- |
-0.294 |
0 |
92.19 |
34.39 |
93.98 |
48.01 |
68.84 |
34.89 |
97.45 |
41.75 |
Vegetation diversity within 1 km |
- |
- |
0.293 |
0 |
3.27 |
0.98 |
3.32 |
0.99 |
2.92 |
1.19 |
2.53 |
0.93 |
Distance to edge of nearest area of organic soils |
- |
- |
0.152 |
0 |
49.37 |
22.13 |
37.72 |
24.73 |
36 |
18.86 |
33.7 |
20.38 |
Distance to glacial lake sediment |
-0.144 |
0 |
0.168 |
0.129 |
84.69 |
44.03 |
76.97 |
57.51 |
47.12 |
38.64 |
55.24 |
49.06 |
Frequency counts |
186 |
870 |
186 |
22 |
671 |
3066 |
||||||
See Interpretation section for discussion of the statistics:
Coeff. = correlation coefficient
Sign. = significance of the Mann-Whitney U test
S.D. = standard deviation
Distances and areas are expressed in square roots of meters. Square the values in the table to get actual values.
8.26.2.3.2 Relationships between Variable Pairs
The correlation matrix indicates that there is a moderate amount of redundancy between the site model variables (Table 8.26.9). There are eight variable pairs, involving seven variables, with coefficients greater than 0.5. Elevation has a high positive coefficient with distance to prairie (0.86) and moderate ones with distance to pine barrens or flats (0.57), distance to glacial lake sediment (0.53), indicating that these environmental features tend to be at lower elevations within these subsections.
The negative correlation between elevation and distance to nearest permanent wetland inlet/outlet (-0.64) implies that these inlet/outlets are at higher elevations. Permanent wetland inlet/outlets are in turn negatively associated with distance to pine barrens or flats (-0.53) and distance to prairie (-0.53), which are likely to be at lower elevations. Distance to pine barrens or flats positively correlated with glacial lake sediment (0.57), both low elevation features. Finally, distance to nearest large lake is positively correlated with distance to nearest lake, wetland, organic soil, or stream (0.68), for obvious reasons.
Table 8.26.9. Variable Correlation Matrix.
St. Louis Moraines – Tamarack Lowlands |
Elevation |
Height above surroundings |
Size of minor watershed |
Direction to nearest water or wetland (sine) |
Distance to edge of nearest large lake |
Distance to edge of nearest swamp |
Distance to nearest lake, wetland, organic soil, or stream |
Distance to nearest permanent wetland inlet/outlet |
Distance to pine barrens or flats |
Distance to prairie |
Distance to glacial lake sediment |
Elevation |
1 |
||||||||||
Height above surroundings |
0.38 |
1 |
|||||||||
Size of minor watershed |
0.27 |
0.1 |
1 |
||||||||
Direction to nearest water or wetland (sine) |
-0.13 |
-0.28 |
-0.02 |
1 |
|||||||
Distance to edge of nearest large lake |
0.19 |
0.2 |
-0.09 |
-0.15 |
1 |
||||||
Distance to edge of nearest swamp |
-0.25 |
-0.17 |
0.14 |
0.04 |
-0.29 |
1 |
|||||
Distance to nearest lake, wetland, organic soil, or stream |
0.26 |
0.34 |
0.06 |
-0.2 |
0.68 |
-0.04 |
1 |
||||
Distance to nearest permanent wetland inlet/outlet |
-0.64 |
-0.18 |
-0.14 |
0.05 |
-0.12 |
0.29 |
-0.1 |
1 |
|||
Distance to pine barrens or flats |
0.57 |
0.29 |
0.25 |
-0.12 |
0.18 |
-0.23 |
0.13 |
-0.53 |
1 |
||
Distance to prairie |
0.86 |
0.2 |
0.3 |
-0.04 |
0.07 |
-0.07 |
0.14 |
-0.53 |
0.47 |
1 |
|
Distance to glacial lake sediment |
0.53 |
0.05 |
0.03 |
-0.02 |
0.01 |
-0.18 |
0.08 |
-0.4 |
0.57 |
0.49 |
1 |
Refer to "Relationships between variable pairs" for interpretation of the table values.
8.26.2.3.3 Sites in Low Probability Areas
Sites in low potential areas have mean values near random points on six variables (Table 8.26.8). There are two variables where these differences are rather clear. Compared to the mean values of all modeled sites, sites in low potential areas are further from large lakes (2178 vs. 126 meters) and nearer swamps (82 vs. 185 meters). Sites in low potential areas are dissimilar to random points for five variables, including height above surroundings (8.7 vs. 4.8 feet) and distance to lakes, wetlands, organic soils, or streams (28 vs. 113 meters).
Of the 22 sites not predicted by the model, 13 are in the St. Louis Moraines and nine are in the Tamarack Lowlands. Sites not predicted in the St. Louis Moraines include one wild rice site, two mortuary/cemetery sites, one mound or earthwork, two artifact scatters, and seven lithic scatters. In the Tamarack Lowlands, they include one mortuary/cemetery, two mounds or earthworks, one trading post, one artifact scatter, and four lithic scatters. If all site types were equally well predicted, 11.83 percent of each type should be found in low probability areas. Only mounds and earthworks are represented in something close to this proportion. Artifact scatters are quite under represented, with only three of 91 known artifact scatters in the low probability area. This indicates that the model is doing a good job predicting this site type. The other site types appear to be over represented in low probability areas, but the total numbers of wild rice sites (4), mortuary/cemetery sites (9), and trading posts (3) are so low that this may not be significant. However, with 11 (20.37 percent) of 54 lithic scatters in the low probability areas, it would appear that the model does a relatively poor job of predicting this type of site.
8.26.2.3.4 Relationships between Cultural Context, Descriptive, or Settlement Variables and Site Potential
Table 8.26.10 provides a breakdown of the number of sites in the three probability classes according to three separate variables (aceramic/not aceramic, Archaic/not Archaic, single component/not single component). Two of the relationships are significant at the 0.05 level, as measured by the chi-square test. Sites lacking pottery are relatively more common in the low to medium site potential area (16.9 percent and 15.5 percent) compared to ceramic-bearing sites (3.6 percent and 7.2 percent) but less likely to occur in the high site potential areas (67.6 percent vs. 89.2 percent). Sites containing Archaic components are over represented in the medium site potential class compared to sites lacking these components (33.3 percent vs. 7.1 percent). These Archaic components contribute to the relatively high frequencies of aceramic sites in the medium site potential areas, although sites frequently classified as lithic scatters probably account for most of the difference.
Table 8.26.10. Summary of Bivariate Relationships between Three Dichotomous Archaeological Variables and Three Areas of Site Potential, St. Louis Moraines – Tamarack Lowlands (Site Probability Model).
Low Potential |
Medium Potential |
High Potential |
Total |
Chi-square Test |
|||||||
Dichotomous Variable |
N |
% |
N |
% |
N |
% |
N |
% |
value |
df |
p-value |
All Modeled Sites |
22 |
11.9 |
22 |
11.9 |
141 |
76.2 |
185 |
100.0 |
- |
- |
- |
Aceramic |
12 |
16.9 |
11 |
15.5 |
48 |
67.6 |
71 |
100.0 |
11.55 |
2 |
0.00 |
Not Aceramic |
3 |
3.6 |
6 |
7.2 |
74 |
89.2 |
83 |
100.0 |
|||
Archaic |
0 |
0.0 |
4 |
33.3 |
8 |
66.7 |
12 |
100.0 |
7.96 |
2 |
0.02 |
Not Archaic |
3 |
3.6 |
6 |
7.1 |
75 |
89.3 |
84 |
100.0 |
|||
Single Component |
3 |
3.9 |
6 |
7.8 |
68 |
88.3 |
77 |
100.0 |
3.47 |
2 |
0.18 |
Not Single Component |
0 |
0.0 |
4 |
21.1 |
15 |
78.9 |
19 |
100.0 |
|||
8.26.3 Survey Probability Model
The survey probability model (Figure 8.26.5) for St. Louis Moraines and Tamarack Lowlands Subsections indicates that large portions of these subsections have not been adequately surveyed. The distribution of high and medium survey potential is strongly influenced by a non-uniform distribution of surveys and only somewhat resembles the site probability model. The large unsurveyed areas include large peatlands as well as ground and end moraines (Figure 8.26.2.b).
The overwhelming majority of surveyed places are located in several clusters and linear corridors and are separated by extensive areas with low survey frequency. The longest linear survey follows State Highway 2 in a northwest-southeast orientation for 70 km. It is surrounded by a corresponding zone of high and medium survey potential.
North central Aitkin County is also well-surveyed. One survey follows the lakeshores of Big Sandy, Aitkin, Minnewawa and other smaller lakes. An adjacent 18 km linear survey track follows the Mississippi River valley between the Moose - Willow Wildlife Area and the town of Palisade. The corresponding zone of high and medium survey potential encompasses both surveys in an irregularly shaped polygon approximately 25 km in diameter.
The southern tip of the Tamarack Lowlands subsection is marked by another linear survey, seven km long, along the beach ridge of the Lake Upham/Aitkin geomorphologic association. This survey is associated with an elongated medium potential survey zone that extends further upstream along the Mississippi River to connect with the much larger zone described in the previous paragraph. Other surveys within the St. Louis Moraines subsection are located around Pokegama Lake and near Trout, Wabana and Deer Lakes in south central Itasca County. The few remaining small zones of high and medium survey potential that are not associated with survey clusters are in proximity to lakes, river confluences, and streams.
8.26.3.2 Evaluation
This survey probability model predicted surveyed places very well, indicating that surveys have not been located randomly within this region. It is based on 19 variables (Table 8.26.11), representing topography, vegetation, soils and hydrology.
Table 8.26.11. Survey Probability Model, St. Louis Moraines and Tamarack Lowlands Subsections.
Intercept |
21.803 |
|
ln(nonsites/sites) |
1.259635848 |
|
Variable |
Regression Coefficient |
Probability |
Elevation |
-0.02654191 |
100.0 |
Direction to nearest water or wetland |
-0.3723205 |
100.0 |
Distance to aspen-birch |
0.02827087 |
100.0 |
Distance to Big Woods |
-0.007984235 |
99.3 |
Distance to edge of nearest area of organic soils |
0.01810713 |
100.0 |
Distance to edge of nearest perennial river or stream |
0.02194947 |
100.0 |
Distance to glacial lake sediment |
0.01300450 |
100.0 |
Distance to hardwoods |
0.02484328 |
100.0 |
Distance to nearest confluence between perennial or intermittent streams and large rivers |
-0.010345799 |
100.0 |
Distance to nearest lake, wetland, organic soils, or stream |
-0.04697748 |
100.0 |
Distance to nearest major ridge or divide |
-0.008897205 |
100.0 |
Distance to nearest minor ridge or divide |
-0.01352270 |
76.5 |
Distance to pine barrens or flats |
-0.009167215 |
100.0 |
Distance to prairie |
0.02213017 |
100.0 |
Distance to river bottom forest |
-0.01804470 |
100.0 |
Height above surroundings |
0.04365689 |
100.0 |
Size of major watershed |
0.001208864 |
99.2 |
Size of nearest permanent lake |
0.0002299253 |
100.0 |
Vegetation diversity within 1 km |
0.170693 |
48.7 |
The model predicts 82.18 percent of all surveyed places in high/medium survey potential areas, which make up 24.37 percent of the landscape (Table 8.26.12). This produces a strong gain statistic of 0.70846 (Table 8.6.14), which indicates a high degree of survey bias. This model was able to predict surveyed places with less precision than the site probability model was able to predict sites, indicating that sites are confined to only a portion of the total area surveyed. The low numbers of both sites (199) and negative survey points (671) in the large area of this region bear this out. This indicates a frequency of only 0.077 surveyed places per square km (Table 8.6.14), with a frequency of only 0.01765 known sites per square km. These numbers are quite low compared to other regions. Only 13 single artifacts are recorded in the region. However, excluding them from the sample drops the site frequency only slightly, to 0.0165.
Table 8.26.12. Evaluation of Survey Probability Model, St. Louis Moraines and Tamarack Lowlands Subsections.
Region (30 meter cells) |
All random points |
All negative survey points |
All sites |
All sites and negative survey points |
||||||
# |
% |
# |
% |
# |
% |
# |
% |
# |
% |
|
Low |
9166246 |
73.19 |
2176 |
70.97 |
123 |
18.33 |
26 |
13.07 |
149 |
17.13 |
Medium |
1831318 |
14.62 |
485 |
15.82 |
106 |
15.80 |
26 |
13.07 |
132 |
15.17 |
High |
1221611 |
9.75 |
318 |
10.37 |
437 |
65.13 |
146 |
73.37 |
583 |
67.01 |
Water |
224189 |
1.79 |
69 |
2.25 |
3 |
0.45 |
1 |
0.50 |
4 |
0.46 |
Steep Slopes |
960 |
0.01 |
1 |
0.03 |
0 |
0 |
0 |
0 |
0 |
0 |
Mines |
80117 |
0.64 |
17 |
0.55 |
2 |
0.30 |
0 |
0 |
2 |
0.23 |
Total |
12524441 |
100 |
3306 |
100 |
671 |
100 |
199 |
100 |
870 |
100 |
The database included 870 surveyed places (Table 8.26.12). Two preliminary survey probability models for the combined subsections had 78.92 percent agreement. The Kappa statistic for these models was 0.5466 (Table 8.6.14), which is close to average. The conditional Kappa statistics (Table 8.26.13) are lowest for the medium potential zone. It is assumed that increasing the number of surveyed places for modeling may improve model stability, as will distributing more surveys throughout the undersurveyed areas.
Table 8.26.13. Conditional Kappa Values for Survey Probability Model, St. Louis Moraines and Tamarack Lowlands Subsections.
Class |
Ki |
Proportion Correct |
Low |
0.6626 |
0.8988 |
Medium |
0.2839 |
0.3914 |
High |
0.6178 |
0.6751 |
8.26.3.2.1 St. Louis Moraines
When the survey probability model is applied to the St. Louis Moraines subsection, 77.00 percent of all surveyed places are in the high and medium survey potential areas, which constitute 25.05 percent of landscape (Table 8.26.14). This produces a good gain statistic of 0.67442. However, its performance is attained at the expense of predicting fewer than 85 percent of surveyed places. The strong performance of this model in the Tamarack Lowlands subsection accounts for this. Because many more surveyed places are recorded in Tamarack Lowlands, the model is weighted towards that subsection.
Table 8.26.14. Evaluation of St Louis Moraines Portion of the Survey Probability Model, St. Louis Moraines and Tamarack Lowlands Subsections.
All random points |
All negative survey points |
All negative survey points |
All sites |
All sites and negative survey points |
||||||
# |
% |
# |
% |
# |
% |
# |
% |
# |
% |
|
Low |
3196005 |
71.35 |
832 |
69.16 |
47 |
26.55 |
20 |
16.26 |
67 |
22.33 |
Medium |
620137 |
13.85 |
184 |
15.30 |
29 |
16.38 |
20 |
16.26 |
49 |
16.33 |
High |
502438 |
11.22 |
132 |
10.97 |
99 |
55.93 |
83 |
67.48 |
182 |
60.67 |
Water |
156570 |
3.50 |
53 |
4.41 |
2 |
1.13 |
0 |
0 |
2 |
0.67 |
Steep Slopes |
605 |
0.01 |
1 |
0.08 |
0 |
0 |
0 |
0 |
0 |
0 |
Mines |
3326 |
0.07 |
1 |
0.08 |
0 |
0 |
0 |
0 |
0 |
0 |
Total |
4479081 |
100 |
1203 |
100 |
177 |
100 |
123 |
100 |
300 |
100 |
The agreement of the preliminary models within the St. Louis Moraines subsection was 78 percent. The Kappa statistic for these models was 0.5213. The conditional Kappa statistics (Table 8.26.15) are lowest for the medium potential zone.
Table 8.26.15. Conditional Kappa Values for the St Louis Moraines Portion of the Survey Probability Model, St. Louis Moraines and Tamarack Lowlands Subsections.
Class |
Ki |
Proportion Correct |
Low |
0.6757 |
0.9064 |
Medium |
0.2174 |
0.3206 |
High |
0.5377 |
0.6102 |
8.26.3.2.2 Tamarack Lowlands
When the survey probability model is applied to the Tamarack Lowlands subsection, 85.06 percent of all surveyed places are in the high and medium survey potential areas, which constitute 24.00 percent of landscape (Table 8.26.16). This produces a strong overall gain statistic of 0.71785.
Table 8.26.16. Evaluation of Tamarack Lowlands Portion of the Survey Probability Model, St. Louis Moraines and Tamarack Lowlands Subsections.
Region (30 meter cells) |
All random points |
All negative survey points |
All sites |
All sites and negative survey points |
||||||
# |
% |
# |
% |
# |
% |
# |
% |
# |
% |
|
Low |
5983070 |
74.21 |
1343 |
72.13 |
75 |
15.21 |
6 |
7.89 |
81 |
14.24 |
Medium |
1213171 |
15.05 |
301 |
16.17 |
77 |
15.62 |
6 |
7.89 |
83 |
14.59 |
High |
721426 |
8.95 |
186 |
9.99 |
338 |
68.56 |
63 |
82.89 |
401 |
70.47 |
Water |
67701 |
0.84 |
16 |
0.86 |
1 |
0.20 |
1 |
1.32 |
2 |
0.35 |
Steep Slopes |
355 |
0.00 |
0 |
0 |
2 |
0.41 |
0 |
0 |
0 |
0 |
Mines |
76879 |
0.95 |
16 |
0.86 |
0 |
0 |
0 |
0 |
2 |
0.35 |
Total |
8062602 |
100 |
1862 |
100 |
493 |
100 |
76 |
100 |
569 |
100 |
Agreement of the preliminary models for Tamarack Lowlands was 80 percent. The Kappa statistic for these models was 0.56031. The conditional Kappa statistics (Table 8.26.17) are lowest for the medium potential zone.
Table 8.26.17. Conditional Kappa Values for the Tamarack Lowlands Portion of the Survey Probability Model, St. Louis Moraines and Tamarack Lowlands Subsections.
Class |
Ki |
Proportion Correct |
Low |
0.6565 |
0.8949 |
Medium |
0.3114 |
0.4215 |
High |
0.6780 |
0.7251 |
8.26.3.3 Interpretation
The survey probability model is constructed from 19 variables, nearly equally divided between topographic, hydrologic, and vegetation characteristics (Table 8.26.8). Two soils variables are also included in the model. Seven of the site probability model variables are included in the survey probability model.
There are five variables with correlation coefficients greater than 0.3. Surveyed areas, compared to random points, tend to be in areas of lower elevation (Figure 8.26.7c), near lakes, wetlands, organic soils, or streams (Figure 8.26.9d), large permanent lakes (Figure 8.26.10b), pine barrens or flats (Figure 8.26.11b), and prairie (Figure 8.26.11c).
Negative survey points, places that have been surveyed but no sites were found, have mean values similar to those of random points on five variables: distance to nearest major ridge or divide (Figure 8.26.7a), distance to nearest minor ridge or divide (Figure 8.26.7b), height above surroundings (Figure 8.26.7d), distance to edge of nearest area of organic soils (Figure 8.26.12b), and distance to glacial lake sediment (Figure 8.26.12c). However, they are similar to sites with respect to distance to Big Woods (Figure 8.26.10d). With respect to direction to nearest water or wetland (sine) (Figure 8.26.8c), distance to nearest confluence between perennial or intermittent streams and large rivers (Figure 8.26.9c), and vegetation diversity within 1 km (Figures 8.26.4.b and 8.26.12a), negative survey points are intermediate between sites and random points.
Negative survey points are distinctive on five other variables. Compared to both sites and random points, they are in larger major watersheds (Figure 8.26.8a) where they are farther from perennial rivers and streams (Figure 8.26.9a) and aspen-birch (Figure 8.26.10c), but closer to hardwoods (Figure 8.26.11a) and river bottom forest (Figure 8.26.11d).
The Mann-Whitney U tests indicate that the distribution in values for surveyed places, compared to random points, are different enough (at the 0.05 level of significance) on all except three variables to consider them as originating from separate populations (Table 8.26.8). As a whole, the surveys conducted in this subsection are non-random in relation to the variables included in the model.
8.26.4 Survey Implementation Model
The survey implementation model for the St. Louis Moraines and Tamarack Lowlands subsections indicates that 70.37 percent of the land area is categorized as unknown because of inadequate survey (Figure 8.26.6 and Table 8.26.18). This is much higher than the statewide average, but is typical for the northern part of the state. Eight (24.24 percent) of the test sites were found in the unknown area.
Zones of suspected high and possibly high site probability are common around lakes. This indicates that, even though similar environments have not been well surveyed, they are similar to other areas where sites have been found. Low and possibly low probability areas occupy only 17.44 percent of the landscape. These are typically found in the vicinity of the survey clusters described in Section 8.26.3.1.
Table 8.26.18. Evaluation of Survey Implementation Model, St. Louis Moraines and Tamarack Lowlands Subsections.
Region (30 meter cells) |
Random Points |
Negative Survey Points |
Single Artifacts |
Sites |
||||||
# |
% |
# |
% |
# |
% |
# |
% |
# |
% |
|
Unknown |
8812995 |
70.37 |
2101 |
68.53 |
107 |
15.95 |
2 |
15.38 |
11 |
5.91 |
Possibly Low |
1492497 |
11.92 |
390 |
12.72 |
88 |
13.11 |
0 |
0 |
5 |
2.69 |
Low |
691793 |
5.52 |
173 |
5.64 |
165 |
24.59 |
0 |
0 |
6 |
3.23 |
Suspected Medium |
224278 |
1.79 |
45 |
1.47 |
13 |
1.94 |
0 |
0 |
6 |
3.23 |
Possibly Medium |
188951 |
1.51 |
53 |
1.73 |
13 |
1.94 |
0 |
0 |
6 |
3.23 |
Medium |
197711 |
1.58 |
56 |
1.83 |
48 |
7.15 |
0 |
0 |
10 |
5.38 |
Suspected High |
128973 |
1.03 |
30 |
0.98 |
3 |
0.45 |
1 |
7.69 |
6 |
3.23 |
Possibly High |
149870 |
1.2 |
42 |
1.37 |
5 |
0.75 |
0 |
0 |
15 |
8.06 |
High |
332107 |
2.65 |
89 |
2.9 |
224 |
33.38 |
10 |
76.92 |
120 |
64.52 |
Water |
224189 |
1.79 |
69 |
2.25 |
3 |
0.45 |
0 |
0 |
1 |
0.54 |
Steep Slopes |
960 |
0.01 |
1 |
0.03 |
0 |
0 |
0 |
0 |
0 |
0 |
Mines |
80117 |
0.64 |
17 |
0.55 |
2 |
0.3 |
0 |
0 |
0 |
0 |
Total |
12524441 |
100 |
3066 |
100 |
671 |
100 |
13 |
100 |
186 |
100 |
River valley floors and terraces, lake margins, and peat deposits in the St. Louis Moraines and Tamarack Lowlands have the potential to contain deeply buried archaeological sites. The Mn/Model landscape suitability model for the Mississippi River valley cuts through the southwestern third of these combined subsections (Section 12.4). This model should be consulted for information regarding the geomorphic potential for both surface and subsurface archaeological sites.
The Mn/Model Final Report (Phases 1-3) is available on CD-ROM. Copies may be requested by visiting the contact page.

Acknowledgements
MnModel was financed with Transportation Enhancement and State Planning and Research funds from the Federal Highway Administration and a Minnesota Department of Transportation match.
Copyright Notice
The MnModel process and the predictive models it produced are copyrighted by the Minnesota Department of Transportation (MnDOT), 2000. They may not be used without MnDOT's consent.