Quick Links
Chapters
- Management Summary
- Research Design & Time Line
- Environment & Native American Culture
- GIS Design
- Archaeological Database
- Archaeological & Environmental Variables
- Model Development & Evaluation
- Model Results & Interpretation
- Project Applications
- Model Enhancements
- Model Implementation
- Landscape Suitability Models
- Summary & Recommendations
Appendices
- Archaeological Predictive Modeling: An Overview
- GIS Standards & Procedures
- Archaeology Field Survey Standards, Procedures & Rationale
- Archaeology Field Survey Results
- Geomorphology Survey Profiles, Sections, & Lists
- Building a Macrophysical Climate Model for the State of Minnesota
- Correspondence of Support for Mn/Model
- Glossary
- List of Figures
- List of Tables
- Acknowledgments
8.13 CHIPPEWA PLAINS SUBSECTION OF NORTH MINNESOTA DRIFT & L AKE PLAINS SECTION
8.13.1 Environmental Context
8.13.2 Site Probability Model
8.13.3 Survey Probability Model
8.13.4 Survey Implementation Model
8.13.5 Other Models
This regional model report is organized as described in Sections 8.2.1 through 8.4.1. Refer to these sections of the report for explanations of the tables, variables, and statistics.
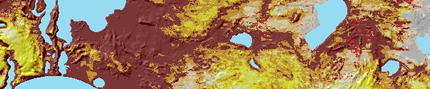
Chippewa Plains is a subsection of the Northern Minnesota Drift and Lake Plains Section of the Laurentian Mixed Forest Province (Figure 8.1) (Minnesota DNR 1998). It is dominated by level to gently rolling lake and till plains and three large lakes: Leech Lake, Lake Winnibigoshish, and Cass Lake.
The Chippewa Plains subsection is defined by a combination of lithology, geomorphic processes, historic vegetation, and subregional climate patterns. It is bounded by the southern shore of Glacial Lake Agassiz on the north (Figure 8.13.2a) and the southern edge of the Wadena Lobe till islands on the south. The short western boundary corresponds with the interface between prairie, aspen-oak land, brush prairie on the west, and coniferous forest on the east based on the historic vegetation record (Figure 8.13.1.b). The eastern boundary of this subsection is the interface between the end moraine of the Des Moines Lobe on the east side of the subsection boundary and Des Moines Lobe ground moraines and outwash deposits on the west.
Bedrock in this subsection consists of calcareous parent material. A large glacial outwash plain, containing extensive sections of peat, occupies an east-west swath across the central and south-central portion of the subsection (Figure 8.13.2.a and b). Ground and stagnation moraines surround this swath on the north, east, and south. The ground and stagnation moraines in the northern portion of the subsection are characterized by elevated, rolling topography and well-drained sandy soils, and form a section of the Continental Divide.
Many small streams dissect the northern portion of this moraine and drain into Red Lake, which subsequently drains to the Red River and Hudson Bay. Drainage from the moraines in the southern portion of the subsection flows south to the Mississippi River. Two large lakes,Winnibigoshish and Cass, (Figure 8.13.1.a ) are located on the level to gently rolling outwash plain. A third large lake, Leech, is located on the flatter till plains to the south. The Mississippi River originates just to the south of this subsection and flows east through the outwash plain through Lake Bemidji into Cass Lake, into Lake Winnibigoshish, and finally to the southeast, cutting through a ground moraine before leaving the subsection.
In the 19th century, hardwood components of the boreal forest, primarily aspen-birch, were dominant on the moraines, although extensive growth of jack and white pine were found at their western end. Poorly drained soils, concentrated in the eastern portion of the outwash plain, contained conifer bogs and swamps . Wet prairies were located along the floodplain of the Mississippi River. Coniferous trees, notably jack pine, and, to a lesser extent, hardwoods occupied the well-drained soils of the outwash plain.
8.13.2.1 Description
Areas of high and medium site potential for archaeological sites in Chippewa Plains are concentrated within the outwash plain and are associated with surface water features and changes in elevation (Figure 8.13.3). These areas surround the largest lakes in the subsection, Leech Lake and Lake Winnibigoshish in northern Cass and southwestern Itasca counties. The zone of high and medium site potential is narrower on the east side of the lakes than the west. High and medium site potential is also found near smaller lakes in the region, including Bowstring, Sand, Round, Ball Club, and Pokegama Lakes in Itasca County, Cass Lake in Cass and Beltrami counties, Sixmile Lake in Cass County, Steamboat Lake in Cass and Hubbard counties, and Big Lake in Beltrami County.
Rivers and streams also play a role in the location of high and medium site potential. Areas of high and medium site potential are particularly prevalent in elevated areas along streams. The Mississippi River and two of its tributaries in southwestern Beltrami County, the Little Mississippi River and Grant Creek, are areas of high site potential within the outwash plain. Areas of low site potential surround the Mississippi River where it flows across moraines in the southeast part of the subsection. Other streams in the region where sites are likely to be found include Clearwater and Turtle rivers in Beltrami County, the Third River which flows into the northern end of Lake Winnibigoshish, and Bowstring River, Deer River, Dunbar Creek, and Moose Brook in Itasca County. Streams in proximity to steep slopes and uneven terrain are more likely to have areas of high and medium site potential adjacent to them.
Throughout the subsection there are conspicuous straight east-west and north-south lines of high and medium site potential. These lines are artifacts of the edges of adjacent quad sheets and should not be considered predictive features. They represent boundaries between 1:250,000 scale and 1:24,000 scale quads and between adjacent 1:24,000 scale quads that were digitized using different methods. They have been assigned high site potential values because of apparent (not real) elevation changes from one quad sheet to the next. These elevation differences are data errors. There are also data errors in the high and medium site potential areas in the southeastern portion of the subsection. These artifacts show up as east-west striations or bands of high and medium site potential alternating with low site potential. These lines are artifacts of the methodology employed when the digital elevation data was created and should not be considered predictive features.
8.13.2.2 Evaluation
The site probability model performed well. It is based on 14 variables (Table 8.13.1) representing topography (Figure 8.13.1.a ), vegetation (Figure 8.13.1.b), soils (Figure 8.13.2.b), and hydrology (Figure 8.13.1.a). In this model, 85.96 percent of all known sites are in high/medium site potential areas, which make up only 26.79 percent of landscape (Table 8.13.2). This produces a good gain statistic of 0.68834 (Table 8.6.11).
The modeling database included 513 sites that were not single artifacts. This is greater than the average number of sites for the Phase 3 regions (Table 8.6.11). Two preliminary models using different halves of the known sites had 83 percent agreement (83 percent of the cells in the subsection were classified the same in both models). The model test, based on a large number of new sites, performed well. The model predicted 78.48 percent of the new sites, producing a test gain statistic of 0.65864. The Kappa statistic, which is adjusted for the amount of agreement expected by chance alone, for these models was 0.62861 (Table 8.6.11), making this model one of the most stable produced.
Table 8.13.1. Site Probability Model, Chippewa Plains Subsection
Intercept |
14.440 |
|
ln (nonsites/sites) |
1.568859553 |
|
Variable |
Regression Coefficient |
Probability |
Direction to nearest water or wetland |
-0.379752 |
100 |
Distance to conifers |
-0.0147699 |
46.7 |
Distance to edge of nearest large lake |
-0.0296858 |
100 |
Distance to edge of nearest large wetland |
-0.0268182 |
100 |
Distance to edge of nearest perennial river or stream |
-0.0280006 |
100 |
Distance to nearest lake, wetland, organic soil, or stream |
-0.0404894 |
97.6 |
Distance to oak woodland |
-0.0100151 |
100 |
Distance to paper birch |
0.0262711 |
100 |
Distance to prairie |
0.014829 |
100 |
Elevation |
-0.0264533 |
100 |
Height above surroundings |
0.0888138 |
100 |
Size of nearest lake |
0.0000616061 |
100 |
Surface roughness |
0.0798628 |
100 |
Vertical distance to permanent water |
-0.0273067 |
100 |
Table 8.13.2. Evaluation of Site Probability Model, Chippewa Plains Subsection
Region (30 meter cells) |
Random Points |
Negative Survey Points |
Modeled Sites |
Test Sites |
||||||
# |
% |
# |
% |
# |
% |
# |
% |
# |
% |
|
Low |
5861889 |
62.54 |
1487 |
60.37 |
630 |
55.60 |
42 |
8.19 |
30 |
18.99 |
Medium |
1254863 |
13.39 |
341 |
13.84 |
244 |
21.54 |
69 |
13.45 |
20 |
12.66 |
High |
1255814 |
13.40 |
350 |
14.21 |
253 |
22.33 |
372 |
72.51 |
104 |
65.82 |
Water |
1000898 |
10.68 |
285 |
11.57 |
6 |
0.53 |
30 |
5.85 |
4 |
2.53 |
Steep Slopes |
81 |
0.001 |
0 |
0 |
0 |
0 |
0 |
0 |
0 |
0 |
Mines |
0 |
0 |
0 |
0 |
0 |
0 |
0 |
0 |
0 |
0 |
Total |
9373545 |
100 |
2463 |
100 |
1133 |
100 |
513 |
100 |
158 |
100 |
The conditional Kappa statistics (Table 8.13.3) are lowest for the medium site potential zone, but this is less than 14 percent of the subsection area. Increasing the number of sites for modeling may improve confidence in the model, and model stability. For this to be effective, surveys should be conducted in undersurveyed areas.
Table 8.13.3. Conditional Kappa Values for Site Probability Model, Chippewa Plains Subsection
Class |
Ki |
Proportion Correct |
Low |
0.7358 |
0.9208 |
Medium |
0.3689 |
0.4635 |
High |
0.7121 |
0.7552 |
8.13.2.3 Interpretation
The site probability model from the Chippewa Plains subsection is composed of three topographic, seven hydrologic, and four vegetative variables.
8.13.2.3.1 Differences between Modeled Sites and Random Points for Individual Model Variables
Four variables have correlation coefficients of 0.3 and above with site probability values for modeled sites (height above surroundings, surface roughness , distance to nearest large lake, and size of nearest lake) (Table 8.13.4). Two of these, height above surroundings (Figures 8.13.4.a and 8.13.8d) and surface roughness (Figure 8.13.5.a and 8.13.9a), are positively correlated with modeled sites. On average, modeled sites are at 9.21 feet above their surroundings compared to random points at. 4.74 feet. Although there is almost no difference in mean values of surface roughness for sites (211) and random points (210), values for modeled sites exhibit a narrower range (Figure 8.13.9a).
Sites are also strongly correlated with the variable size of nearest lake (Figure 8.13.11c) and negatively correlated with distance to the nearest large lake (Figure 8.13.9c), as site potential increases near large lakes. Modeled sites have a mean distance of 718 meters to large lakes compared to the random point value of 2304 meters. The largest lakes are in the southern half of the subsection, where both sites and surveyed places are concentrated (Figure 8.13.1a).
Modeled sites and random points differ on other variables as well. Sites have lower mean values than do random points (50 vs. 127 meters) for distance to nearest lake, wetland, organic soil or stream (Figure 8.13.11a ), indicating their proximity to water bodies of all types. Sites are also closer than random points (9.6 vs. 14.6 feet) in vertical distance to permanent water (Figures 8.13.4.b and 8.13.11d). Water and wetlands are in a less northerly direction from modeled sites than from random points (Figure 8.13.9). Sites are closer to perennial rivers and streams (Figure 8.13.10a). Sites tend to be closer to oak woodland (Figure 8.13.12d) than random points. Oak woodland is uncommon in the Chippewa Plains. The little that occurs is at the northern end of Cass Lake in the southeastern corner of Beltrami County. Sites are farther from paper birch (Figures 8.13.13a and 8.13.5) and prairie (Figure 8.13.13c) than are random points. Prairie is peripheral to the region, with the nearest prairies mapped in the Aspen Parklands and Hardwood Hills subsections to the west. The negative correlation of sites with this variable may simply reflect their concentration in the eastern 2/3 of the Chippewa Plains. Paper birch, on the other hand, is widely distributed throughout this subsection (Figure 8.13.13a). However, it is less common around the large lakes in the southern half of the subsection than further north.
The Mann-Whitney U test is significant at the 0.05 level for all except one variable, distance to conifers (Table 8.13.4). This indicates that the modeled sites are distributed in a non-random fashion across the landscape or, alternatively, that the sites and random points are drawn from different populations.
Table 8.13.4. Model Variable Statistics
Chippewa Plains |
Modeled Sites |
Surveyed Areas |
Modeled Sites |
Sites in Low Prob. |
Neg. Survey Points |
Random Points |
||||||
Model Variable |
Coeff. |
Sign. |
Coeff. |
Sign. |
Mean |
S.D. |
Mean |
S.D. |
Mean |
S.D. |
Mean |
S.D. |
Distance to nearest major ridge or divide |
- |
- |
-0.254 |
0 |
78.98 |
30.14 |
81.05 |
30.21 |
62.35 |
33.75 |
77.82 |
32.6 |
Distance to nearest minor ridge or divide |
- |
- |
-0.206 |
0 |
29.79 |
19.56 |
25.78 |
15.44 |
21.56 |
11.4 |
29.19 |
17.04 |
Elevation |
-0.132 |
0 |
- |
- |
1321.34 |
26.7 |
1350.19 |
43.14 |
1346.1 |
46.09 |
1345.2 |
51.49 |
Height above surroundings |
0.431 |
0 |
0.246 |
0 |
9.21 |
8.62 |
4.81 |
4.47 |
5.64 |
6.48 |
4.72 |
6.39 |
Prevailing orientation |
- |
- |
-0.292 |
0 |
91.97 |
53.97 |
108.6 |
56.16 |
91.87 |
56.98 |
111.37 |
60.43 |
Surface roughness |
0.373 |
0 |
- |
- |
211.45 |
8.91 |
210.14 |
7.98 |
211.19 |
10.25 |
210.25 |
11.32 |
Direction to nearest water or wetland (sine) |
-0.014 |
0 |
-0.165 |
0 |
0.34 |
0.73 |
0.33 |
0.69 |
0.2 |
0.75 |
0.45 |
0.72 |
Distance to edge of nearest large lake |
-0.407 |
0 |
-0.363 |
0 |
26.8 |
21.6 |
46.15 |
26.23 |
43.35 |
19.36 |
48.02 |
25.71 |
Distance to edge of nearest large wetland |
0.024 |
0 |
0.02 |
0.009 |
16.01 |
12.32 |
17.27 |
14.12 |
24.41 |
15.93 |
23.41 |
16.86 |
Distance to edge of nearest perennial river or stream |
-0.115 |
0 |
-0.192 |
0 |
29.69 |
21.28 |
31.98 |
16.64 |
33.33 |
15.27 |
36.97 |
17.84 |
Distance to nearest confluence between perennial or intermittent streams and large rivers |
- |
- |
-0.07 |
0.001 |
88.25 |
39.11 |
83.62 |
41.43 |
86.54 |
31.56 |
92.51 |
35.93 |
Distance to nearest intermittent stream |
- |
- |
0.023 |
0.071 |
58.96 |
21.8 |
52.74 |
19.03 |
42.85 |
19 |
50.63 |
25.77 |
Distance to nearest lake inlet/outlet |
- |
- |
-0.145 |
0 |
42.26 |
17.9 |
43.81 |
13.07 |
44.83 |
15.49 |
48.88 |
17.89 |
Distance to nearest lake, wetland, organic soil, or stream |
-0.269 |
0 |
-0.175 |
0 |
7.04 |
6.77 |
11.13 |
7.71 |
8.83 |
6.69 |
11.26 |
11.36 |
Distance to nearest permanent wetland inlet/outlet |
- |
- |
-0.161 |
0 |
72.16 |
27.24 |
75.71 |
28.08 |
87.56 |
36.88 |
86.48 |
30.4 |
Size of nearest lake |
0.313 |
0 |
- |
- |
5414.97 |
7395.34 |
956.86 |
2256.61 |
1417.04 |
3484.28 |
2888.3 |
5958.9 |
Vertical distance to permanent water |
-0.077 |
0.001 |
- |
- |
9.64 |
11.11 |
15.81 |
15.38 |
19.75 |
19.37 |
14.59 |
19.2 |
Distance to aspen-birch |
- |
- |
0.101 |
0.004 |
32.42 |
27.24 |
21.01 |
16.18 |
28.47 |
23.25 |
28.3 |
26.4 |
Distance to conifers |
0.026 |
0.741 |
- |
- |
13.12 |
17.61 |
12.97 |
13.45 |
9.45 |
13.71 |
13.38 |
18.46 |
Distance to hardwoods |
- |
- |
-0.115 |
0 |
49.19 |
27.63 |
51.26 |
33.35 |
56.67 |
28.4 |
61.74 |
34.88 |
Distance to oak woodland |
-0.209 |
0 |
-0.201 |
0 |
152.82 |
50.16 |
173.15 |
46.18 |
159.61 |
43.82 |
171.45 |
42.95 |
Distance to paper birch |
0.248 |
0 |
0.351 |
0 |
43.75 |
14.75 |
35.66 |
14.08 |
41.63 |
12.7 |
38.05 |
14.25 |
Distance to pine barrens or flats |
- |
- |
-0.341 |
0 |
42.97 |
31.76 |
48.38 |
28.56 |
42.69 |
34.12 |
56.5 |
34.5 |
Distance to prairie |
0.046 |
0 |
0.179 |
0 |
292.46 |
31.92 |
280.06 |
44.01 |
272.54 |
57.32 |
268.81 |
57.1 |
Distance to sugar maple |
- |
- |
0.146 |
0 |
59.23 |
20.2 |
58.43 |
20.97 |
59.99 |
19.47 |
56.54 |
20.74 |
Distance to edge of nearest area of organic soils |
- |
- |
-0.153 |
0 |
30.4 |
17.91 |
26.19 |
16.51 |
34.21 |
18.5 |
37.68 |
21.17 |
Distance to well-drained soils |
- |
- |
-0.143 |
0 |
6.38 |
11.34 |
9.55 |
14.61 |
6.6 |
12.78 |
10.29 |
15.64 |
Frequency counts |
513 |
1685 |
513 |
42 |
1133 |
2463 |
||||||
See Interpretation section for discussion of the statistics:
Coeff. = correlation coefficient
Sign. = significance of the Mann-Whitney U test
S.D. = standard deviation
Distances and areas are expressed in square
roots of meters. Square the values in the table to get actual values.
8.13.2.3.2 Relationships between Variable Pairs
Table 8.13.5 is a matrix of correlation coefficients between all variables used in the site model. Five coefficients have values of 0.5 or greater. Surface roughness (Figure 8.13.5.a) is highly correlated (0.60, 0.67) with elevation (Figure 8.13.8c), and height above surroundings (Figure 8.13.4.a) because it is an index comprised of elevation, slope, and relative elevation. Elevation and height above surroundings are also moderately associated with vertical distance to permanent water (Figures 8.13.4.b and 8.13.11d). This is a logical relationship, for as elevation and height above surroundings increase, vertical distance to permanent water also tends to increase. Taken together, these three variables define an environment along the margins of lakes, rivers, and streams characterized by relatively high locations of varied relief.
Two additional variables, distance to nearest large lake (Figure 8.13.9c) and size of nearest lake (Figure 8.13.11c), are somewhat redundant, as indicated by their high negative coefficient (–0.65). Obviously, distance to nearest large lake decreases as the size of the nearest lake increases. There is a clear preference for sites to be located near large lakes, with both proximity and lake size being important factors.
Table 8.13.5. Variable Correlation Matrix
Chippewa Plains |
Elevation |
Height above surroundings |
Surface roughness |
Direction to nearest water or wetland (sine) |
Distance to edge of nearest large lake |
Distance to edge of nearest large wetland |
Distance to edge of nearest perennial river or stream |
Distance to nearest lake, wetland, organic soil, or stream |
Elevation |
1 |
|||||||
Height above surroundings |
0.41 |
1 |
||||||
Surface roughness |
0.6 |
0.67 |
1 |
|||||
Direction to nearest water or wetland (sine) |
-0.25 |
-0.14 |
-0.16 |
1 |
||||
Distance to edge of nearest large lake |
-0.01 |
0 |
-0.12 |
-0.12 |
1 |
|||
Distance to edge of nearest large wetland |
0.08 |
0.15 |
0.26 |
-0.07 |
-0.24 |
1 |
||
Distance to edge of nearest perennial river or stream |
-0.1 |
-0.1 |
-0.08 |
0.11 |
-0.4 |
0.11 |
1 |
|
Distance to nearest lake, wetland, organic soil, or stream |
-0.2 |
-0.06 |
-0.2 |
0.04 |
0.18 |
0.03 |
0.13 |
1 |
Size of nearest lake |
-0.21 |
-0.1 |
-0.1 |
0.17 |
-0.65 |
0.15 |
0.46 |
0.06 |
Vertical distance to permanent water |
0.5 |
0.56 |
0.38 |
-0.31 |
0.2 |
0.07 |
-0.05 |
0.03 |
Distance to conifers |
-0.24 |
-0.01 |
-0.12 |
0.09 |
-0.19 |
0.03 |
0.33 |
0.13 |
Distance to oak woodland |
-0.16 |
-0.11 |
-0.1 |
0.05 |
0.09 |
-0.03 |
0.01 |
0.11 |
Distance to paper birch |
-0.18 |
-0.05 |
-0.11 |
-0.02 |
-0.1 |
0.02 |
0.24 |
0.13 |
Distance to prairie |
-0.45 |
-0.09 |
-0.28 |
0.06 |
0.18 |
-0.11 |
0.05 |
0.15 |
Size of nearest lake |
Vertical distance to permanent water |
Distance to conifers |
Distance to oak woodland |
Distance to paper birch |
Distance to prairie |
|||
Elevation |
||||||||
Height above surroundings |
||||||||
Surface roughness |
||||||||
Direction to nearest water or wetland (sine) |
||||||||
Distance to edge of nearest large lake |
||||||||
Distance to edge of nearest large wetland |
||||||||
Distance to edge of nearest perennial river or stream |
||||||||
Distance to nearest lake, wetland, organic soil, or stream |
||||||||
Size of nearest lake |
1 |
|||||||
Vertical distance to permanent water |
-0.24 |
1 |
||||||
Distance to conifers |
0.37 |
-0.18 |
1 |
|||||
Distance to oak woodland |
0.01 |
-0.15 |
0.06 |
1 |
||||
Distance to paper birch |
0.14 |
-0.15 |
0.21 |
-0.01 |
1 |
|||
Distance to prairie |
0.03 |
-0.13 |
0.11 |
0.66 |
0.03 |
1 |
Refer to "Relationships between variable pairs" for interpretation of the table values.
8.13.2.3.3 Sites in Low Probability Areas
Most sites in low probability areas have variable values closer to those for random points than for sites (Table 8.13.4). They are similar to all modeled sites only for the variables distance to nearest large wetland (298 vs. 256 meters, Figure 8.13.9d) and distance to conifers (168 vs. 172 meters, Figure 8.13.12b). For some variables, the values for random points are between those of all modeled sites and sites in low probability areas. This may indicate that such sites are not random , but are located for very different reasons than the majority of sites in the database. They are at higher elevations, but are not as high above their surroundings as all modeled sites. They are further from large lakes and closer to small ones. Their vertical distance to water is much greater. They are closer to aspen-birch, paper birch, and prairie, but further from oak woodland.
Of these 42 sites, one is a base camp, one is associated with wild rice harvesting, one is a mound, nine are mortuaries, four are earthworks other than mounds, 14 are artifact scatters, and 18 are lithic scatters. They include one Archaic site and eight with identifiable Woodland components. If the model predicted each site type equally well, 8.19 percent of each type should be found in low probability areas.
Earthworks and mounds approach this expectation (9.09 percent of all sites of this type in low probability areas). Lower proportions of base camps (4.54 percent) and artifact scatters (6.14 percent) are found in the low probability areas than expected by chance, implying the model does a relatively good job predicting such sites. Three types of sites are overrepresented: mortuary/cemetery sites (15.25 percent in low probability), lithic scatters (11.12 percent), and wild rice sites (33.33 percent). However, with only three known wild rice sites in the combined subsections, no conclusions should be drawn regarding how well they are predicted by the model.
8.13.2.3.4 Relationships between Cultural Context, Descriptive, or Settlement Variables and Site Potential
The results of four bivariate relationships between site potential and various archaeological variables are summarized in Table 8.13.6. Chi-square tests of these relationships are not significant at the 0.05 level. In other words, there are some differences in how well the model predicts different subpopulations of sites, but these differences are not statistically significant. Nevertheless, it is instructive to briefly examine them. Sites containing Archaic components are not as well predicted by the model as are sites without Archaic occupations . Considering the age of these sites and the amount of environmental change that has occurred since the Archaic period, however, they are predicted better than might be expected, with only 9.1 percent in the low probability area. Likewise, aceramic sites are not predicted as well as ceramic sites . This may be because some aceramic sites represent short term occupancy or older sites. Sites containing single occupations are also poorly predicted compared to sites with more than one component. Multi-component sites may represent longer-term occupancy. Mounds are somewhat more likely to occur in either high or low probability areas than non-mound sites. Mounds, overall, are very well predicted by this model, with 81.8 percent occurring in high probability areas.
Table 8.13.6. Summary of Bivariate Relationships between Four Dichotomous Archaeological Variables and Three Areas of Site Potential, Chippewa Plains (Site Probability Model)
Low Potential |
Medium Potential |
High Potential |
Total |
Chi-square Test |
|||||||
Dichotomous Variable |
N |
% |
N |
% |
N |
% |
N |
% |
value |
df |
p-value |
All Modeled Sites |
51 |
11.1 |
55 |
12.0 |
353 |
76.9 |
459 |
100.0 |
- |
- |
- |
Archaic |
1 |
9.1 |
3 |
27.3 |
7 |
63.6 |
11 |
100.0 |
1.04 |
2 |
0.59 |
Not Archaic |
7 |
6.4 |
18 |
16.4 |
85 |
77.3 |
110 |
100.0 |
|||
Aceramic |
1 |
7.7 |
4 |
30.8 |
8 |
61.5 |
13 |
100.0 |
1.94 |
2 |
0.38 |
Not Aceramic |
7 |
6.5 |
17 |
15.7 |
84 |
77.8 |
108 |
100.0 |
|||
Single Component |
6 |
7.5 |
17 |
21.3 |
57 |
71.3 |
80 |
100.0 |
3.06 |
2 |
0.22 |
Not Single Component |
2 |
4.9 |
4 |
9.8 |
35 |
85.4 |
41 |
100.0 |
|||
Mounds |
1 |
9.1 |
1 |
9.1 |
9 |
81.8 |
11 |
100.0 |
0.64 |
2 |
0.73 |
Not Mounds |
7 |
6.4 |
20 |
18.2 |
83 |
75.5 |
110 |
100.0 |
|||
8.13.3 Survey Probability Model
8.13.3.1 Description
The survey probability model for the Chippewa Plains illustrates the concentration of archaeological surveys within the outwash plain. The pattern of land most like that already surveyed is somewhat similar to the high and medium site potential zones, but covers a larger area (Figure 8.13.6). This pattern is clearly related to the locations of past surveys.
Several extended linear surveys are present in the subsection. The longest track extends east - northwest across the southern and northwestern portion of the subsection, parallel to State Highway 2. Short linear surveys are located within Buena Vista and Blackduck State Forests and on Leech Lake Indian Reservation. There is a frequency of four to seven negative survey points per km along these routes, and they represent more than half of all negative survey points in the subsection. Because of these surveys, the south-central, central, and northwestern portions of the study area have been well surveyed. However, the southeastern and northern areas have been much less extensively surveyed.
The kinds of landscapes surveyed are associated surface water features and, to a lesser extent, with terrain. Several narrow areas of high and medium survey potential are concentrated along streams in the north and northeastern parts of the Chippewa Plains subsection. They are associated both with stream valleys and with uneven terrain. Larger high and medium survey potential zones occupy smoother surfaces on the outwash plains, surrounding the large lakes. Many of the islands of low survey potential within the high potential zones coincide with wetlands.
Because the survey probability model is less dependent on terrain variables than the site probability model, artifacts from the elevation data, such as boundaries between quad sheets, are minor.
8.13.3.2 Evaluation
The survey probability model predicted surveyed places significantly better than by chance. The model is based on 22 variables (Table 8.13.7) representing topography, vegetation, soils, and hydrology. In this model, 84.28 percent of all sites and negative survey points are in high/medium survey potential areas, which make up 40.19 percent of the landscape. This produces a gain statistic of 0.52314 (Table 8.6.14).
This model for Chippewa Plains predicted surveyed places with less precision than the site probability model was able to predict sites, indicating that sites are confined to only a portion of the total area surveyed. The percentage of land classified as high/medium survey potential in the Chippewa Plains is about the average for the Phase 3 survey probability models and the gain statistic is average (Table 8.6.14). With 552 sites and 1133 negative survey points, the subsection has a survey frequency of 0.20 surveyed points per square km, which is somewhat higher than average. The site frequency is 0.065 known sites per square km, almost twice the statewide average. However, the model predicted surveyed places much better than by chance alone. This is undoubtedly a function of the geographic concentration of surveyed points in the south-central and northwest parts of the subsection.
Although the number of surveyed places is high in this subsection, the two preliminary survey probability models had only 71 percent agreement. The Kappa statistic for these models was 0.52964 (Table 8.6.14), slightly less than average. The conditional Kappa statistics (Table 8.13.9) are lowest for the medium site potential zone. Increasing the number of surveyed places for modeling may improve model stability, especially if new surveys are distributed throughout the undersurveyed areas.
Table 8.13.7. Survey Probability Model, Chippewa Plains Subsection
Intercept |
0.166 |
|
ln (nonsites/sites) |
0.379614555 |
|
Variable |
Regression Coefficient |
Probability |
Direction to nearest water or wetland |
-0.240161470 |
100 |
Distance to aspen-birch |
0.009473001 |
100 |
Distance to edge of nearest area of organic soils |
-0.008847215 |
97.1 |
Distance to edge of nearest large lake |
-0.020864692 |
100 |
Distance to edge of nearest large wetland |
0.014743509 |
100 |
Distance to edge of nearest perennial river or stream |
-0.027102722 |
100 |
Distance to hardwoods |
-0.007917234 |
100 |
Distance to nearest confluence between perennial or intermittent streams and large rivers |
-0.006885216 |
100 |
Distance to nearest intermittent stream |
-0.009253001 |
100 |
Distance to nearest lake inlet/outlet |
0.011021871 |
94.6 |
Distance to nearest lake, wetland, organic soil, or stream |
-0.043368025 |
100 |
Distance to nearest major ridge or divide |
-0.010283666 |
100 |
Distance to nearest minor ridge or divide |
-0.013544432 |
100 |
Distance to oak woodland |
-0.012642189 |
100 |
Distance to paper birch |
0.025577753 |
100 |
Distance to permanent wetland inlets/outlets |
0.009860096 |
100 |
Distance to pine barrens or flats |
0.004718759 |
68.5 |
Distance to prairie |
0.009829924 |
100 |
Distance to sugar maple |
0.016957333 |
100 |
Distance to well-drained soils |
-0.013302243 |
86.3 |
Height above surroundings |
0.035258010 |
85.0 |
Prevailing orientation |
-0.002871735 |
100 |
Table 8.13.8. Evaluation of Survey Probability Model, Chippewa Subsection
Region (30 meter cells) |
All random points |
All negative survey points |
All sites |
All sites and negative survey points |
||||||
# |
% |
# |
% |
# |
% |
# |
% |
# |
% |
|
Low |
4605655 |
49.13 |
1116 |
45.31 |
161 |
14.21 |
68 |
12.32 |
229 |
13.59 |
Medium |
1256058 |
13.40 |
383 |
15.55 |
141 |
12.44 |
48 |
8.70 |
189 |
11.22 |
High |
2510853 |
26.79 |
679 |
27.57 |
825 |
72.82 |
406 |
73.55 |
1231 |
73.06 |
Water |
1000898 |
10.68 |
285 |
11.57 |
6 |
0.53 |
30 |
5.43 |
36 |
2.14 |
Steep Slopes |
81 |
0.001 |
0 |
0 |
0 |
0 |
0 |
0 |
0 |
0 |
Mines |
0 |
0 |
0 |
0 |
0 |
0 |
0 |
0 |
0 |
0 |
Total |
9373545 |
100 |
2463 |
100 |
1133 |
100 |
552 |
100 |
1685 |
100 |
Table 8.13.9. Conditional Kappa Values for Survey Probability Model, Chippewa Plains Subsection
Class |
Ki |
Proportion Correct |
Low |
0.6456 |
0.8228 |
Medium |
0.2164 |
0.3731 |
High |
0.6301 |
0.7410 |
8.13.3.3 Interpretation
The survey probability model is composed of 22 variables (four topographic, nine hydrologic, seven vegetative, two landform or soils). These include all fourteen variables from the site probability model. Considering the large number of variables in the survey probability model, there are only three variables with correlation values greater than 0.3 (Table 8.13.4). These are distance to nearest large lake (Figure 8.13.9c), distance to paper birch (Figures 8.13.5.b and 8.13.13a), and distance to pine barrens or flats (Figure 8.13.13b).
It is apparent from these data that archaeologists have not surveyed randomly distributed points across the landscape. All values for the negative survey points fall between those for modeled sites and random points. Negative survey point values are most dissimilar from values for random points in that they are more oriented to western exposures (92 vs. 111 degrees) and are closer to pine barrens or flats (1822 vs. 3192 meters) and well-drained soils (44 vs. 106 meters, Figure 8.13.14b). They are closer to major (Figure 8.13.8a) and minor (Figure 8.13.8b) ridges or divides, to intermittent streams (Figure 8.13.10c), and to confluences between perennial or intermittent streams and large rivers (Figure 8.13.10b) than either modeled sites or random points. They are farther from large wetlands (Figure 8.13.9d), permanent wetland inlet/outlets (Figure 8.13.11b), and organic soils (Figure 8.13.14a) than are modeled sites. Compared to modeled sites, negative survey points are also closer to aspen-birch (Figure 8.13.12a) and farther from hardwoods (Figure 8.13.12c). Like sites, they are somewhat farther from sugar maple (Figure 8.13.13d) than are random points. Finally, negative survey points are intermediate in value for distance to nearest lake inlet/outlet (Figure 8.13.10d).
The results of the Mann-Whitney U test indicate that all variables used in the survey model, except distance to nearest intermittent stream, are significant at the 0.05 level (Table 8.13.4). This means that survey and random points are drawn from different populations, reinforcing the fact that the archaeological surveys upon which the model is based were conducted in a non-random fashion.
8.13.4 Survey Implementation Model
The survey implementation model for the Chippewa Plains indicates that 43.25 percent of the land area is categorized as unknown because of inadequate survey (Table 8.13.10 and Figure 8.13.7). These areas are primarily in the northern and southeastern portions of the subsection.
High probability areas are concentrated strongly around water bodies in the central and southern portion of the subsection. These include areas of suspected and possibly high probability in places not typical of those previously surveyed. Low and possibly low probability areas occupy 19.28 percent of the landscape and are typically found away from large water bodies.
Since approximately 28 percent of the subsection is occupied by wetlands, one might expect the undersurveyed areas to have a higher proportion of wetlands than the kinds of areas that have been surveyed. The opposite is the case. About 30.5 percent of the unknown area is wetland, compared to 40.4 percent of the low probability, 38 percent of the medium probability, and 34 percent of the high probability areas. The suspected high probability area (high probability for sites, but unlike the kinds of areas that have been well surveyed) has the lowest proportion of wetlands, at 20 percent. Thus, ease of surveying should not be an obstacle to improving knowledge of this region by further surveys in the unknown area. However, only 16 test sites (10 percent) were from the unknown area.
Table 8.13.10. Evaluation of Survey Implementation Model, Chippewa Plains Subsection
Region (30 meter cells) |
Random Points |
Negative Survey Points |
Single Artifacts |
Sites |
||||||
# |
% |
# |
% |
# |
% |
# |
% |
# |
% |
|
Unknown |
4053988 |
43.25 |
973 |
39.5 |
146 |
12.89 |
2 |
5.13 |
21 |
4.09 |
Possibly Low |
852343 |
9.09 |
273 |
11.08 |
113 |
9.97 |
1 |
2.56 |
9 |
1.75 |
Low |
955558 |
10.19 |
241 |
9.78 |
371 |
32.74 |
5 |
12.82 |
12 |
2.34 |
Suspected Medium |
376211 |
4.01 |
101 |
4.1 |
10 |
0.88 |
1 |
2.56 |
14 |
2.73 |
Possibly Medium |
245540 |
2.62 |
70 |
2.84 |
20 |
1.77 |
1 |
2.56 |
12 |
2.34 |
Medium |
633112 |
6.75 |
170 |
6.9 |
214 |
18.89 |
4 |
10.26 |
43 |
8.38 |
Suspected High |
175456 |
1.87 |
42 |
1.71 |
5 |
0.44 |
1 |
2.56 |
29 |
5.65 |
Possibly High |
158175 |
1.69 |
40 |
1.62 |
8 |
0.71 |
2 |
5.13 |
23 |
4.48 |
High |
922183 |
9.84 |
268 |
10.88 |
240 |
21.18 |
22 |
56.41 |
320 |
62.38 |
Water |
1000898 |
10.68 |
285 |
11.57 |
6 |
0.53 |
0 |
0 |
30 |
5.85 |
Steep Slopes |
81 |
0.001 |
0 |
0 |
0 |
0 |
0 |
0 |
0 |
0 |
Mines |
0 |
0 |
0 |
0 |
0 |
0 |
0 |
0 |
0 |
0 |
Total |
9373545 |
100 |
2463 |
100 |
1133 |
100 |
39 |
100 |
513 |
100 |
River valley floors and terraces in the Chippewa Plains subsection have the potential to contain deeply buried archaeological sites. Mn/Model landscape suitability models were created for the Mississippi River Valley through this subsection (Section 12.4). In addition, the Bemidji West and Bemidji East quadrangles have been mapped and modeled (Section 12.12). Most of their area is within the Chippewa Plains. A very small fraction of the Red Lake Bog model (Section 12.6) is within the northwestern edge of this subsection. These models should be consulted for information regarding the geomorphic potential for both surface and subsurface archaeological sites.
8.14 Coteau Moraines / Inner Coteau
8.15 Glacial Lake Superior Plain/Northshore Highlands/ Nashwauk
Uplands
8.16 Hardwood Hills
8.17 Laurentian Highlands
8.18 Littlefork-Vermilion Uplands
8.19 Mille Lacs Uplands
8.20 Minnesota River Prairie
8.21 Oak Savanna
8.22 Pine Moraines & Outwash Plains
8.23 Red River Prairie
8.24 Rochester Plateau
8.25 St. Croix Moraines and Outwash Plains (Twin Cities Highlands)
8.26 St. Louis Moraines/ Tamarack Lowlands
8.27 Conclusion
References
The Mn/Model Final Report (Phases 1-3) is available on CD-ROM. Copies may be requested by visiting the contact page.

Acknowledgements
MnModel was financed with Transportation Enhancement and State Planning and Research funds from the Federal Highway Administration and a Minnesota Department of Transportation match.
Copyright Notice
The MnModel process and the predictive models it produced are copyrighted by the Minnesota Department of Transportation (MnDOT), 2000. They may not be used without MnDOT's consent.