Quick Links
Chapters
- Management Summary
- Research Design & Time Line
- Environment & Native American Culture
- GIS Design
- Archaeological Database
- Archaeological & Environmental Variables
- Model Development & Evaluation
- Model Results & Interpretation
- Project Applications
- Model Enhancements
- Model Implementation
- Landscape Suitability Models
- Summary & Recommendations
Appendices
- Archaeological Predictive Modeling: An Overview
- GIS Standards & Procedures
- Archaeology Field Survey Standards, Procedures & Rationale
- Archaeology Field Survey Results
- Geomorphology Survey Profiles, Sections, & Lists
- Building a Macrophysical Climate Model for the State of Minnesota
- Correspondence of Support for Mn/Model
- Glossary
- List of Figures
- List of Tables
- Acknowledgments
8.10 Big Woods Subsection of Minnesota & NE Iowa Morainal Section
8.10.1 Environmental Context
8.10.2
Site Probability Model
8.10.3 Survey Probability Model
8.10.4 Survey Implementation Model
8.10.5 Other Models
This regional model report is organized as described in Sections 8.2.1 through 8.4.1. Refer to these sections of the report for explanations of the tables, variables, and statistics.
Big Woods is a subsection of the Minnesota and Northeastern Iowa Morainal Section of the Eastern Broadleaf Forest Province (Figure 8.1) (Minnesota DNR 1998). It is dominated by one definable landform, a loamy mantled end moraine associated with the Des Moines Lobe of Late Wisconsin Glaciation, and one historic vegetation community, the Big Woods, a mesic deciduous forest.
To the northeast, the end moraine contacts outwash sediments on the Anoka Sand Plain (Figure 8.10.2.a). The Big Woods vegetation (Figure 8.10.1.b) ended at this location, with oak barrens and aspen/oak communities on the outwash plains. At the southeast boundary the end moraine within the Big Woods subsection meets a ground moraine in the adjacent subsection. This boundary marks the southern extent of the deciduous forest and a transition to prairie and oak barrens. The subsection boundary roughly corresponds to the transition of deciduous forest to prairie.
The area is characterized by rolling terrain and scattered lakes of varying sizes. The Minnesota River flows southwest to northeast through the center and divides the subsection approximately in half (Figure 8.10.1.a). Climate, topography, water bodies, and loamy soils (Figure 8.10.2.b) combine to form the basis for a mesic deciduous forest community now known as the Big Woods.
In the 19th century, vegetation was primarily Big Woods (Figure 8.10.1.b) (sugar maple, basswood, and elm), which requires protection from fire to become established. The area’s rolling terrain and lakes provided this protection. Wet prairies were interspersed with forest throughout the landscape. Areas of oak openings and barrens were located north and south of the Minnesota River and along the eastern boundary of the subsection in Hennepin and Dakota Counties. A separate area of oak barrens was recorded in north central Waseca County at the southern boundary of the subsection. Aspen-oak woodland occurred in Scott, northern Rice, Meeker, and western Wright counties. Prairie was limited to a narrow band along the south side of the Minnesota River in Scott County, and to small patches in Sibley, Le Sueur, and Blue Earth counties. River bottom forest was recorded adjacent to the Minnesota River and to limited sections of the North and South Fork of the Crow Wing River.
8.10.2.1 Description
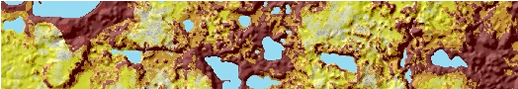
The site probability model (Figure 8.10.3) contains areas of high and medium site potential concentrated along the region’s streams and lakes. There are two major water features in this subsection, the Minnesota River and Lake Minnetonka.
An area of high site potential clearly delineates the Minnesota River in the center of the region. The zone of high site potential along the river coincides primarily with alluvium and to a lesser degree with terrace landforms. At least eight tributaries of the Minnesota River have high or medium site potential. These tributaries include Carver, Silver, and Bevens Creeks in Carver County; Sand Creek and Credit River in Scott County; Buffalo Creek and Rush River in Sibley County; and Forest Prairie and Cherry Creeks in Le Sueur County. The North Fork of the Crow River in southeastern Wright County is clearly outlined as an area of high site potential.
Extensive areas of high and medium site potential are found around Lake Minnetonka in southwestern Hennepin County. This area encompasses Lake Minnetonka and nearby lakes (e.g. Lake Waconia). High site potential also surrounds the lakes and wetlands in north central Hennepin County. There is another zone of high site potential centered on Pelican Lake northeast of Buffalo in Wright County.
In the southern portion of the Big Woods subsection, high and medium site potential zones surround a series of lakes extending from the Minnesota River near Mankato northeasterly through Blue Earth (Eagle Lake, Madison Lake), northwestern Waseca (Lake Elysian), southern Le Sueur (Lake Washington, Lake Jefferson, and Tetonka Lake), and western Rice (Shields Lake and Dora Lake) counties. There are slight aberrations, in the form of north-south trending stripes, in the pattern of site potential in the southern portion of the subsection. These aberrations are particularly conspicuous along the transition edges from high to medium and medium to low site potential. These lines are artifacts of banded digital elevation data (Section 4.5.1.3) and should not be considered predictive features.
8.10.2.2 Evaluation
The site probability model performed well. It is based on 16 variables (Table 8.10.1) representing topography, vegetation, and hydrology.
Table 8.10.1. Site Probability Model, Big Woods Subsection.
Intercept |
7.977 |
|
ln (nonsites/sites) |
0.968588231 |
|
Variable |
Regression Coefficient |
Probability |
Distance to conifers |
0.01060460 |
100.0 |
Distance to edge of nearest large wetland |
-0.01442645 |
100.0 |
Distance to edge of nearest large lake |
-0.02549698 |
100.0 |
Distance to edge of nearest perennial river or stream |
-0.01535520 |
90.9 |
Distance to nearest lake inlet/outlet |
-0.01435861 |
70.7 |
Distance to nearest permanent lake inlet/outlet |
0.01041905 |
42.5 |
Distance to oak woodland |
-0.008558970 |
99.1 |
Distance to prairie |
0.009153079 |
88.3 |
Distance to sugar maple |
-0.01408731 |
85.8 |
Height above surroundings |
0.03988452 |
100.0 |
Relative elevation |
0.02443549 |
76 |
Size of major watershed |
-0.0006577646 |
55.6 |
Size of nearest permanent lake |
0.0002589899 |
98.2 |
Slope |
0.2126660 |
100.0 |
Surface roughness |
-0.06404094 |
100.0 |
Vertical distance to water |
0.008692292 |
98.3 |
In this model, 86.18 percent of all modeled sites (Table 8.10.2) are in high/medium site potential areas, which make up only 33.93 percent of the landscape. This produces a good gain statistic of 0.60629 (Table 8.6.11). The model did not test as well, however. Only 76.81 percent of new sites were predicted, producing a test gain statistic of 0.55826.
Table 8.10.2. Evaluation of Site Probability Model, Big Woods Subsection.
Region (30 meter cells) |
Random Points |
Negative Survey Points |
Modeled Sites |
Test Sites |
||||||
# |
% |
# |
% |
# |
% |
# |
% |
# |
% |
|
Low |
5622033 |
63.02 |
1028 |
61.26 |
614 |
47.56 |
83 |
13.03 |
16 |
23.19 |
Medium |
1297290 |
14.54 |
251 |
14.96 |
255 |
19.75 |
108 |
16.95 |
12 |
17.39 |
High |
1729419 |
19.39 |
342 |
20.38 |
419 |
32.46 |
441 |
69.23 |
41 |
59.42 |
Water |
262545 |
2.94 |
54 |
3.22 |
3 |
0.23 |
2 |
0.31 |
0 |
0 |
Steep Slopes |
9169 |
0.10 |
3 |
0.18 |
0 |
0 |
3 |
0.47 |
0 |
0 |
Mines |
0 |
0 |
0 |
0 |
0 |
0 |
0 |
0 |
0 |
0 |
Total |
8920456 |
100 |
1678 |
100 |
1291 |
100 |
637 |
100 |
69 |
100 |
The database included 637 sites that were not single artifacts. This is nearly twice the average number of sites for an average Phase 3 region (Table 8.6.11). Two preliminary models using different halves of the known sites had only 70 percent agreement (70 percent of the cells in the subsection were classified the same in both models). The Kappa statistic, which is adjusted for the amount of agreement expected by chance alone for these models, was 0.47874 (Table 8.6.11). The conditional Kappa statistics (Table 8.10.3) are lowest for the medium site potential zone. Biased survey distributions (Section 8.10.4) may contribute to the instability of the site probability model.
Table 8.10.3. Conditional Kappa Values for Site Probability Model, Big Woods Subsection
Class |
Ki |
Proportion Correct |
Low |
0.6479 |
0.8592 |
Medium |
0.1263 |
0.2573 |
High |
0.5999 |
0.6999 |
8.10.2.3 Interpretation
There are 16 variables involved in the Big Woods subsection site probability model, seven that are hydrologic in nature. The remaining variables are divided between topographic (3), vegetation (4), and soils/landforms (2) categories.
8.10.2.3.1 Differences between Modeled Sites and Random Points for Individual Model Variables
Only two variables have moderate correlation coefficients (Table 8.10.4) with probability values for modeled sites- slope (Figure 8.10.4.b) and vertical distance to water (Figures 8.10.6.b). The differences in means between the modeled sites and random points for these variables is pronounced, with sites on more sloping ground and higher above water (3.3 degrees and 26.9 feet) compared to random points (2.0 degrees and 15.5 feet, Figures 8.10.9d and 8.10.12d). Three additional variables have sizable differences in means when modeled sites are compared to random points. These are distance to nearest large lake (1301 vs. 2324 meters), distance to hardwoods (59 vs. 111 meters, Figure 8.10.13c), and size of nearest permanent lake (938 vs. 510 acres, Figure 8.10.12c).
The Mann-Whitney U tests indicate that of the 16 variables in the model, 11 have values at the 0.05 level of significance (Table 8.10.4). This means that sites and random points are situated in different environmental zones, different enough to consider them as being drawn from different populations.
Generally, sites are closer to a variety of hydrologic features than are random points. Variables supporting this conclusion include distance to nearest large lake (Figure 8.10.10d), distance to nearest large wetland (Figure 8.10.10c), distance to nearest perennial river or stream (Figure 8.10.11a), distance to nearest lake inlet/outlet (Figure 8.10.11c), distance to nearest permanent lake inlet/outlet (Figure 8.10.12a). Clearly large, permanent water features are also associated with sites. However, why sites tend to be in smaller watersheds is unclear (Figure 8.10.9c).
Terrain is important, perhaps especially in combination with proximity to water. While low floodplains may be less habitable or less likely to preserve surface sites in situ, more steeping sloping ground, further above water may contain better records of prehistoric habitation. This observation is supported by the additional model variables height above surroundings (Figure 8.10.9a), relative elevation (Figure 8.10.9b), and surface roughness (Figure 8.10.10a).
Sites in the subsection are closer to hardwoods (Figure 8.10.13c), sugar maple (Figure 8.10.14b), oak woodland (Figure 8.10.14c), and prairie (Figure 8.10.13d) than are random points. However, there is little distinction between the locations of modeled sites and random points for distance to conifers (Figure 8.10.13b). Its contribution to the model must be in conjunction with other variables. Surprisingly, vegetation diversity does not enter into this model, despite the large number of vegetation variables.
Table 8.10.4. Model Variable Statistics.
Big Woods |
Modeled Sites |
Surveyed Areas |
Modeled Sites |
Sites in Low Prob. |
Neg. Survey Points |
Random Points |
||||||
Model Variable |
Coeff. |
Sign. |
Coeff. |
Sign. |
Mean |
S.D. |
Mean |
S.D. |
Mean |
S.D. |
Mean |
S.D. |
Height above surroundings |
- |
- |
0.412 |
0 |
18.16 |
16.72 |
7.71 |
6.05 |
10.69 |
9.5 |
9.29 |
10.2 |
Relative elevation |
- |
- |
0.359 |
0 |
22.31 |
17.25 |
11.59 |
6.66 |
14.76 |
10.14 |
13.33 |
11.31 |
Size of major watershed |
0.016 |
0.075 |
0.063 |
0.748 |
1468.73 |
366.92 |
1490.85 |
327.6 |
1525.86 |
325.77 |
1516.2 |
334.11 |
Slope |
0.423 |
0 |
- |
- |
3.33 |
3.14 |
1.67 |
1.23 |
2.23 |
1.86 |
1.98 |
2.09 |
Surface roughness |
0.243 |
0.018 |
-0.067 |
0 |
161.75 |
17.29 |
158.65 |
9.82 |
157.08 |
12.91 |
160.4 |
13.94 |
Direction to nearest water or wetland (sine) |
-0.117 |
0.005 |
- |
- |
0.16 |
0.74 |
0.33 |
0.73 |
0.14 |
0.73 |
0.23 |
0.75 |
Distance to edge of nearest large wetland |
- |
- |
-0.12 |
0 |
35.45 |
19.91 |
41.09 |
24.35 |
39.21 |
19.67 |
40.85 |
19.55 |
Distance to edge of nearest large lake |
-0.292 |
0 |
- |
- |
36.07 |
30.12 |
54.16 |
27.11 |
44.84 |
23.48 |
48.21 |
27.34 |
Distance to edge of nearest perennial river or stream |
- |
- |
-0.242 |
0 |
35.84 |
21.23 |
44.3 |
22.32 |
37.63 |
19.9 |
42.53 |
20.46 |
Distance to nearest permanent wetland inlet/outlet |
-0.142 |
0 |
- |
- |
195.44 |
61.73 |
210.74 |
57.07 |
185.69 |
56.91 |
206.26 |
52.2 |
Distance to nearest lake inlet/outlet |
-0.27 |
0 |
-0.25 |
0 |
38.39 |
15.61 |
49.26 |
18.11 |
42.34 |
18.06 |
46.16 |
17.14 |
Distance to nearest lake, wetland, organic soil, or stream |
- |
- |
-0.227 |
0 |
7.97 |
5.53 |
9.17 |
6.21 |
7.75 |
5.74 |
9.28 |
6.89 |
Distance to nearest permanent lake inlet/outlet |
-0.187 |
0 |
- |
- |
56.58 |
24.33 |
67.54 |
22.43 |
58.3 |
24.7 |
65.02 |
23.75 |
Size of nearest lake |
- |
- |
0.067 |
0.094 |
846.25 |
1095.65 |
273.1 |
340.16 |
438.39 |
687.09 |
491.45 |
751.56 |
Size of nearest permanent lake |
0.26 |
0 |
- |
- |
938.17 |
1205.99 |
295.89 |
366.89 |
487.73 |
786.35 |
510.52 |
786.15 |
Vertical distance to water |
0.422 |
0 |
0.238 |
0 |
26.92 |
34.07 |
13.24 |
22.02 |
17.09 |
24.7 |
15.54 |
23.7 |
Distance to aspen-birch |
- |
- |
-0.228 |
0 |
324.58 |
53.77 |
319.01 |
57.94 |
305.11 |
45.62 |
325.45 |
52.56 |
Distance to conifers |
- |
- |
-0.269 |
0 |
288.76 |
49.75 |
284.43 |
52.18 |
271.61 |
42.97 |
288.82 |
45.9 |
Distance to hardwoods |
-0.042 |
0.084 |
- |
- |
7.68 |
13.71 |
9.29 |
16.37 |
9.97 |
16.18 |
10.55 |
18.78 |
Distance to prairie |
-0.059 |
0.211 |
0.097 |
0.103 |
84.97 |
41.8 |
76.14 |
39.39 |
85.57 |
40.01 |
83.66 |
37.58 |
Distance to river bottom forest |
- |
- |
-0.071 |
0 |
94.93 |
52.95 |
102.87 |
49.62 |
96.49 |
41.02 |
105.72 |
46.64 |
Distance to sugar maple |
-0.067 |
0 |
-0.066 |
0.015 |
35.35 |
14.5 |
40.55 |
16.26 |
38.19 |
16.46 |
40.29 |
20.88 |
Distance to oak woodland |
-0.111 |
0.074 |
-0.181 |
0 |
73.98 |
41.45 |
70.49 |
36.25 |
68.84 |
45.48 |
76.88 |
43.06 |
On alluvium |
0.169 |
0 |
0.049 |
0.08 |
0.06 |
0.25 |
0 |
0 |
0.02 |
0.14 |
0.02 |
0.15 |
On river terraces |
0.036 |
0.171 |
-0.015 |
0.864 |
0.05 |
0.22 |
0.04 |
0.19 |
0.03 |
0.18 |
0.04 |
0.19 |
Frequency counts |
637 |
1993 |
637 |
83 |
1291 |
1678 |
||||||
See Interpretation section for explanation of the statistics:
Coeff. = correlation coefficient
Sign. = significance of the Mann-Whitney U test
S.D. = standard deviation
Distances and areas
are expressed in square roots of meters. Square the values in the table to get
actual values.
8.10.2.3.2 Relationships between Variable Pairs
Table 8.10.5, which is a correlation matrix of all possible combinations of variables used in the site model, is useful in exploring the interrelationships between variables. For example, distance to prairie and distance to oak woodland have a high coefficient of 0.71, indicating that as distance to prairie increases (or decreases), it also increases (or decreases) to oak woodlands. Prairie is the least prevalent vegetation community in this subsection. Where it is found, it is usually adjacent to oak woodland or aspen-oak woodland. The primary relationships between these communities is their tolerance to fire. This sets them apart from the dominant Big Woods vegetation in both composition and distribution within the landscape. Distance to the nearest large lake has a high negative correlation (-0.68) with size of permanent lake which means that as lake size increases, distance decreases, or vice versa. In other words, sites in the Big Woods tend to be concentrated around large lakes. Distance to nearest permanent wetland inlet/outlet is also inversely related to size of major watershed (-0.74). This makes sense since larger watersheds in the subsection (i.e. Minnesota River) also have a more developed drainage system composed of a more dense system of stream-drained wetlands. Finally, the moderate positive correlation between slope and surface roughness (0.57) (Figure 8.10.5.a) is due to the fact that surface roughness is a derivative of topographic variables (elevation, slope, and relative elevation).
Table 8.10.5. Variable Correlation Matrix.
Big Woods |
Size of major watershed |
Slope |
Surface roughness |
Direction to nearest water or wetland (sine) |
Distance to edge of nearest large lake |
Distance to nearest permanent wetland inlet/outlet |
Distance to nearest lake inlet/outlet |
Distance to nearest permanent lake inlet/outlet |
Size of nearest permanent lake |
Size of major watershed |
1 |
||||||||
Slope |
0.09 |
1 |
|||||||
Surface roughness |
-0.25 |
0.57 |
1 |
||||||
Direction to nearest water or wetland (sine) |
-0.04 |
-0.12 |
-0.1 |
1 |
|||||
Distance to edge of nearest large lake |
0.1 |
0.04 |
-0.22 |
-0.02 |
1 |
||||
Distance to nearest permanent wetland inlet/outlet |
-0.74 |
-0.06 |
0.31 |
0 |
0.06 |
1 |
|||
Distance to nearest lake inlet/outlet |
-0.01 |
-0.06 |
0.03 |
0 |
0.13 |
0.06 |
1 |
||
Distance to nearest permanent lake inlet/outlet |
-0.24 |
-0.11 |
0.23 |
0 |
0.04 |
0.36 |
0.44 |
1 |
|
Size of nearest permanent lake |
-0.11 |
-0.09 |
0.23 |
-0.01 |
-0.68 |
0.11 |
0.02 |
0.14 |
1 |
Vertical distance to water |
0.03 |
0.29 |
0.35 |
-0.26 |
0.07 |
-0.02 |
-0.04 |
-0.06 |
0.06 |
Distance to hardwoods |
0.14 |
-0.11 |
-0.2 |
0.04 |
0.04 |
-0.18 |
-0.05 |
-0.09 |
0 |
Distance to prairie |
-0.17 |
-0.05 |
0.22 |
0.02 |
-0.41 |
-0.04 |
-0.03 |
-0.02 |
0.24 |
Distance to sugar maple |
0.06 |
-0.06 |
-0.18 |
0 |
0.11 |
-0.08 |
-0.08 |
0.01 |
-0.06 |
Distance to oak woodland |
-0.42 |
-0.05 |
0.29 |
0.01 |
-0.27 |
0.41 |
-0.01 |
0.05 |
0.22 |
On alluvium |
0.13 |
0.01 |
-0.24 |
0.03 |
0.3 |
-0.08 |
0.02 |
-0.06 |
-0.16 |
On river terraces |
0.16 |
0.08 |
-0.21 |
-0.06 |
0.29 |
-0.06 |
0.02 |
-0.02 |
-0.21 |
Vertical distance to water |
Distance to hardwoods |
Distance to prairie |
Distance to sugar maple |
Distance to oak woodland |
On alluvium |
On river terraces |
|||
Size of major watershed |
|||||||||
Slope |
|||||||||
Surface roughness |
|||||||||
Direction to nearest water or wetland (sine) |
|||||||||
Distance to edge of nearest large lake |
|||||||||
Distance to nearest permanent wetland inlet/outlet |
|||||||||
Distance to nearest lake inlet/outlet |
|||||||||
Distance to nearest permanent lake inlet/outlet |
|||||||||
Size of nearest permanent lake |
|||||||||
Vertical distance to water |
1 |
||||||||
Distance to hardwoods |
-0.1 |
1 |
|||||||
Distance to prairie |
-0.05 |
-0.23 |
1 |
||||||
Distance to sugar maple |
-0.07 |
0.38 |
-0.28 |
1 |
|||||
Distance to oak woodland |
0.01 |
-0.37 |
0.71 |
-0.22 |
1 |
||||
On alluvium |
0.04 |
0.13 |
-0.35 |
0.12 |
-0.2 |
1 |
|||
On river terraces |
0.06 |
0.04 |
-0.3 |
0.11 |
-0.16 |
-0.06 |
1 |
Refer to "Relationships between variable pairs" for interpretation of the table values.
8.10.2.3.3 Sites in Low Probability Areas
The site model for this subsection places sites located in low probability areas in environments most similar to what is expected by random chance. Of the 16 variables, the mean values of sites in low potential areas are nearest random points on 12, including slope (1.7 vs. 2.0 degrees), vertical distance to water (13.2 vs. 15.4 feet), distance to nearest large lake (2933 vs. 2324 meters), and size of nearest permanent lake (296 vs. 510 acres). On two of the variables, size of major watershed and distance to hardwoods, the sites in low potential areas are between the random points and modeled site means.
Of these 83 sites, 50 are lithic scatters and another 15 are artifact scatters. If all site types are equally well predicted by the model, 13.03 percent of each site type should be in the low probability areas. Artifact scatters approach this proportion, with 11.19 percent of all artifact scatters in low probability areas. Earthworks/mounds are underrepresented in low probability areas (only 6.81 percent). Lithic scatters (17.36 percent), base camps (28.57 percent) and burial locations (37.5 percent) are underrepresented, indicating that the model does a relatively poor job predicting such sites.
8.10.2.3.4 Relationships between Cultural Context, Descriptive, or Settlement Variables and Site Potential
Table 8.10.6 presents the results of four bivariate relationships comparing four dichotomous variables with three areas of site potential. Percentages and frequencies of all sites are also included as a comparative baseline. Referring to the table, it is apparent that sites containing Archaic components are over represented in the low and medium site potential areas compared to those lacking Archaic components (31.3 percent and 25.0 percent vs. 7.4 percent and 14.1 percent). The results of the chi-square test indicate that this relationship is significant at the 0.05 level, meaning it deviates from that expected by chance or independence. However, the small sample of Archaic sites (16) makes this conclusion tentative. Aceramic sites also occur more frequently in the low and medium site potential areas compared to those containing pottery (17.7 percent and 19.9 percent vs. 7.5 percent and 15.5 percent). Although pre-Woodland sites may account for a portion of this relationship, it may be more likely that the aceramic sites are dominated by short-term activities (e.g. lithic scatters) of all periods. There is also a tendency for multiple component sites to be in low and medium site potential areas compared to sites with single components (28.6 percent and 28.6 percent vs. 7.7 percent and 14.0 percent). Once again, the low number of multiple component sites indicates that this relationship is tentative in nature. There is no significant difference in the distribution of mound and non-mound sites.
Table 8.10.6. Summary of Bivariate Relationships between Four Dichotomous Archaeological Variables and Three Areas of Site Potential, Big Woods (Site Probability Model).
Low Potential |
Medium Potential |
High Potential |
Total |
Chi-square Test |
|||||||
Dichotomous Variable |
N |
% |
N |
% |
N |
% |
N |
% |
value |
df |
p-value |
All Modeled Sites |
83 |
13.1 |
108 |
17.1 |
441 |
69.8 |
632 |
100.0 |
- |
- |
- |
Archaic |
5 |
31.3 |
4 |
25.0 |
7 |
43.8 |
16 |
100.0 |
13.57 |
2 |
0.00 |
Not Archaic |
21 |
7.4 |
40 |
14.1 |
223 |
78.5 |
284 |
100.0 |
|||
Aceramic |
62 |
17.7 |
70 |
19.9 |
219 |
62.4 |
351 |
62.4 |
22.28 |
2 |
0.00 |
Not Aceramic |
21 |
7.5 |
38 |
13.5 |
222 |
79.0 |
281 |
100.0 |
|||
Single Component |
22 |
7.7 |
40 |
14.0 |
224 |
78.3 |
286 |
100.0 |
10.84 |
2 |
0.00 |
Not Single Component |
4 |
28.6 |
4 |
28.6 |
6 |
42.9 |
14 |
100.0 |
|||
Mounds |
2 |
10.5 |
1 |
5.3 |
16 |
84.2 |
19 |
100.0 |
2.29 |
2 |
0.32 |
Not Mounds |
81 |
13.2 |
107 |
17.5 |
425 |
69.3 |
613 |
100.0 |
|||
8.10.3 Survey Probability Model
8.10.3.1 Description
The survey probability model for the Big Woods (Figure 8.10.7) indicates that surveys have been concentrated in Carver, Hennepin, and eastern Wright Counties. More than 75 percent of the surveys have occurred in these counties, which make up approximately half the area of the subsection. Many surveys in these three counties are randomly distributed along highways with a frequency of 2-3 surveys per 1 linear km. Some linear surveys follow streams or are concentrated near lakes. Significant random element and frequent surveys distribution in this part of Big Wood subsection were sufficiently effective to classify most of the area as high and medium potential zones.
Outside of these areas, surveys are have been adjacent to the Minnesota River and other bodies of water. Only short linear surveys, for example, along the State Highway 22 between Le Sueur and Blue Earth counties are recorded. The areas of high and medium survey potential follow many of the same water features as in the site model. In the south half of the subsection the survey model displays a characteristic pattern of high and medium survey potential zones around water features. Specifically, these zones are located north from Mankato along the Minnesota River, along the southern subsection border around Elysian Lake and Cannon Lakes, and in lighter concentrations in Rice county around its many lakes (i.e. Fox, Union).
Major portions of Blue Earth, Le Sueur, and Scott counties remain undersurveyed. The average frequency of surveys in Carver county is 0.48 surveys per 1 sq. km, while in Le Sueur county it is only 0.078.
There are similar aberrations in the survey model as are seen in the site model. These north-south trending stripes in the pattern of survey potential in the southern portion of the subsection are artifacts of banded digital elevation data (Section 4.5.1.3) and should not be considered predictive features.
8.10.3.2 Evaluation
The survey probability model predicted surveyed places somewhat better than by chance. The model is based on 18 (Table 8.10.7) variables representing topography, vegetation, soils, and hydrology.
Table 8.10.7. Survey Probability Model, Big Woods Subsection.
Intercept |
11.126 |
|
ln (non-surveys/surveys) |
-0.172038433 |
|
Variable |
Regression coefficient |
Probability |
Direction to nearest water or wetland |
-0.2019509 |
98.6 |
Distance to aspen-birch |
-0.05157924 |
100.0 |
Distance to conifers |
0.06098696 |
100.0 |
Distance to edge of nearest large lake |
-0.01039689 |
100.0 |
Distance to hardwoods |
-0.008218669 |
54.7 |
Distance to nearest lake, wetland, organic soil, or stream |
-0.03526605 |
100.0 |
Distance to oak woodland |
-0.01164490 |
100.0 |
Distance to permanent wetland inlets/outlets |
-0.01104074 |
100.0 |
Distance to river bottom forest |
0.006588783 |
98.5 |
Height above surroundings |
0.03420501 |
100.0 |
On alluvium |
-1.0395275 |
76.5 |
On river terraces |
-0.7417907 |
64.3 |
Size of major watershed |
-0.0009042905 |
100.0 |
Size of nearest lake |
-0.0007126363 |
100.0 |
Size of nearest permanent lake |
0.0007342172 |
100.0 |
Slope |
0.1873997 |
100.0 |
Surface roughness |
-0.05245476 |
100.0 |
Vertical distance to water |
0.007903697 |
100.0 |
In this model, 84.7 percent of all sites and negative survey points (Table 8.10.8) are in high/medium survey potential areas, which make up 53.32 percent of landscape (Table 8.10.8). This produces a very weak gain statistic of 0.37048 (Table 8.6.14), which is acceptable for a survey probability model. This model was able to predict surveyed places with much less precision than the site probability model was able to predict sites, indicating that sites are confined to only a portion of the total area surveyed. However, the model predicted surveyed places better than by chance. Although frequencies of 0.25 surveyed points per square km (Table 8.6.14) and 0.087 known sites per square km (Table 8.6.11) are rather high for Minnesota, this model illustrates the non-random pattern of previous surveys. Further surveys in the southern and northwestern portions of the subsection should improve this.
Table 8.10.8. Evaluation of Survey Probability Model, Big Woods Subsection.
Region (30 meter cells) |
All random points |
All negative survey points |
All sites |
All sites and negative survey points |
||||||
# |
% |
# |
% |
# |
% |
# |
% |
# |
% |
|
Low |
3892435 |
43.63 |
737 |
43.92 |
188 |
14.56 |
109 |
15.53 |
297 |
14.90 |
Medium |
1729886 |
19.39 |
311 |
18.53 |
215 |
16.65 |
74 |
10.54 |
289 |
14.50 |
High |
3026421 |
33.93 |
573 |
34.15 |
885 |
68.55 |
514 |
73.22 |
1399 |
70.20 |
Water |
262545 |
2.94 |
54 |
3.22 |
3 |
0.23 |
2 |
0.28 |
5 |
0.25 |
Steep Slopes |
9169 |
0.10 |
3 |
0.18 |
0 |
0 |
3 |
0.43 |
3 |
0.15 |
Mines |
0 |
0 |
0 |
0 |
0 |
0 |
0 |
0 |
0 |
0 |
Total |
8920456 |
100 |
1678 |
100 |
1291 |
100 |
702 |
100 |
1993 |
100 |
The number of surveyed places (702 sites of all kinds and 1291 negative survey points) in the Big Woods subsection is high relative to other parts of the state (Table 8.6.14). Nevertheless, two preliminary survey probability models had only 63 percent agreement. The Kappa statistic for these models was 0.42355. Such poor performance may be attributable to the biased distribution of surveys. The conditional Kappa statistics (Table 8.10.9) are lowest for the medium site potential zone, which is less than 20 percent of the subsection area. Conducting surveys more randomly throughout the undersurveyed areas should increase the stability of the model.
Table 8.10.9. Conditional Kappa Values for Survey Probability Model, Big Woods Subsection.
Class |
Ki |
Proportion Correct |
Low |
0.5367 |
0.7220 |
Medium |
0.1050 |
0.2840 |
High |
0.5975 |
0.7585 |
8.10.3.3 Interpretation
Eighteen variables are included in the survey probability model, nine of which are also in the site probability model. Nearly all of the correlation coefficients of survey model variables are low (Table 8.10.4); only two, height above surroundings (Figure 8.10.9.a) and relative elevation (Figure 8.10.9.b), have correlations with surveyed places of 0.3 and above. This indicates that surveyed places tend to have greater relief and are higher than their surroundings compared to areas that have been undersurveyed. However, this appears to be from the influence of sites in the database of surveyed places. Negative survey points are more similar in these characteristics to random points.
There are only five variables in this model that are not significant at the 0.05 level, as measured by the Mann-Whitney U test (Table 8.10.4). This implies that archaeological surveys in the Big Woods are nonrandomly distributed on a series of environmental characteristics. The pattern is apparent from an examination of the means (Table 8.10.4) and histograms of these variables for the populations of negative survey points, modeled sites, and random points. These are discussed in Section 8.10.2.3.1 and, for variables appearing only in the survey probability model, below.
In some respects, the population of negative survey points is quite similar to that of known sites when compared to random points. They are closer to perennial rivers and streams (Figure 8.10.11a), to lake, wetlands, organic soils, and streams ( Figure 8.10.11d), and to river bottom forest (Figure 8.10.14a) than are random points.
Surveyed places and random points tend to be farther from large lakes than are modeled sites (Figures 8.10.10d, 8.10.12b and 8.10.12c). For the variables distance to aspen-birch (Figure 8.10.13a), and distance to conifers (Figure 8.10.13b), there is little distinction between modeled sites, negative survey points, and random points.
8.10.4 Survey Implementation Model
The survey implementation model for the Big Woods indicates that 37.61 percent of the land area is categorized as unknown because of inadequate survey (Table 8.10.10 and Figure 8.10.8). As indicated by the survey implementation model, these areas are in the southern and northwestern portions of the subsection. The proportion of the unknown area occupied by wetlands, pavement, and other unsurveyable land covers has not been calculated. High probability areas are concentrated strongly around water bodies, including significant areas of suspected and possibly high probability in places unlike those that have been well surveyed. Low probability areas are primarily between the high probability and the unknown areas. With the unknown area removed, the low and possibly low probability areas occupy 25.41 percent of the landscape. This emphasizes the need for more surveys in the unknown areas to improve the models.
Table 8.10.10. Evaluation of Survey Implementation Model, Big Woods Subsection.
|
||||||||||||||||||||||||||||||||||||||||||||||||||||||||||||||||||||||||||||||||||||||||||||||||||||||||||||||||||||||||||||||||||||||||||||||||||||||||||||||||||||||||||||||||||||||||||||||||||||||||||||||||||||||||||||
River valley floors and terraces in the Big Woods subsection have the potential to contain deeply buried archaeological sites. Mn/Model landscape suitability models were created for the Minnesota River Valley through this subsection (Section 12.3). In addition, a very small portion of the Mississippi River Valley between St. Paul and St. Cloud coincides with the Big Woods subsection. That stretch of the river is now being mapped and modeled for landscape suitability by MnDOT. These models should be consulted for information regarding the geomorphic potential for both surface and subsurface archaeological sites.
8.8 Anoka Sand Plain
8.9 Aspen Parklands
8.10 Big Woods
8.11 Blufflands
8.12 Border Lakes
8.13 Chippewa Plains
8.14 Coteau Moraines / Inner Coteau
8.15 Glacial Lake Superior Plain/Northshore Highlands/ Nashwauk
Uplands
8.16 Hardwood Hills
8.17 Laurentian Highlands
8.18 Littlefork-Vermilion Uplands
8.19 Mille Lacs Uplands
8.20 Minnesota River Prairie
8.21 Oak Savanna
8.22 Pine Moraines & Outwash Plains
8.23 Red River Prairie
8.24 Rochester Plateau
8.25 St. Croix Moraines and Outwash Plains (Twin Cities Highlands)
8.26 St. Louis Moraines/ Tamarack Lowlands
8.27 Conclusion
References
The Mn/Model Final Report (Phases 1-3) is available on CD-ROM. Copies may be requested by visiting the contact page.

Acknowledgements
MnModel was financed with Transportation Enhancement and State Planning and Research funds from the Federal Highway Administration and a Minnesota Department of Transportation match.
Copyright Notice
The MnModel process and the predictive models it produced are copyrighted by the Minnesota Department of Transportation (MnDOT), 2000. They may not be used without MnDOT's consent.