Quick Links
Chapters
- Management Summary
- Research Design & Time Line
- Environment & Native American Culture
- GIS Design
- Archaeological Database
- Archaeological & Environmental Variables
- Model Development & Evaluation
- Model Results & Interpretation
- Project Applications
- Model Enhancements
- Model Implementation
- Landscape Suitability Models
- Summary & Recommendations
Appendices
- Archaeological Predictive Modeling: An Overview
- GIS Standards & Procedures
- Archaeology Field Survey Standards, Procedures & Rationale
- Archaeology Field Survey Results
- Geomorphology Survey Profiles, Sections, & Lists
- Building a Macrophysical Climate Model for the State of Minnesota
- Correspondence of Support for Mn/Model
- Glossary
- List of Figures
- List of Tables
- Acknowledgments
8.22 PINE MORAINES & OUTWASH PLAINS SUBSECTION OF MINNESOTA & NE IOWA MORAINAL SECTION
8.22.1 Environmental Context
8.22.2 Site Probability Model
8.22.3 Survey
Probability Model
8.22.4 Survey Implementation Model
8.22.5 Other Models
This regional model report is organized as described in Sections 8.2.1 through 8.4.1. Refer to these sections of the report for explanations of the tables, variables, and statistics.
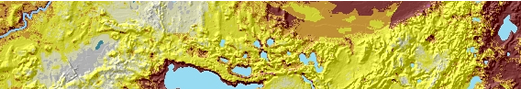
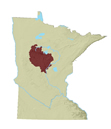
Pine Moraines and Outwash Plains is a subsection of the Northern Minnesota Drift and Lake Plains Section of the Laurentian Mixed Forest Province (Figure 8.1) (Minnesota DNR 1998). This subsection is dominated by outwash plains, outwash channels, and end moraines (Figure 8.22.2.a). The topography ranges from level to gently rolling.
The northern limit of the Des Moines Lobe till plain defines the northern border of this subsection. The eastern boundary is based on the interface between the end and ground moraines of the Rainy Lobe and the western limits of the ice contact sediments of the Des Moines Lobe. The western border is based on the historic vegetation interface between white and red pine, jack pine, and aspen-birch to the east and Big Woods to the west (Dan Hanson, personal communication 1997).
Large outwash dominate the center and southeast corner of the subsection. Outwash channels (Figure 8.22.2.a) dissect an expanse of Wadena morainal material in the western third of the subsection. Ground and end moraines of the Rainy Lobe underlie areas of the eastern portion of the subsection. The Wadena drumlin field reaches from the western border of south Cass County across Wadena County and into eastern Otter Tail County. These drumlins cover a large portion of the southwest part of the subsection.
In the 19th century the prevalent tree cover on the well-drained soils of outwash was jack pine, red pine, white pine, and aspen-birch with a conifer component (Figure 8.22.1.b). A variety of hardwood communities, including Big Woods, aspen-oak woodland, and oak barrens (savanna), were scattered throughout the western and southern portion of the subsection. Aspen-birch forest was associated with loamy soils on the Wadena-Alexandria Moraine in the southern and western areas of the subsection. Poorly drained soils are interspersed throughout the subsection (Figure 8.22.2.b) and were occupied by wet prairie and conifer bog communities.
Groups of large lakes are located in the eastern and western portions of the subsection (Figure 8.22.1.a). Smaller lakes are present in the central area. The Cuyuna Iron Range is located east of Brainerd in central Crow Wing County at the east central border of the subsection. The source of the Mississippi River is located in the southeast corner of Clearwater County in the northwest part of the subsection. The river flows north out of the subsection, reenters at the center of the eastern border, and exits at the most southern border.
8.22.2.1 Description
Areas of high and medium site potential in this region are situated primarily around lakes (Figure 8.22.3) and, to a lesser extent, adjacent to rivers. The largest contiguous area of high/medium site potential zones is in the southeastern portion of the subsection.
The areas around the lakes north of Brainerd in Crow Wing County (Gull, Pelican, the Whitefish chain of lakes, and over 30 others) are almost entirely classified as high and medium site potential. High site potential along the northeastern boundary of the subsection outlines Leech Lake’s southern shore. Medium site potential occurs in the vicinity of moderately sized lakes in central Cass County.
High and medium site potential are found in the vicinity of Shamineau, Fish Trap, and Alexander lakes in the southern part of the subsection, in the north central portion along a series of lakes and streams in southern Hubbard County, and along the Crow Wing complex of lakes, Long Lake in southern Hubbard County, and the Shell River in northern Wadena County.
Patterns of high and medium site potential zones around lakes along the western border correspond subtly to changes in elevation. Within Otter Tail County, some of these patterns reflect aberrations in the original digital elevation data. In Hubbard County, zones of high site potential occur on the north sides of lakes while medium site potential is found on the south shores.
Rivers and streams are a minor component in this model. The largest concentration of high and medium site potential associated with a river feature occurs at the confluence of the Crow Wing and Mississippi Rivers in the southeast portion of the subsection. A smaller area of medium to high site potential lies within the Mississippi River valley in the southern tip of the subsection. Two tributaries (Fletcher Creek and Elk River) with high site potential enter the Mississippi in the northwest corner of Morrison County. Areas of high and medium site potential also follow the Crow Wing River, which forms the southern boundary of Cass County, and its largest tributary, the Long Prairie River in Todd County and the La Salle and Schoolcraft rivers in northern Hubbard County.
8.22.2.2 Evaluation
The site probability model (Figure 8.22.3) for the Pine Moraines and Outwash Plains performed very well. It is based on 13 variables (Table 8.22.1) representing topography and hydrology, vegetation, and soils.
Table 8.22.1. Site Probability Model, Pine Moraines & Outwash Plains Subsection.
Intercept |
10.511 |
|
ln(nonsites/sites) |
2.127327138 |
|
Variable |
Regression Coefficient |
Probability |
Direction to nearest water or wetland |
-0.5596980 |
100 |
Distance to edge of nearest large lake |
-0.02914535 |
100 |
Distance to edge of nearest perennial river or stream |
-0.03162107 |
100 |
Distance to edge of nearest swamp |
0.04581347 |
100 |
Distance to mixed hardwoods and pines |
0.01370016 |
100 |
Distance to nearest confluence between perennial or intermittent streams and large rivers |
-0.008435885 |
56.3 |
Distance to nearest lake, wetland, organic soil, or stream |
-0.07192234 |
100 |
Distance to oak woodland |
0.01143769 |
100 |
Distance to prairie |
-0.009258694 |
100 |
Elevation |
-0.01258962 |
100 |
Height above surroundings |
0.05327425 |
100 |
Size of nearest permanent lake |
0.0001739085 |
100 |
Vertical distance to permanent water |
-0.02253235 |
100 |
In this model, 86.07 percent of all known sites are in high/medium site potential areas, which make up only 19.21 percent of the landscape (Table 8.22.2). This produces a strong gain statistic of 0.77681 (Table 8.6.11), which is higher than the statewide average. However, the model tests less well. Only 67.19 percent of the test sites are predicted, producing a gain statistic of 0.71409. This implies that the modeled sites were not representative of the total site population in the region.
Table 8.22.2. Evaluation of the Site Probability Model, Pine Moraines & Outwash Plains Subsection.
Region (30 meter cells) |
Random Points |
Negative Survey Points |
Modeled Sites |
Test Sites |
||||||
# |
% |
# |
% |
# |
% |
# |
% |
# |
% |
|
Low |
12407112 |
76.83 |
3052 |
76.72 |
528 |
49.35 |
51 |
10.76 |
20 |
31.25 |
Medium |
1551322 |
9.61 |
376 |
9.45 |
120 |
11.21 |
55 |
11.60 |
6 |
9.38 |
High |
1549749 |
9.60 |
382 |
9.60 |
414 |
38.69 |
353 |
74.47 |
37 |
87.81 |
Water |
622094 |
3.85 |
165 |
4.15 |
8 |
0.75 |
14 |
2.95 |
1 |
1.56 |
Steep Slopes |
3703 |
0.02 |
0 |
0 |
0 |
0 |
0 |
0 |
0 |
0 |
Mines |
14916 |
0.09 |
3 |
0.08 |
0 |
0 |
1 |
0.21 |
0 |
0 |
Total |
16148896 |
100 |
3978 |
100 |
1070 |
100 |
474 |
100 |
64 |
100 |
The database included 474 sites that were not single artifacts. This is slightly higher than the average number of sites for the Phase 3 regions. Two preliminary models using different halves of the known sites had 93 percent agreement (93 percent of the cells in the subsection were classified the same in both models). The Kappa statistic, which is adjusted for the amount of agreement expected by chance alone, for these models, was 0.78248 (Table 8.6.11), making this the second most stable model in the state. The conditional Kappa statistics (Table 8.22.3) are highest for the low site potential zone, and this is more than 76 percent of the subsection area. However, survey bias reduces confidence in the assignment of low probability to much of this area (Section 8.22.3).
Table 8.22.3. Conditional Kappa Values for Site Probability Model, Pine Moraines & Outwash Plains.
Class |
Ki |
Proportion Correct |
Low |
0.8482 |
0.9696 |
Medium |
0.6088 |
0.6480 |
High |
0.8375 |
0.8537 |
8.22.2.3 Interpretation
The site probability model for the Pine Moraines and Outwash Plains subsection is made up of 13 variables, eight of which are hydrologic in nature. There are also three vegetation and two topographic variables involved in the model.
8.22.2.3.1 Differences between Modeled Sites and Random Points for Individual Model Variables
Four model variables have coefficients 0.3 or greater (elevation, distance to edge of nearest large lake, distance to nearest lake, wetland, organic soil, or stream, and size of nearest permanent lake) (Table 8.22.4). The relatively small average distance between random points and lakes, wetlands, organic soils, or streams (86 meters) indicates that a substantial part of the landscape is covered by water, and sites are even closer to these features than would be expected by chance alone (Figure 8.22.8b). The data indicate that 96 percent of sites are within 400 meters (20 x 20 meters) of aquatic environments. Compared to random points, sites tend to be 2280 meters closer to the nearest large lake (Figure 8.22.7b), 114 meters closer to the nearest perennial river or stream (Figure 8.22.7c), and 2840 meters nearer to the confluence between perennial or intermittent streams and large rivers (Figure 8.22.8a). Sites also occur more commonly near larger permanent lakes than do random points (3647 acres vs. 740 acres, Figure 8.22.8d). However, sites are somewhat further from swamps than are random points (215 vs. 144 meters, Figure 8.22.7d). Sites are also more to the north of water or wetlands than would be expected by chance (Figure 8.22.7a).
Sites tend to be at lower elevations, by an average of 119 feet, than random points (Figure 8.22.11b). This may be related to the overall distribution of sites in the subsection. That is, 83.5 percent of known sites are in the southeastern portion of the subsection, which is also lowest in elevation. Sites also have less vertical distance above permanent water, yet somewhat greater height above their surroundings, than would be expected by chance (Figures 8.22.9a and 8.22.11c).
Sites are closer to oak woodlands (Figure 8.22.10a), prairie (Figure 8.22.10b), and mixed hardwoods and pine (Figure 8.22.9d) than are random points.
Results of the Mann-Whitney U tests (Table 8.22.6) indicate that all but two variables, height above surroundings and distance to mixed hardwoods and pine, are significant at the 0.05 level. This means that the distribution of values between sites and random points on most of the model variables differs enough to consider them as originating from different populations.
Table 8.22.4. Model Variable Statistics.
Pine Moraines and Outwash Plains |
Modeled Sites |
Surveyed Areas |
Modeled Sites |
Sites in Low Prob. |
Neg. Survey Points |
Random Points |
||||||
Model Variable |
Coeff. |
Sign. |
Coeff. |
Sign. |
Mean |
S.D. |
Mean |
S.D. |
Mean |
S.D. |
Mean |
S.D. |
Distance to nearest minor ridge or divide |
- |
- |
-0.031 |
0 |
24.8 |
12.86 |
21.67 |
10.44 |
22.13 |
10.66 |
24.44 |
11.64 |
Elevation |
-0.405 |
0 |
-0.639 |
0 |
1280.89 |
108.88 |
1355.47 |
81.31 |
1327.45 |
113.75 |
1400 |
120.74 |
Height above surroundings |
0.137 |
0.064 |
0.093 |
0 |
9.86 |
10.89 |
7.31 |
8.4 |
10.62 |
10.48 |
8.58 |
10.06 |
Size of major watershed |
- |
- |
0.058 |
0.131 |
1843.49 |
360.48 |
1731.73 |
369.37 |
1828.91 |
351.59 |
1793.4 |
415.84 |
Direction to nearest water or wetland (sine) |
0.028 |
0.01 |
-0.008 |
0 |
0.19 |
0.76 |
0.21 |
0.67 |
0.16 |
0.71 |
0.28 |
0.73 |
Distance to edge of nearest large lake |
-0.484 |
0 |
-0.518 |
0 |
24.06 |
26.62 |
47.82 |
35.92 |
38.64 |
28.8 |
53.5 |
33.09 |
Distance to edge of nearest perennial river or stream |
-0.043 |
0 |
- |
- |
27.67 |
16.88 |
34.85 |
21.61 |
37.42 |
18.14 |
38.33 |
17.91 |
Distance to edge of nearest swamp |
0.282 |
0 |
0.288 |
0 |
14.66 |
8.95 |
8.69 |
6.34 |
14.41 |
8.45 |
12 |
8.84 |
Distance to nearest confluence between perennial or intermittent streams and large rivers |
-0.26 |
0 |
-0.47 |
0 |
63.75 |
28.74 |
75.95 |
35.45 |
69.78 |
26.56 |
83.06 |
26.53 |
Distance to nearest lake, wetland, organic soil, or stream |
-0.315 |
0 |
-0.222 |
0 |
6.3 |
6.3 |
7.32 |
6.95 |
8.8 |
6.9 |
9.25 |
7.37 |
Distance to nearest permanent wetland inlet/outlet |
- |
- |
0.267 |
0 |
162.69 |
59.22 |
149.19 |
71.18 |
161.74 |
55.82 |
148.52 |
59.34 |
Size of nearest permanent lake |
0.437 |
0 |
0.489 |
0 |
3647.41 |
5376.4 |
758.34 |
1328.91 |
1602.09 |
3284.06 |
740.05 |
2064.7 |
Vertical distance to permanent water |
-0.034 |
0 |
-0.055 |
0.136 |
9.18 |
15.97 |
13.18 |
21.15 |
18.6 |
25.31 |
18.88 |
28.4 |
Distance to Big Woods |
- |
- |
-0.246 |
0 |
71.05 |
26.96 |
84.64 |
26.08 |
77.74 |
34.69 |
83.5 |
36.52 |
Distance to hardwoods |
- |
- |
-0.287 |
0 |
51.16 |
29 |
65.92 |
29.08 |
61.52 |
32.65 |
64.91 |
34.34 |
Distance to mixed hardwoods and pines |
-0.001 |
0.103 |
- |
- |
114.49 |
63.65 |
89.88 |
71.21 |
97.05 |
59.63 |
121.12 |
70.39 |
Distance to oak woodland |
-0.267 |
0 |
- |
- |
101.61 |
59.52 |
137.55 |
70.43 |
112.76 |
64.53 |
139.26 |
58.09 |
Distance to prairie |
-0.173 |
0 |
-0.399 |
0 |
152.18 |
75.76 |
202.56 |
73.25 |
161.43 |
82.74 |
191.52 |
62.46 |
Distance to river bottom forest |
- |
- |
-0.427 |
0 |
105.9 |
70.13 |
127.09 |
66.18 |
104.3 |
54.68 |
131.2 |
57.34 |
Frequency counts |
474 |
1593 |
474 |
51 |
1070 |
3978 |
||||||
See Interpretation section for discussion of the statistics:
Coeff. = correlation coefficient
Sign. = significance of the Mann-Whitney U test
S.D. = standard deviation
Distances and areas are expressed in square roots of meters. Square the values in the table to get actual values.
8.22.2.3.2 Relationships between Variable Pairs
There are five sets of variables that have moderate correlations of 0.5 and above (Table 8.22.5). Elevation is positively associated with distance to oak woodland (0.63) and distance to prairie (0.62), as oak woodland and prairie are primarily found on the lower elevations in the southern part of the subsection. Vertical distance to permanent water (Figure 8.22.4.b) increases as height above surroundings (Figure 8.22.4.a) also increases. The strong negative relationship (-0.7) between distance to nearest large lake and size of permanent lake is expected, as when sites are closer to large lakes, the closest lake is likely to be large. Finally, as size of nearest permanent lake increases, distance to prairie also increases, indicating that prairie tends to be distant from larger permanent lakes.
Table 8.22.5. Variable Correlation Matrix.
Pine Moraines and Outwash Plains |
Elevation |
Height above surroundings |
Direction to nearest water or wetland (sine) |
Distance to edge of nearest large lake |
Distance to edge of nearest perennial river or stream |
Distance to edge of nearest swamp |
Distance to nearest confluence between perennial or intermittent streams and large rivers |
Distance to nearest lake, wetland, organic soil, or stream |
Elevation |
1 |
|||||||
Height above surroundings |
0.27 |
1 |
||||||
Direction to nearest water or wetland (sine) |
-0.05 |
-0.37 |
1 |
|||||
Distance to edge of nearest large lake |
-0.2 |
0.01 |
-0.17 |
1 |
||||
Distance to edge of nearest perennial river or stream |
0.13 |
-0.04 |
0.03 |
-0.37 |
1 |
|||
Distance to edge of nearest swamp |
-0.32 |
-0.16 |
0.05 |
-0.05 |
0.13 |
1 |
||
Distance to nearest confluence between perennial or intermittent streams and large rivers |
0.39 |
0.08 |
0.03 |
-0.14 |
0.49 |
-0.04 |
1 |
|
Distance to nearest lake, wetland, organic soil, or stream |
-0.06 |
0.1 |
-0.12 |
0.46 |
0.01 |
0.12 |
0.1 |
1 |
Size of nearest permanent lake |
0.29 |
0.06 |
0.15 |
-0.7 |
0.46 |
0.03 |
0.27 |
-0.17 |
Vertical distance to permanent water |
0.28 |
0.7 |
-0.35 |
0.03 |
-0.15 |
-0.15 |
-0.07 |
0.13 |
Distance to mixed hardwoods and pine |
0.38 |
0.19 |
-0.1 |
-0.2 |
-0.03 |
-0.16 |
0.13 |
0.01 |
Distance to oak woodland |
0.63 |
0.1 |
0 |
-0.11 |
0.11 |
-0.38 |
0.33 |
-0.03 |
Distance to prairie |
0.62 |
0.07 |
0.13 |
-0.37 |
0.35 |
-0.21 |
0.41 |
-0.15 |
Size of nearest permanent lake |
Vertical distance to permanent water |
Distance to mixed hardwoods and pine |
Distance to oak woodland |
Distance to prairie |
|
Elevation |
|||||
Height above surroundings |
|||||
Direction to nearest water or wetland (sine) |
|||||
Distance to edge of nearest large lake |
|||||
Distance to edge of nearest perennial river or stream |
|||||
Distance to edge of nearest swamp |
|||||
Distance to nearest confluence between perennial or intermittent streams and large rivers |
|||||
Distance to nearest lake, wetland, organic soil, or stream |
|||||
Size of nearest permanent lake |
1 |
||||
Vertical distance to permanent water |
0.02 |
1 |
|||
Distance to mixed hardwoods and pine |
0.17 |
0.27 |
1 |
||
Distance to oak woodland |
0.19 |
-0.01 |
-0.06 |
1 |
|
Distance to prairie |
0.54 |
-0.04 |
0 |
0.66 |
1 |
Refer to "Relationships between variable pairs" for interpretation of the table values.
8.22.2.3.3 Sites in Low Probability Areas
Sites in the low site potential areas have mean values either similar to those for random points or falling between all modeled sites and random points on most variables. They are distinguished only in having less height above their surroundings, being closer to mixed hardwoods and pines, and being farther from prairie than either sites or random points.
Of the 51 sites in low probability areas, two are wild rice sites, two are mortuary/cemetery sites, 13 are mounds or earthworks, one is a trading post, 19 are artifact scatters, 13 are lithic scatters, and one is a shell midden. If all sites types were predicted equally well by the model, 10.76 percent of each site type should be in the low probability areas. Low probability areas contain between 9.5 and 12.5 percent of wild rice, mortuary/cemetery, and trading post sites, as expected by chance. Mound/earthwork sites are somewhat over represented in low probability areas at 14.94 percent. The only shell midden in the subsection is in the low probability area. Artifact and lithic scatters, on the other hand, are slightly under represented (8.68 and 8.07 percent respectively), indicating that the model is doing a fairly good job predicting these types of sites.
8.22.2.3.3 Relationships between Cultural Context, Descriptive, or Settlement Variables and Site Potential
Four bivariate relationships between different archaeological contexts, site types, and areas of site potential are summarized in Table 8.22.6. A chi-square test of these indicates that only the Archaic/not-Archaic dichotomy is significant at the 0.05 level. An examination of the percentages indicates that Archaic sites are under represented in the low potential areas and overly abundant in the medium probability areas. This is unlike other subsections where Archaic sites are relatively common in the low probability zones. Aceramic sites are also under represented in the low potential areas, again unlike other subsections. There are no significant differences in the distribution of single component and mound sites.
Table 8.22.6. Summary of Bivariate Relationships between Four Dichotomous Archaeological Variables and Three Areas of Site Potential, Pine Moraines & Outwash Plains (Site Probability Model).
Low Potential |
Medium Potential |
High Potential |
Total |
Chi-square Test |
|||||||
Dichotomous Variable |
N |
% |
N |
% |
N |
% |
N |
% |
value |
df |
p-value |
All Sites |
51 |
11.1 |
55 |
12.0 |
353 |
76.9 |
459 |
100.0 |
- |
- |
- |
Archaic |
0 |
0.0 |
6 |
27.3 |
16 |
72.7 |
22 |
100.0 |
6.53 |
2 |
0.04 |
Not Archaic |
26 |
11.9 |
25 |
11.5 |
167 |
76.6 |
218 |
100.0 |
|||
Aceramic |
13 |
6.0 |
30 |
14.0 |
172 |
80.0 |
215 |
100.0 |
3.87 |
2 |
0.14 |
Not Aceramic |
24 |
11.2 |
25 |
11.7 |
165 |
77.1 |
214 |
100.0 |
|||
Single Component |
20 |
10.1 |
23 |
11.6 |
155 |
78.3 |
198 |
100.0 |
2.65 |
2 |
0.27 |
Not Single Component |
6 |
14.3 |
8 |
19.0 |
28 |
66.7 |
42 |
100.0 |
|||
Mounds |
1 |
7.1 |
3 |
21.4 |
10 |
71.4 |
14 |
100.0 |
0.97 |
2 |
0.62 |
Not Mounds |
36 |
8.7 |
52 |
12.5 |
327 |
78.8 |
415 |
100.0 |
|||
8.22.3 Survey Probability Model
8.22.3.1 Description
The survey probability model (Figure 8.22.5) of the Pine Moraines & Outwash Plains Subsection indicates that environmental settings away from water have not been adequately surveyed. Such settings are extensive, particularly in the central and western portion of the subsection. Survey bias has been focused towards the southeastern portion of the subsection and around lakes. Areas of higher elevations (above 1400-1500 feet) that generally correspond to a higher surface roughness index have a low probability of having been surveyed.
Several linear surveys have been conducted in the Pine Moraines & Outwash Plains subsection. The surveys are usually 7 - 25 km long. These surveys are located along State Highway 2 on the Beltrami-Clearwater and Beltrami-Hubbard county lines, along County State Aid Highways 2, 4, 9, and 29 in Hubbard County, in Cass County along State Highway 371 and CSAH 1, and in Crow Wing County along CSAH 11 and 19 and State Highway 371. Other surveys are associated with lakes in the subsection. In some cases it appears that highway surveys were conducted only in the areas near lakes and not along the highway corridor away from lakes.
8.22.3.2 Evaluation
The survey probability model predicted surveyed places better than by chance, suggesting that surveys are not located randomly within the subsection. The model is based on 16 variables (Table 8.22.7), representing topography, vegetation, soils and hydrology.
Table 8.22.7. Survey Probability Model, Pine Moraines & Outwash Plains Subsection.
Intercept |
5.692 |
|
ln(non-surveys/surveys) |
0.91516015 |
|
Variable |
Regression Coefficient |
Probability |
Direction to nearest water or wetland |
-0.2806036 |
100 |
Distance to Big Woods |
-0.009276969 |
100 |
Distance to edge of nearest large lake |
-0.01541171 |
100 |
Distance to edge of nearest swamp |
0.03435690 |
100 |
Distance to hardwoods |
0.008069598 |
100 |
Distance to nearest confluence between perennial or intermittent streams and large rivers |
-0.008836032 |
100 |
Distance to nearest lake, wetland, organic soil, or stream |
-0.05418713 |
100 |
Distance to nearest minor ridge or divide |
-0.01683348 |
100 |
Distance to permanent wetland inlets/outlets |
-0.006306250 |
100 |
Distance to prairie |
-0.007157936 |
100 |
Distance to river bottom forest |
-0.008063127 |
100 |
Elevation |
-0.001956923 |
97.6 |
Height above surroundings |
0.03480314 |
100 |
Size of major watershed |
0.0003963858 |
100 |
Size of nearest permanent lake |
0.0001152278 |
100 |
Vertical distance to permanent water |
-0.008157863 |
100 |
The model predicts 83.99 percent of all sites and negative survey points in high/medium survey potential areas, which constitutes 43.21 percent of the landscape (Table 8.22.8). This produces a weak gain statistic of 0.48553 (Table 8.6.14), which is about average for a survey probability model. This model was able to predict surveyed places with much less precision than both survey probability models were able to predict sites. The portions of land classified as high and medium survey potential indicate that sites are confined to less than half the surveyed area.
The numbers of surveyed places (1593) in this region is above the average for all regions (Table 8.6.14). Survey frequency (0.11 surveyed places per square km) is lower than the state average while site frequency (0.036 known sites per square km) is near the state average. However, the strong concentration of both sites and surveys in the southeastern and extreme western portions of the subsection indicate a need for more surveys.
Table 8.22.8. Evaluation of Survey Probability Model, Pine Moraines & Outwash Plains Subsection.
Region (30 meter cells) |
All random points |
All negative survey points |
All sites |
All sites and negative survey points |
||||||
# |
% |
# |
% |
# |
% |
# |
% |
# |
% |
|
Low |
8530150 |
52.82 |
2049 |
51.51 |
207 |
19.35 |
25 |
4.78 |
232 |
14.56 |
Medium |
3101730 |
19.21 |
788 |
19.81 |
177 |
16.54 |
48 |
9.18 |
225 |
14.12 |
High |
3876303 |
24.00 |
973 |
24.46 |
678 |
63.36 |
435 |
83.17 |
1113 |
69.87 |
Water |
622094 |
3.85 |
165 |
4.15 |
8 |
0.75 |
14 |
2.68 |
22 |
1.38 |
Steep Slopes |
3703 |
0.02 |
0 |
0 |
0 |
0 |
0 |
0 |
0 |
0 |
Mines |
14916 |
0.09 |
3 |
0.08 |
0 |
0 |
1 |
0.19 |
1 |
0.06 |
Total |
16148896 |
100 |
3978 |
100 |
1070 |
100 |
523 |
100 |
1593 |
100 |
The database included 1593 surveyed places (Table 8.22.8). Two preliminary survey probability models had 75% agreement. The Kappa statistic for these models was 0.59663 (Table 8.6.14). The conditional Kappa statistics (Table 8.22.9) are lowest for the medium potential zone, indicating that half the cells in this zone might actually belong in either the high or low probability classes. It is assumed that distributing more surveys throughout the undersurveyed areas may improve model stability.
Table 8.22.9. Conditional Kappa Values for Survey Probability Model, Pine Moraines & Outwash Plains.
Class |
KI |
Proportion Correct |
Low |
0.6215 |
0.8108 |
Medium |
0.3925 |
0.5443 |
High |
0.7235 |
0.7926 |
8.22.3.3 Interpretation
Sixteen variables contribute to the construction of the survey probability model. Ten of these are shared with the site probability model. Five survey model variables have correlation coefficients in excess of 0.3. Considering the mean variable values for negative survey points (Table 8.22.4), it is apparent that most surveys have been conducted in a non-random fashion in the subsection.
Negative survey points are best distinguished from both sites and random points on three variables. They are closer to minor ridges and divides (Figure 8.22.11a), higher above their surroundings (Figure 8.22.11c), and more to the north of water and wetlands (Figures 8.22.7a) than are either sites or random points. They are also biased (have mean values closest to sites) in terms of their size of major watershed (Figure 8.22.11d), distance to edge of nearest swamp (Figure 8.22.7d), distance to nearest permanent wetland inlet/outlet (Figure 8.22.8c), and distance to river bottom forest (Figure 8.22.10c). Negative survey points are least biased (have mean values closest to random points) on the variables vertical distance to permanent water (Figure 8.22.9a) and distance to hardwoods (Figure 8.22.9c). They are intermediate between sites and random points in their distance to Big Woods (Figure 8.22.9b) as well as in other variables shared with the site probability model.
The Mann-Whitney U tests indicate that all variables except two are significant at the 0.05 level (Table 8.22.6). This means that the negative survey and random points are not drawn from the same population. In other words, the surveys in this subsection are not situated randomly with respect to the model variables.
8.22.4 Survey Implementation Model
The survey implementation model for the Pine Moraines and Outwash Plains indicates that 51.86 percent of the subsection is classified as unknown because of inadequate survey (Table 8.22.10 and Figure 8.22.6). These areas are located away from lakes and major rivers. Ten test sites (15.63 percent) were found in the unknown area.
Low and possibly low site probability zones occupy 24.97 percent of the subsection. More surveys are needed away from water in this subsection to improve model performance and reduce the extent of the unknown area.
Table 8.22.10. Evaluation of Survey Implementation Model, Pine Moraines & Outwash Plains Subsection.
Region (30 meter cells) |
Random Points |
Negative Survey Points |
Single Artifacts |
Sites |
||||||
# |
% |
# |
% |
# |
% |
# |
% |
# |
% |
|
Unknown |
8374510 |
51.86 |
2012 |
50.58 |
204 |
19.07 |
3 |
6.12 |
20 |
4.22 |
Possibly Low |
2590516 |
16.04 |
675 |
16.97 |
157 |
14.67 |
4 |
8.16 |
20 |
4.22 |
Low |
1442086 |
8.93 |
365 |
9.18 |
167 |
15.61 |
10 |
20.41 |
11 |
2.32 |
Suspected Medium |
143716 |
0.89 |
34 |
0.85 |
1 |
0.09 |
0 |
0 |
2 |
0.42 |
Possibly Medium |
415399 |
2.57 |
88 |
2.21 |
16 |
1.5 |
1 |
2.04 |
10 |
2.11 |
Medium |
992207 |
6.14 |
254 |
6.39 |
103 |
9.63 |
2 |
4.08 |
43 |
9.07 |
Suspected High |
11924 |
0.07 |
3 |
0.08 |
2 |
0.19 |
0 |
0 |
0 |
0 |
Possibly High |
95815 |
0.59 |
25 |
0.63 |
4 |
0.37 |
0 |
0 |
13 |
2.74 |
High |
1442010 |
8.93 |
354 |
8.9 |
408 |
38.13 |
29 |
59.18 |
340 |
71.73 |
Water |
622094 |
3.85 |
165 |
4.15 |
8 |
0.75 |
0 |
0 |
14 |
2.95 |
Steep Slopes |
3703 |
0.02 |
0 |
0 |
0 |
0 |
0 |
0 |
0 |
0 |
Mines |
14916 |
0.09 |
3 |
0.08 |
0 |
0 |
0 |
0 |
1 |
0.21 |
Total |
16148896 |
100 |
3978 |
100 |
1070 |
100 |
49 |
100 |
474 |
100 |
The landscape suitability model for the Upper Mississippi River occupies the southeastern portion of the study area, south and east of North Long Lake and Lake Edward. The model extends approximately 17 km up the Crow Wing River to Lake Placid. There is a high potential for buried sites within the Mississippi River Valley. This model should be consulted for any projects within this area.
8.23 Red River Prairie
8.24 Rochester Plateau
8.25 St. Croix Moraines and Outwash Plains (Twin Cities Highlands)
8.26 St. Louis Moraines/ Tamarack Lowlands
8.27 Conclusion
References
The Mn/Model Final Report (Phases 1-3) is available on CD-ROM. Copies may be requested by visiting the contact page.

Acknowledgements
MnModel was financed with Transportation Enhancement and State Planning and Research funds from the Federal Highway Administration and a Minnesota Department of Transportation match.
Copyright Notice
The MnModel process and the predictive models it produced are copyrighted by the Minnesota Department of Transportation (MnDOT), 2000. They may not be used without MnDOT's consent.