Quick Links
Chapters
- Management Summary
- Research Design & Time Line
- Environment & Native American Culture
- GIS Design
- Archaeological Database
- Archaeological & Environmental Variables
- Model Development & Evaluation
- Model Results & Interpretation
- Project Applications
- Model Enhancements
- Model Implementation
- Landscape Suitability Models
- Summary & Recommendations
Appendices
- Archaeological Predictive Modeling: An Overview
- GIS Standards & Procedures
- Archaeology Field Survey Standards, Procedures & Rationale
- Archaeology Field Survey Results
- Geomorphology Survey Profiles, Sections, & Lists
- Building a Macrophysical Climate Model for the State of Minnesota
- Correspondence of Support for Mn/Model
- Glossary
- List of Figures
- List of Tables
- Acknowledgments
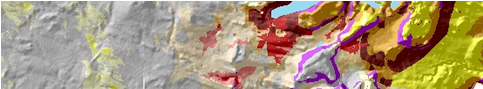
8.15 GLACIAL LAKE SUPERIOR PLAIN/NORTH SHORE HIGHLANDS/NASHWAUK UPLANDS SUBSECTIONS OF SOUTHERN SUPERIOR UPLANDS/NORTHERN SUPERIOR UPLANDS SECTIONS
8.15.1 Environmental Context
8.15.2 Site Probability Model
8.15.3 Survey
Probability Model
8.15.4 Survey Implementation Model
8.15.5
Other Models
This regional model report is organized as described in Sections 8.2.1 through 8.4.1. Refer to these sections of the report for explanations of the tables, variables, and statistics.
Glacial Lake Superior Plain, Nashwauk Uplands, and North Shore Highlands are subsections of the Northern and Southern Superior Uplands Sections of the Laurentian Mixed Forest Province (Figure 8.1) (Minnesota DNR 1998). These three subsections were joined for modeling to provide a larger number of sites for analysis.
8.15.1.1 Glacial Lake Superior Plain
The Glacial Lake Superior Plain covers the lake bed (Figure 8.15.2.a) of Glacial Lake Superior. Its borders are based on the extent of the glacial lake and the present Lake Superior shoreline. Only a very small portion of this lake bed is in Minnesota.
The lake plain is about 400 feet above the present level of Lake Superior. There are some small, isolated areas of end moraine associated with the Highland Moraine to the north, along streams. The substrate consists of a relatively narrow band of lacustrine clays located along the south and west shore of Lake Superior (Figure 8.15.2.b). Bedrock is not exposed at the surface except in localized outcrops. Topography is level to gently rolling, except along rivers and streams (Figure 8.15.1.a). This area has an uncommon drainage pattern for Minnesota. The Nemadji River and its tributaries have incised gorges up to 150 feet deep through the unit. The valleys are narrow and V-shaped, with considerable red clayey sediment deposited by the rivers and streams into Lake Superior. There are no natural lakes found in this subsection.
Presettlement vegetation (Figure 8.15.1.b) consisted of forests dominated by white spruce, white pine, and aspen-birch. The western extent of the eastern hemlock community occurred in this subsection. It overlapped a class of forest designated ‘pine flats’ and consisted of hemlock, spruce, fir, cedar, and white pine.
8.15.1.2 North Shore Highlands
The North Shore Highlands subsection occupies the area adjacent to Lake Superior. In general, the western boundary parallels the shore about 20 to 25 miles inland and is based on the interface between Rainy Lobe sediments to the north and Superior Lobe sediments to the south (Hanson, personal communication, 1997).
Ground and end moraine of the Superior Lobe cover much of the subsection (Figure 8.15.2.a). Clay lake plain forms a broad band along the Lake Superior shoreline at the southern tip of the subsection. The clay plain is flat to rolling, with steep, narrow ravines along many streams. There are also outwash deposits along the western edge of the subsection. Glacial drift is thin over the entire subsection, and bedrock is exposed or near the surface over large areas. The soils are developed from rocky, red tills of the Superior Lobe (Figure 8.15.2.b). There are few lakes in this subsection, but numerous streams drain into Lake Superior (Figure 8.15.1.a).
Historical vegetation (Figure 8.15.1.b) included aspen-birch forest, white pine-red pine forest, mixed hardwood-pine forest, and conifer bogs and swamp. White pine-red pine forest was most common on the clay lake plain and on thin soil over bedrock in the southern half of the subsection. Mixed hardwood-pine forest, with sugar maple, was concentrated on the ridges of the dissected clay lake plain and the Highland Flutes. In the northern half of the subsection, aspen-birch was dominant. Mixed hardwood-pine forest persisted on ridge tops within 6-10 miles of the shoreline (Minnesota DNR 1998).
8.15.1.3 Nashwauk Uplands
The Nashwauk Uplands are dominated by glacial landforms, including end moraines, outwash plains, and lake plains. Prominent features are the Nashwauk Moraine, the limits of which form the western and part of the northern boundary, and the Giant's Range, a high bedrock ridge forming the southern boundary. The eastern border with the North Shore Highlands is based on the interface between Rainy Lobe sediments to the north and Superior Lobe sediments to the south (Hanson, personal communication, 1997).
Brown glacial sediments form the parent material for most of this subsection (Figure. 8.15.2.a, while outwash covers much of the northern portion. The Giants Range is a 200-400 foot highland of granite along the northern edge of the Mesabi Range (Wright 1972). This ridge is covered with a thin, discontinuous layer of glacial drift. The Continental Divide cuts across the summit of the Giant's Range. Immediately to the south is the iron-formation of the range, which has been heavily mined. There are over 35 lakes at least 160 acres in size in this subsection (Mn/DNR Web Site) (Figure 8.15.1.a). Water flowing north eventually empties into Hudson Bay. On the west side, waters flow into the Mississippi River watershed. To the south, water flows into Lake Superior. The soils consist of sandy to fine-loamy glacial tills and outwash sands. (Figure 8.15.2.b).
Historical forest types within the subsection (Figure 8.15.1.b) included white pine-red pine forest, aspen-birch forest, and mixed hardwood-pine forest. Wetland vegetation included conifer bogs and swamps and open muskeg.
The Glacial Lake Superior Plain/Nashwauk Uplands/North Shore Highlands models were developed using data from the combined subsections Glacial Lake Superior Plain, Laurentian Highlands, Nashwauk Uplands, and North Shore Highlands. These models performed best for three of the four subsections modeled. Another set of models was selected to represent the Laurentian Highlands (Section 8.17). Therefore, the combined models presented here will be evaluated by the performance of the four-subsection models within only three subsections.
8.15.2.1 Description
Areas of high and medium site potential in this site probability model (Figure 8.15.3) are primarily in the form of bands around lakes or along short stretches of some streams. High and medium probability zones are scattered along the North Shore, mainly where streams enter Lake Superior. At the tip of the Arrowhead region, other areas of high and medium site potential are present in the vicinity of Grand Portage State Park. Away from the Lake Superior shoreline, lakes provide the primary focus of larger areas of high and medium site potential.
The impact of streams and lakes on site potential is enhanced by their proximity to stream confluences. There is also a strong relationship between higher site potential and higher vegetation diversity in most locations except along the North Shore. High site potential zones area also more likely in areas relatively remote from wetlands. In the Glacial Lake Superior Plain subsection, high and medium site potential are restricted to the moraine, streams, and current lakeshore in the northern portion.
8.15.2.2 Evaluation
The site probability model performed well. It is based on 14 variables (Table 8.15.1) representing topography, vegetation, and hydrology.
Table 8.15.1. Site Probability Model, Glacial Lake Superior Plain/ North Shore Highlands/ Nashwauk Uplands Subsections.
Intercept |
-4.731 |
|
ln (non-sites/sites) |
2.689193986 |
|
Variable |
Regression coefficient |
Probability |
Distance to aspen-birch |
0.01822876 |
71.4 |
Distance to Big Woods |
0.02095813 |
100 |
Distance to brushlands |
-0.01929398 |
100 |
Distance to edge of nearest large lake |
-0.04310691 |
100 |
Distance to edge of nearest perennial river or stream |
-0.02761253 |
93 |
Distance to edge of nearest swamp |
0.09426395 |
100 |
Distance to mixed hardwoods and pines |
0.01514578 |
100 |
Distance to nearest confluence between perennial or intermittent streams and large rivers |
-0.01673651 |
98.8 |
Distance to nearest intermittent stream |
0.01131375 |
55.6 |
Distance to pine barrens or flats |
0.01786182 |
100 |
Distance to river bottom forest |
-0.01455323 |
98.1 |
Size of minor watershed |
0.0002377089 |
100 |
Vegetation diversity within 1 km |
0.7313614 |
100 |
Vertical distance to permanent water |
-0.01101836 |
100 |
When the combined model is applied to the Glacial Lake Superior Plain/Nashwauk Uplands/North Shore Highlands subsections, 84.9 percent of all sites, excluding single artifacts, are in the high and medium site potential areas, which constitute only 22.65 percent of the landscape (Table 8.15.2). This produces a strong overall gain statistic of 0.73322 (Table 8.6.11). This model performs better in all respects than all individual and combined preliminary models when applied to these subsections, with the exception of the Glacial Lake Superior Plain subsection individual preliminary model. This model tested well, predicting 80.76 percent of the test sites. The test gain statistic was 0.71984.
Table 8.15.2. Evaluation of Site Probability Model, Glacial Lake Superior Plain/ North Shore Highlands/ Nashwauk Uplands Subsections.
Region (30 meter cells) |
Random Points |
Negative Survey Points |
Modeled Sites |
Test Sites |
||||||
# |
% |
# |
% |
# |
% |
# |
% |
# |
% |
|
Low |
8,512,132 |
72.93 |
1928 |
72.84 |
541 |
55.15 |
10 |
11.63 |
5 |
19.23 |
Medium |
1,909,341 |
16.36 |
456 |
17.23 |
191 |
19.47 |
16 |
18.60 |
5 |
19.23 |
High |
734,044 |
6.29 |
150 |
5.67 |
225 |
22.94 |
57 |
66.28 |
16 |
61.54 |
Water |
119,009 |
1.02 |
23 |
0.87 |
6 |
0.61 |
3 |
3.49 |
0 |
0 |
Steep Slopes |
64,700 |
0.55 |
12 |
0.45 |
6 |
0.61 |
0 |
0 |
0 |
0 |
Mines |
332,182 |
2.85 |
78 |
2.95 |
12 |
1.22 |
0 |
0 |
0 |
0 |
Total |
11,671,408 |
100 |
2647 |
100 |
981 |
100 |
86 |
100 |
26 |
100 |
The database used for modeling included 166 sites that were not single artifacts. Only 86 of these were in the three subsections being evaluated. The remaining 120 were from the Laurentian Highlands subsection. Two preliminary models for this combined region, using different halves of the database, had 86 percent agreement. There was 84 percent agreement within the North Shore Highlands subsection, 87 percent agreement in the Nashwauk Uplands subsection, and 90 percent agreement within Glacial Lake Superior Plain subsection. This is a high level of agreement, suggesting that confidence in the models developed from these combined subsections is warranted. The Kappa statistic, which is adjusted for the amount of agreement expected by chance alone, for the combined model was 0.31592 (Table 8.6.11). This is substantially lower than the average for the Phase 3 regions. The conditional Kappa statistics (Table 8.15.3) are lowest for the medium site potential zone, but this is less than four percent of the subsection area. Increasing the number of sites for modeling may improve confidence in the model and model stability even further.
Table 8.15.3. Conditional Kappa Values for Site Probability Model for Site Probability Model, Glacial Lake Superior Plain/ North Shore Highlands/ Nashwauk Uplands Subsections.
Class |
Ki |
Proportion Correct |
Low |
0.4192 |
0.9384 |
Medium |
0.1989 |
0.2603 |
High |
0.3077 |
0.3282 |
18.15.2.2.1 Glacial Lake Superior Plain
When the site probability model is applied to the Glacial Lake Superior Plain subsection 66.67 percent of all sites, excluding single artifacts, are in the high and medium site potential areas, which constitute 15.01 percent of landscape (Table 8.15.4). This produces a strong overall gain statistic of 0.77486 (Table 8.6.10). This model performs similar to both combined preliminary models when applied to this subsection.
Table 8.15.4. Evaluation of Glacial Lake Superior Plain Portion of Combined Site Probability Model for Glacial Lake Superior Plain/ North Shore Highlands/ Nashwauk Uplands Subsections.
Region (30 meter cells) |
Random Points |
Negative Survey Points |
Modeled Sites |
|||||
# |
% |
# |
% |
# |
% |
# |
% |
|
Low |
437,216 |
82.59 |
82 |
85.42 |
35 |
34.65 |
2 |
33.33 |
Medium |
54,566 |
10.31 |
10 |
10.42 |
27 |
26.73 |
||
High |
24,881 |
4.70 |
4 |
4.17 |
36 |
35.64 |
4 |
66.67 |
Water |
5,660 |
1.07 |
0 |
0 |
1 |
0.99 |
0 |
0 |
Steep Slopes |
7,088 |
1.34 |
0 |
0 |
2 |
1.98 |
0 |
0 |
Mines |
0 |
0 |
0 |
0 |
0 |
0 |
0 |
0 |
Total |
529,411 |
100 |
96 |
100 |
101 |
100 |
6 |
100 |
The portion of the database from this subsection included only 6 sites that were not single artifacts. The percent agreement of the combined models within the Glacial Lake Superior Plain subsection was very high (90 percent). However, the Kappa statistic, which is adjusted for the amount of agreement expected by chance alone, was only 0.16919 within this subsection. The conditional Kappa statistics (Table 8.15.5) are extremely low for the medium and high site potential zones, implying that these zones are not located with much certainty.
Table 8.15.5. Conditional Kappa Values for the Glacial Lake Superior Plain Portion of the Site Probability Model, Glacial Lake Superior Plain/ North Shore Highlands/ Nashwauk Uplands Subsections.
Class |
Ki |
Proportion Correct |
Low |
0.3896 |
0.9770 |
Medium |
0.0678 |
0.0946 |
High |
0.1016 |
0.1096 |
18.15.2.2.2 North Shore Highlands
When the site probability model is applied to the North Shore Highlands subsection 86.36 percent of all sites, excluding single artifacts, are in the high and medium site potential areas, which constitute 25.32 percent of landscape (Table 8.15.6). This produces a strong overall gain statistic of 0.70681. This model performs better in all respects than both combined preliminary models when applied to this subsection.
Table 8.15.6. Evaluation of North Shore Highlands Portion of Combined Site Probability Model for Glacial Lake Superior Plain/ North Shore Highlands/ Nashwauk Uplands Subsections.
Region (30 meter cells) |
Random Points |
Negative Survey Points |
Modeled Sites |
|||||
# |
% |
# |
% |
# |
% |
# |
% |
|
Low |
3,677,454 |
72.94 |
844 |
73.71 |
329 |
51.33 |
4 |
9.09 |
Medium |
902,879 |
17.91 |
210 |
18.34 |
126 |
19.66 |
4 |
9.09 |
High |
373,398 |
7.41 |
73 |
6.38 |
177 |
27.61 |
34 |
77.27 |
Water |
35,331 |
0.70 |
10 |
0.87 |
5 |
0.78 |
2 |
4.55 |
Steep Slopes |
52,707 |
1.05 |
8 |
0.70 |
4 |
0.62 |
0 |
0 |
Mines |
0 |
0 |
0 |
0 |
0 |
0 |
0 |
0 |
Total |
5,041,769 |
100 |
1145 |
100 |
641 |
100 |
44 |
100 |
The portion of the database from this subsection included only 44 sites that were not single artifacts. The percent agreement of the combined models within the North Shore Highlands subsection was significantly higher than for the subsection model (84 percent vs. 49 percent). This indicates a higher level of confidence in the combined model for North Shore Highlands. The Kappa statistic, which is adjusted for the amount of agreement expected by chance alone, for these models was 0.32195, which is below average. The conditional Kappa statistics (Table 8.15.7) are very low for the high and medium site potential zones.
Table 8.15.7. Conditional Kappa Values for the North Shore Highlands Portion of the Site Probability Model, Glacial Lake Superior Plain/ North Shore Highlands/ Nashwauk Uplands Subsections.
Class |
Ki |
Proportion Correct |
Low |
0.4365 |
0.9333 |
Medium |
0.2007 |
0.2713 |
High |
0.3307 |
0.3509 |
18.15.2.2.3 Nashwauk Uplands
When the site probability model is applied to the Nashwauk Uplands subsection, 88.89 percent of all sites, excluding single artifacts, are in the high and medium site potential areas, which constitute 21.1 percent of landscape (Table 8.15.8). This produces a strong overall gain statistic of 0.76263. This model performs better in all respects than both the combined preliminary models when applied to this subsection and than the subsection individual preliminary models.
Table 8.15.8. Evaluation of Nashwauk Uplands Portion of Combined Site Probability Model for Glacial Lake Superior Plain/ North Shore Highlands/ Nashwauk Uplands Subsections.
Region (30 meter cells) |
Random Points |
Negative Survey Points |
Modeled Sites |
|||||
# |
% |
# |
% |
# |
% |
# |
% |
|
Low |
4,397,462 |
72.09 |
1001 |
71.25 |
179 |
74.27 |
4 |
11.11 |
Medium |
951,896 |
15.60 |
237 |
16.87 |
39 |
16.18 |
11 |
30.56 |
High |
335,765 |
5.50 |
74 |
5.27 |
11 |
4.56 |
21 |
58.33 |
Water |
78,018 |
1.28 |
12 |
0.85 |
12 |
4.98 |
0 |
0 |
Steep Slopes |
4905 |
0.08 |
3 |
0.21 |
0 |
0 |
0 |
0 |
Mines |
332,182 |
5.45 |
78 |
5.55 |
0 |
0 |
0 |
0 |
Total |
6,100,228 |
100 |
1405 |
100 |
241 |
100 |
36 |
100 |
The portion of the database from this subsection included only 36 sites that were not single artifacts. The percent agreement of the combined models within the Nashwauk Uplands subsection was lower than for the subsection model (87 percent vs. 100 percent). However, the preliminary subsection models had only one variable each. The Kappa statistic, which is adjusted for the amount of agreement expected by chance alone, for the combined subsection models was 0.31449 within the Nashwauk Uplands. The conditional Kappa statistics (Table 8.15.9) are quite low for the medium and high site potential zones.
Table 8.15.9. Conditional Kappa Values for the Nashwauk Uplands Portion of the Site Probability Model, Glacial Lake Superior Plain/ North Shore Highlands/ Nashwauk Uplands subsections.
Class |
Ki |
Proportion Correct |
Low |
0.4002 |
0.9392 |
Medium |
0.1998 |
0.2564 |
High |
0.3116 |
0.3327 |
8.15.2.3 Interpretation
There are 14 variables in the site probability model for Glacial Lake Superior Plain-North Shore Highlands-Nashwauk Uplands including one topographic, six hydrologic, and seven vegetation variables.
8.15.2.3.1 Differences between Modeled Sites and Random Points for Individual Model Variables
Half of these variables have correlation coefficients of 0.3 or greater with modeled sites (Table 8.15.10). A comparison of the means and histograms indicates substantial differences between sites and random points for two variables. The average site distance to the nearest large lake (Figure 8.15.8a) is 575 meters whereas the random point mean is 3,660 meters. Vertical distance to permanent water (Figures 8.15.4.a and 8.15.10c) averages 10.44 feet for sites and 30.69 feet for random points. Sites are further from the nearest swamp (Figure 8.15.8c) than are random points.
The proximity of sites to river bottom forests (Figure 8.15.11c) and brushlands (Figure 8.15.11d) and their negative relationship to pine barrens or flats (Figure 8.15.11b) reflect regional geographic patterns. More sites have been recorded in the western and, particularly, southwestern portions of the region than in the north and east. River bottom forests are mapped only in the western portion of the modeled area, while the nearest brushlands are to the south of the modeled area. Pine barrens and flats are primarily along the northern boundary of the modeled area.
Although the correlations are weaker, sites are also closer to perennial rivers and streams (Figure 8.15.8b), confluences between perennial or intermittent streams and large rivers (Figure 8.15.8d), and Big Woods (Figure 8.15.11a), and somewhat further from intermittent streams (Figure 8.15.9a). Sites are also found in areas of higher vegetation diversity (Figures 8.15.4b and 8.15.12b), particularly away from Lake Superior.
Results of the Mann-Whitney U tests (Table 8.15.10) indicate that all except two of the model variables (distance to aspen-birch (Figure 8.15.10d) and mixed hardwoods and pine (Figure 8.15.12a) are significant at the 0.05 level. This indicates that modeled sites and random points are drawn from difference populations with respect to the model variables.
Table 8.15.10. Model Variable Statistics.
Glacial Lake Superior Plain-North Shore Highlands – Naswauk Uplands |
Modeled Sites |
Surveyed Areas |
Modeled Sites |
Sites in Low Prob |
Neg. Survey Points |
Random Points |
||||||
Model Variable |
Coeff |
Sign |
Coeff |
Sign |
Mean |
S.D. |
Mean |
S.D. |
Mean |
S.D. |
Mean |
S.D. |
Distance to nearest minor ridge or divide |
- |
- |
0.051 |
0.643 |
26.61 |
14.38 |
18.02 | 7.93 | 22.19 |
11.2 |
22.78 |
11.36 |
Prevailing orientation |
- |
- |
-0.143 |
0 |
87.2 |
57.24 |
50.5 | 38.37 | 75.8 |
53.44 |
91.03 |
57.99 |
Size of major watershed |
0.076 |
0.104 |
- |
- |
1788.33 |
466.04 |
1895.34 | 388.87 | 1739.01 |
413.06 |
1759.1 |
451.89 |
Distance to edge of nearest large wetland |
- |
- |
0.451 |
0 |
27.61 |
22.48 |
24.02 | 24.68 | 33.63 |
23.74 |
23.27 |
19.57 |
Distance to edge of nearest large lake |
-0.304 |
0 |
-0.384 |
0 |
23.97 |
27.78 |
49.44 | 26.89 | 50.81 |
31.17 |
60.5 |
24.69 |
Distance to edge of nearest perennial river or stream |
-0.089 |
0.001 |
0.014 |
0.433 |
22.42 |
16.61 |
18.61 | 14.69 | 28.04 |
16.19 |
28.17 |
15.73 |
Distance to edge of nearest swamp |
0.432 |
0.01 |
0.518 |
0 |
12.65 |
11.7 |
7.96 | 6.96 | 13.45 |
10.74 |
9.68 |
8.29 |
Distance to nearest confluence between perennial or intermittent streams and large rivers |
-0.152 |
0 |
-0.334 |
0 |
60.22 |
34.86 |
64.57 | 24.17 | 62.75 |
27.42 |
76.85 |
28.48 |
Distance to nearest intermittent stream |
-0.055 |
0.007 |
- |
- |
58.34 |
36.71 |
50.26 | 44.86 | 42.99 |
28.25 |
49.95 |
33.37 |
Distance to nearest lake inlet/outlet |
- |
- |
-0.218 |
0 |
37.09 |
21.52 |
34.59 | 15.80 | 42.92 |
18.14 |
45.98 |
16.83 |
Distance to nearest lake, wetland, organic soil, or stream |
- |
- |
0.087 |
0.001 |
6.58 |
9.75 |
5.30 | 6.12 | 8.17 |
6.44 |
9.05 |
7.34 |
Distance to nearest permanent wetland inlet/outlet |
- |
- |
-0.322 |
0 |
127.99 |
62.9 |
146.13 | 52.63 | 123.16 |
47.05 |
140.84 |
48.61 |
Size of nearest lake |
- |
- |
0.387 |
0 |
2421.95 |
3496.45 |
1624.85 | 4207.59 | 3344.73 |
5588.81 |
818.26 |
2487.5 |
Size of nearest permanent lake |
- |
- |
0.382 |
0 |
2449.26 |
3502.68 |
1624.85 | 4207.59 | 3351.21 |
5587.76 |
836.99 |
2512.9 |
Vertical distance to permanent water |
-0.387 |
0 |
- |
- |
10.44 |
21.49 |
18.00 | 20.01 | 45.93 |
71.42 |
30.69 |
59.8 |
Distance to aspen-birch |
0.26 |
0.851 |
0.27 |
0.02 |
21.76 |
23.45 |
8.54 | 18.71 | 22.38 |
29.17 |
21.93 |
23.45 |
Distance to Big Woods |
-0.285 |
0.022 |
- |
- |
235.22 |
113.06 |
256.70 | 132.15 | 232.59 |
118.57 |
258.89 |
101.62 |
Distance to pine barrens or flats |
0.335 |
0 |
0.47 |
0 |
111.06 |
65.29 |
75.04 | 56.15 | 119.01 |
53.16 |
88.63 |
54.51 |
Distance to river bottom forest |
-0.308 |
0.026 |
-0.224 |
0.003 |
191.51 |
103.97 |
222.80 | 119.59 | 203.77 |
99.07 |
215.58 |
87.21 |
Distance to brushlands |
-0.364 |
0.018 |
- |
- |
290.96 |
91.7 |
323.46 | 99.23 | 290.51 |
94.88 |
316.43 |
73.97 |
Distance to mixed hardwoods and pine |
-0.34 |
0.358 |
-0.367 |
0 |
82.69 |
51.81 |
81.32 | 50.32 | 66.24 |
39.83 |
77.05 |
44.53 |
Vegetation diversity within 1 km |
0.24 |
0 |
0.056 |
0.005 |
2.79 |
1.15 |
2.00 | 0.82 | 2.12 |
1.01 |
2.25 |
0.81 |
Distance to edge of nearest area of organic soils |
- |
- |
0.419 |
0 |
41.1 |
26.38 |
48.23 | 17.57 | 53.68 |
27.94 |
40.53 |
23.7 |
Distance to glacial lake sediment |
- |
- |
-0.037 |
0 |
191.9 |
94.21 |
220.52 | 120.80 | 215.6 |
89.83 |
198.69 |
98.99 |
On river terraces |
- |
- |
0.234 |
0 |
0 |
0 |
0 | 0 | 0.05 |
0.22 |
0 |
0.07 |
Frequency counts |
87 |
1100 |
87 |
10 |
987 |
2651 |
||||||
See Interpretation section for discussion of the statistics:
Coeff. = correlation coefficient
Sign. = significance of the Mann-Whitney U test
S.D. = standard deviation
Distances and areas are expressed in square roots of meters. Square the values in the table to get actual values.
8.15.2.3.2 Relationships between Variable Pairs
There are only four variable pairs in this model with correlation coefficients greater than 0.5, suggesting a low amount of data redundancy (Table 8.15.11). All relationships are positive and involve vegetation variables. Distance to brushlands is moderately associated with mixed hardwoods and pine (0.66), reflecting a slight southwestern trend in the distribution of the mixed forest. Distance to brushlands and distance to river bottom forest are strongly correlated (0.91) because of their similar distributions in the southwestern portion of the modeled area. Likewise, distance to river bottom forest is positively related to distance to mixed hardwoods and pine (0.54). As distance to Big Woods decreases, the size of major watershed also tends to decline, as the correlation coefficient of 0.52 indicates.
Table 8.15.11. Variable Correlation Matrix.
Glacial Lake Superior Plain-North Shore Highlands - Naswauk Uplands |
Size of major watershed |
Distance to edge of nearest large lake |
Distance to edge of nearest perennial river or stream |
Distance to edge of nearest swamp |
Distance to nearest confluence between perennial or intermittent streams and large rivers |
Distance to nearest intermittent stream |
Vertical distance to permanent water |
Distance to aspen-birch |
Size of major watershed |
1 |
|||||||
Distance to edge of nearest large lake |
-0.24 |
1 |
||||||
Distance to edge of nearest perennial river or stream |
-0.08 |
-0.23 |
1 |
|||||
Distance to edge of nearest swamp |
-0.1 |
-0.01 |
0.05 |
1 |
||||
Distance to nearest confluence between perennial or intermittent streams and large rivers |
-0.31 |
-0.2 |
0.45 |
-0.09 |
1 |
|||
Distance to nearest intermittent stream |
-0.16 |
0.11 |
0.21 |
0.07 |
0.26 |
1 |
||
Vertical distance to permanent water |
-0.13 |
0.35 |
0.08 |
0.07 |
-0.12 |
0.07 |
1 |
|
Distance to aspen-birch |
-0.02 |
0.07 |
-0.08 |
0.32 |
-0.23 |
0 |
0.06 |
1 |
Distance to Big Woods |
0.52 |
-0.28 |
-0.06 |
-0.1 |
-0.17 |
0.03 |
0.17 |
-0.04 |
Distance to brushlands |
0.38 |
-0.24 |
0.01 |
-0.15 |
-0.03 |
0.11 |
0.21 |
-0.09 |
Distance to mixed hardwoods and pine |
0.08 |
-0.23 |
-0.01 |
-0.4 |
0.02 |
0.08 |
0.09 |
-0.28 |
Distance to pine barrens or flats |
-0.31 |
0.43 |
-0.07 |
0.16 |
0.02 |
0.19 |
0.13 |
0.2 |
Distance to river bottom forest |
0.43 |
-0.26 |
-0.03 |
-0.04 |
-0.12 |
0.05 |
0.23 |
0 |
Vegetation diversity within 1 km |
0.11 |
-0.09 |
0.18 |
-0.15 |
0.08 |
-0.04 |
-0.28 |
-0.2 |
Distance to brushlands |
Distance to mixed hardwoods and pine |
Distance to pine barrens or flats |
Distance to river bottom forest |
Vegetation diversity within 1 km |
||||
Distance to brushlands |
1 |
|||||||
Distance to mixed hardwoods and pine |
0.66 |
1 |
||||||
Distance to pine barrens or flats |
-0.27 |
-0.24 |
1 |
|||||
Distance to river bottom forest |
0.91 |
0.54 |
-0.29 |
1 |
||||
Vegetation diversity within 1 km |
-0.35 |
-0.35 |
-0.09 |
-0.48 |
1 |
Refer to "Relationships between variable pairs" for interpretation of the table values.
8.15.2.3.3 Sites in Low Probability Areas
Another way to interpret the site probability model is to compare the mean values of sites in low potential areas with all modeled sites and random points (Table 8.15.10). Sites in low potential areas are nearest in average value to random points on most variables, including distance to edge of nearest large wetland, distance to edge of nearest large lake, distance to nearest intermittent stream, and distance to Big Woods. On some of these variables, they are more different from sites, on average, than are random points. Some of the greatest differences between all modeled sites and sites in low probability areas are found in distance to pine barrens or flats, distance to brushlands, and distance to river bottom forests, reflecting the more northerly distribution of the unpredicted sites. Sites in low probability areas tend towards more south-facing aspects than either modeled sites or random points. They are also closer to lake inlet/outlets, to aspen-birch, and to lakes, wetlands, organic soils, or streams and further from organic soils than modeled sites and random points.
Of the 10 sites in the low probability areas, two are artifact scatters and eight are lithic scatters. If all site types were predicted equally well, 11.63 percent of each site type would be expected to be in low probability areas. However, with 15.1 percent of all lithic scatters in low probability areas, it appears that the model is slightly less capable than predicting this type of site.
8.15.2.3.4 Relationships between Cultural Context, Descriptive, or Settlement Variables and Site Potential
The distribution of sites assigned to various cultural contexts was examined according to various culture contexts. The results indicate that there are insufficient numbers of sites to make an analysis of this kind meaningful.
8.15.3 Survey Probability Model
The survey probability model for the Glacial Lake Superior, North Shore Highlands, and Nashwauk Uplands subsections (Figure 8.15.5) classifies less than half the landscape as similar to the existing surveyed places. Four distinct zones of high and medium survey potential occur in the model They correspond to a combination of factors related to surface water and vegetation features and reflect the non-uniform distribution of negative survey points within the region.
The first zone of high and medium survey potential is located in the southern tip of the combined regions in the north eastern corner of Carlton County and south central St. Louis County. This zone extends north from the St. Louis River valley, where the river terraces have been well surveyed. The zone continues north along the St. Louis tributaries Midway, Hay Creek and Crystal Creek, follows the Pine River, surrounds Island, Boulder and Rice Lakes, and gradually terminates near the Little Cloquet River at the border between St. Louis and Lake Counties. Surveys in this area are associated with Trunk Highways 53, 33, and 210, CSAH 4, 45 and 48, Carlton County Road 119, and Rice Lake and Fish Lake Reservoirs.
The second zone is located in the southeast Lake county within the Manitou and Baptism watersheds. It extends inland from Lake Superior towards the Stony, the Sand, and the upper St. Louis rivers with a gradual decline of high and medium potential areas. It is associated with a 26 km survey along Minnesota State Highway 1 and a cluster of surveys in Superior National Forest.
The third zone, at the extreme western edge of the Nashwauk Uplands subsection in Itasca County, is associated with the Prairie River and its minor tributaries. Surveys here have been primarily along a 17 km stretch of Trunk Highway 169.
The fourth zone is a narrow (5-15 km) corridor, adjacent to the Lake Superior North Shore. It continues for 270 km along the shore from Duluth - Superior to the Canadian border. Surveys here extend along from Two Harbors north to Beaver Bay, from Silver Bay intermittently to Taconite Harbor, from Poplar Grove cemetery south nearly to Cascade Falls, and in the general vicinity of Grand Portage.
8.15.3.2 Evaluation
The survey probability model predicted surveyed places significantly better than by chance. It is based on 20 variables (Table 8.15.12), representing topography, vegetation, geomorphology, soils, and hydrology.
Table 8.15.12. Combined Survey Probability Model, Glacial Lake Superior Plain/ North Shore Highlands/ Nashwauk Uplands Subsections.
Intercept |
-1.218 |
|
ln (non-sites/sites) |
0.506023694 |
|
Variable |
Regression Coefficient |
Probability |
Distance to aspen-birch |
-0.01184682 |
100 |
Distance to edge of nearest large wetland |
0.009982554 |
91.3 |
Distance to edge of nearest area of organic soils |
0.01511200 |
100 |
Distance to edge of nearest large lake |
-0.01139860 |
100 |
Distance to edge of nearest perennial river or stream |
0.009908847 |
84.2 |
Distance to edge of nearest swamp |
0.05260564 |
100 |
Distance to glacial lake sediment |
0.01046323 |
100 |
Distance to mixed hardwoods and pines |
0.01131763 |
100 |
Distance to nearest confluence between perennial or intermittent streams and large rivers |
-0.01486789 |
100 |
Distance to nearest lake inlet/outlet |
0.01543972 |
100 |
Distance to nearest lake, wetland, organic soil, or stream |
-0.05408952 |
100 |
Distance to nearest minor ridge or divide |
0.01053247 |
29.8 |
Distance to permanent wetland inlets/outlets |
-0.01140345 |
100 |
Distance to pine barrens or flats |
0.004905764 |
100 |
Distance to river bottom forest |
-0.01253380 |
100 |
On river terraces |
1.653348 |
100 |
Prevailing orientation |
-0.002210463 |
68.9 |
Size of nearest lake |
0.001069472 |
100 |
Size of nearest permanent lake |
-0.0009940514 |
100 |
Vegetation diversity within 1 km |
0.2703741 |
100 |
When the GNLN survey probability model is applied to the GNUS subsections, 83.89 percent of all surveyed places are in the high and medium survey potential areas, which constitute 44 percent of landscape (Table 8.15.13). This produces a respectable gain statistic of 0.47557 (Table 8.6.14), which is acceptable for a survey probability model. This model performs slightly better than the preliminary survey models when applied to this subsection.
Table 8.15.13. Evaluation of Combined Survey Probability Model, Glacial Lake Superior Plain/ North Shore Highlands/ Nashwauk Uplands Subsections.
Region (30 meter cells) |
All random points |
All negative survey points |
All sites |
All sites and negative survey points |
||||||
# |
% |
# |
% |
# |
% |
# |
% |
# |
% |
|
Low |
6,020,295 |
51.58 |
1394 |
52.66 |
134 |
13.66 |
15 |
13.51 |
149 |
13.64 |
Medium |
1,693,551 |
14.51 |
403 |
15.22 |
147 |
14.98 |
15 |
13.51 |
162 |
14.84 |
High |
3,441,671 |
29.49 |
737 |
27.84 |
676 |
68.91 |
78 |
70.27 |
754 |
69.05 |
Water |
119009 |
1.02 |
23 |
0.87 |
6 |
0.61 |
3 |
2.7 |
9 |
0.82 |
Steep Slopes |
64700 |
0.55 |
12 |
0.45 |
6 |
0.61 |
0 |
0 |
6 |
0.55 |
Mines |
332182 |
2.85 |
78 |
2.95 |
12 |
1.22 |
0 |
0 |
12 |
1.10 |
Total |
11,671,408 |
100 |
2647 |
100 |
981 |
100 |
111 |
100 |
1092 |
100 |
This model was able to predict surveyed places with less precision than the site probability model was able to predict sites, indicating that sites are confined to only a portion of the total area surveyed. However, the models predicted surveyed places much better than by chance alone, indicating that surveys have not been randomly distributed in the region. Although the survey frequency of 0.104 surveyed places per square km is slightly below average for the state, but large numbers of surveyed places are strongly clustered along shorelines in certain parts of the subsection (Section 8.15.3.1).
The database included 1092 surveyed places. Two preliminary survey probability GNLN combined models had 79.48 percent agreement within GNUS combined subsections, 75 percent agreement within the Glacial Lake Superior Plain subsection, 62 percent agreement within the Nashwauk Uplands subsection, and 76 percent agreement within the North Shore Highlands subsection. The Kappa statistic for the combined GNUS models was 0.63578 (Table 8.6.13). This is higher than average within Minnesota, but not sufficient to indicate that the best possible model has been achieved. The conditional Kappa statistics (Table 8.15.14) are lowest for the medium and high survey potential zones, indicating that most uncertainty is in assignment between these zones. It is assumed that increasing the number of surveyed places for modeling will improve model stability, as will distributing more surveys throughout the undersurveyed areas.
Table 8.15.14. Conditional Kappa Values of the Survey Probability Model, Glacial Lake Superior Plain/ North Shore Highlands/ Nashwauk Uplands Subsections.
Class |
Ki |
Proportion Correct |
Low |
0.7053 |
0.8792 |
Medium |
0.4722 |
0.6045 |
High |
0.7328 |
0.7753 |
8.15.3.2.1 Glacial Lake Superior Plain
When the survey probability model is applied to the Glacial Lake Superior Plain subsection, 94.39 percent of all surveyed places are in the high and medium survey potential areas, which constitute 60.45 percent of landscape (Table 8.15.15). This produces a very weak gain statistic of 0.35957, which is acceptable for a survey probability model. This models performance only slightly exceeds that of the preliminary models.
Table 8.15.15. Evaluation of Glacial Lake Superior Plain Portion of Combined Survey Probability Model, Glacial Lake Superior Plain/ North Shore Highlands/ Nashwauk Uplands Subsections.
Region (30 meter cells) |
All random points |
All negative survey points |
All sites |
All sites and negative survey points |
||||||
# |
% |
# |
% |
# |
% |
# |
% |
# |
% |
|
Low |
196,626 |
37.14 |
35 |
36.46 |
3 |
2.97 |
0 |
0 |
3 |
2.80 |
Medium |
55,681 |
10.52 |
12 |
12.50 |
12 |
11.88 |
0 |
0 |
12 |
11.21 |
High |
264,356 |
49.93 |
49 |
51.04 |
83 |
82.18 |
6 |
100 |
89 |
83.18 |
Water |
5660 |
1.07 |
0 |
0 |
1 |
0.99 |
0 |
0 |
1 |
0.93 |
Steep Slopes |
7088 |
1.34 |
0 |
0 |
2 |
1.98 |
0 |
0 |
2 |
1.87 |
Mines |
0 |
0 |
0 |
0 |
0 |
0 |
0 |
0 |
0 |
0 |
Total |
529,411 |
100 |
96 |
100 |
101 |
100 |
6 |
100 |
107 |
100 |
The database for this subsection included 107 surveyed places. The percent agreement of the combined models within the Glacial Lake Superior Plain subsection was significantly higher than for the subsection model (75 percent vs. 69 percent). This indicates a higher level of confidence in the combined model for this subsection. The Kappa statistic for these models was 0.62355. The conditional Kappa statistics (Table 8.15.16) is quite high for the low survey potential zone. Thus, the uncertainty in this model is in distinguishing between the medium and high survey potential zones.
Table 8.15.16. Conditional Kappa Values for the Glacial Lake Superior Plain Portion of the Survey Probability Model, Glacial Lake Superior Plain/ North Shore Highlands/ Nashwauk Uplands subsections.
Class |
Ki |
Proportion Correct |
Low |
0.9809 |
0.9892 |
Medium |
0.3609 |
0.5244 |
High |
0.5680 |
0.7009 |
8.15.3.2.2 North Shore Highlands
When the survey probability model is applied to the North Shore Highlands subsection, 88.25 percent of all surveyed places are in the high and medium survey potential areas, which constitute 58.27 percent of landscape (Table 8.15.17). This produces a very weak gain statistic of 0.33972, which is acceptable for a survey probability model. This model performs only slightly better than the combined first preliminary model the preliminary models applied to this subsection.
Table 8.15.17. Evaluation of North Shore Highlands Portion of Combined Survey Probability Model, Glacial Lake Superior Plain/ North Shore Highlands/ Nashwauk Uplands Subsections.
Region (30 meter cells) |
All random points |
All negative survey points |
All sites |
All sites and negative survey points |
||||||
# |
% |
# |
% |
# |
% |
# |
% |
# |
% |
|
Low |
2,015,753 |
39.98 |
492 |
42.97 |
65 |
10.17 |
5 |
8.47 |
70 |
10.03 |
Medium |
819,290 |
16.25 |
191 |
16.68 |
69 |
10.80 |
7 |
11.86 |
76 |
10.89 |
High |
2,118,688 |
42.02 |
442 |
38.60 |
496 |
77.62 |
44 |
74.58 |
540 |
77.36 |
Water |
35,331 |
0.70 |
11 |
0.96 |
5 |
0.78 |
3 |
5.08 |
8 |
1.15 |
Steep Slopes |
52,707 |
1.05 |
9 |
0.79 |
4 |
0.63 |
0 |
0 |
4 |
0.57 |
Mines |
0 |
0 |
0 |
0 |
0 |
0 |
0 |
0 |
0 |
0 |
Total |
5,041,769 |
100 |
1145 |
100 |
639 |
100 |
59 |
100 |
698 |
100 |
The database for this subsection included 698 surveyed places. The percent agreement of the combined models within the North Shore Highlands subsection was significantly higher than for the subsection model (76 percent vs. 66 percent). This indicates a higher level of confidence in the combined model for this subsection. The Kappa statistic for these models was 0.619, which exceeds the statewide average. The conditional Kappa statistics (Table 8.15.18) are highest for the high survey potential zone, followed closely by the low survey potential zone. The uncertainty in this model is in sorting out the cells in the middle range of model values.
Table 8.15.18. Conditional Kappa Values for the North Shore Highlands Portion of the Survey Probability Model, Glacial Lake Superior Plain/ North Shore Highlands/ Nashwauk Uplands Subsections.
Class |
Ki |
Proportion Correct |
Low |
0.6216 |
0.7886 |
Medium |
0.4841 |
0.6438 |
High |
0.7527 |
0.8143 |
8.15.3.2.3 Nashwauk Uplands
When the survey probability model is applied to the Nashwauk Uplands subsection, 69.33 percent of all surveyed places are in the high and medium survey potential areas, which constitute 30.77 percent of landscape (Table 8.15.19). This produces a respectable gain statistic of 0.55618. This model performs only slightly better than the preliminary models applied to this subsection.
Table 8.15.19. Evaluation of Nashwauk Uplands Portion of Combined Survey Probability Model, Glacial Lake Superior Plain/ North Shore Highlands/ Nashwauk Uplands Subsections.
Region (30 meter cells) |
All random points |
All negative survey points |
All sites |
All sites and negative survey points |
||||||
# |
% |
# |
% |
# |
% |
# |
% |
# |
% |
|
Low |
3,807,916 |
62.42 |
867 |
61.66 |
66 |
27.39 |
10 |
21.74 |
76 |
26.48 |
Medium |
818,580 |
13.42 |
200 |
14.22 |
66 |
27.39 |
8 |
17.39 |
74 |
25.78 |
High |
1,058,627 |
17.35 |
246 |
17.50 |
97 |
40.25 |
28 |
60.87 |
125 |
43.55 |
Water |
78,018 |
1.28 |
12 |
0.85 |
0 |
0 |
0 |
0 |
0 |
0 |
Steep Slopes |
4905 |
0.08 |
3 |
0.21 |
0 |
0 |
0 |
0 |
0 |
0 |
Mines |
332,182 |
5.45 |
78 |
5.55 |
12 |
4.98 |
0 |
0 |
12 |
4.18 |
Total |
6,100,228 |
100 |
1406 |
100 |
241 |
100 |
46 |
100 |
287 |
100 |
The database for this subsection included 287 surveyed places. The percent agreement of the combined models within the Nashwauk Uplands subsection was significantly higher than for the subsection model (83 percent vs. 62 percent). This indicates a higher level of confidence in the combined model for Nashwauk Uplands. The Kappa statistic for these models was 0.61565. The conditional Kappa statistics (Table 8.15.20) are quite high for the low survey potential zone. This implies that the greatest uncertainty in this model is in the distinction between medium and high site potential.
Table 8.15.20. Conditional Kappa Values for the Nashwauk Uplands Portion of the Survey Probability Model, Glacial Lake Superior Plain/ North Shore Highlands/ Nashwauk Uplands Subsections.
Class |
Ki |
Proportion Correct |
Low |
0.7388 |
0.9306 |
Medium |
0.4665 |
0.5725 |
High |
0.6814 |
0.7028 |
8.15.2.3 Interpretation
Twenty variables are involved in the construction of the survey probability model. Seven of these are also included in the site probability model. Of these 20 variables, two are topographic in nature, 10 are hydrologic, five are vegetation, and three are soil or landform-related (Table 8.15.10). Nine of the variables have correlation coefficients of 0.3 and above, a relatively high number.
Correlation coefficient for surveyed places exceed 0.3 for eight variables. Four of these variables do not appear in the site probability model. They are distance to edge of nearest large wetland (Figure 8.15.7d), distance to nearest permanent wetland inlet/outlet (Figure 8.15.9d), size of nearest lake (Figure 8.15.10a), and size of nearest permanent lake (Figure 8.15.10b). Negative survey points are, on average, farther from swamps and other wetlands, than are either sites or random points. On the other hand, they are closer to permanent wetland inlet/outlets. Negative survey points are closer to larger lakes and permanent lakes than sites or random points, probably reflecting the reservoir surveys in this region.
Other significant variables appearing in this model that were not in the site probability model include prevailing orientation (Figure 8.15.7b), distance to nearest lake inlet/outlet (Figure 8.15.9b), distance to nearest lake, wetland, organic soil, or stream (Figure 8.15.9c), distance to edge of nearest area of organic soils (Figure 8.15.12c), distance to glacial lake sediment (Figure 8.15.12d), and on river terraces (Figure 8.15.13a). Compared to both modeled sites and random points, negative survey points have a more southerly aspect, are farther from areas of organic soils and glacial lake sediment, and are more likely to be on river terraces. Negative survey points are more similar to random points than modeled sites for distance to nearest lake inlet/outlet, distance to nearest lake, wetland, organic soil, or stream.
The Mann-Whitney U tests indicate that there is a significant difference at the 0.05 level in the distribution of values for survey areas and random points on all except two variables, distance to nearest minor ridge or divide (Figure 8.15.7a) and distance to nearest perennial river or stream (Table 8.15.10). These results mean that survey and random points are not drawn from the same population, pointing to a distinct non-random aspect in where surveys have been conducted.
8.15.4 Survey Implementation Model
The survey implementation model for the Glacial Lake Superior Plain/North Shore Highlands/Nashwauk Uplands subsections indicates that 45.32 percent of the land area is categorized as unknown because of inadequate survey (Figure 8.15.6 and Table 8.15.21). These areas are away from the Lake Superior shore. They include some areas with poor accessibility, but most are crossed by state, county, and township roads. Fifty-two percent of the unknown area is in Superior National Forest. Only four test sites (15.38 percent) came from the unknown area.
High site probability and high survey probability coincide very closely in this region. Consequently, the high site potential class occupies a much larger area than the suspected high and possibly high classes. Low and possibly low probability classes occupy 27.61 percent of the landscape. These are typically found away from water bodies.
Table 8.15.21. Evaluation of Survey Implementation Model, Glacial Lake Superior Plain/ North Shore Highlands/ Nashwauk Uplands Subsections.
Region (30 meter cells) |
Random Points |
Negative Survey Points |
Single Artifacts |
Sites |
||||||
# |
% |
# |
% |
# |
% |
# |
% |
# |
% |
|
Unknown |
5,289,563 |
45.32 |
1215 |
45.90 |
126 |
12.84 |
2 |
8.00 |
4 |
4.65 |
Possibly Low |
1,303,832 |
11.17 |
311 |
11.75 |
135 |
13.76 |
0 |
0 |
0 |
0 |
Low |
1,918,737 |
16.44 |
402 |
15.19 |
280 |
28.54 |
0 |
0 |
6 |
6.98 |
Suspected Medium |
632,444 |
5.42 |
155 |
5.86 |
7 |
0.71 |
1 |
4.00 |
5 |
5.81 |
Possibly Medium |
311.362 |
2.67 |
74 |
2.80 |
9 |
0.92 |
3 |
12.00 |
4 |
4.65 |
Medium |
965,535 |
8.27 |
227 |
8.58 |
175 |
17.84 |
2 |
8.00 |
7 |
8.14 |
Suspected High |
98,288 |
0.84 |
24 |
0.91 |
1 |
0.10 |
0 |
0 |
3 |
3.49 |
Possibly High |
78,357 |
0.67 |
18 |
0.68 |
3 |
0.31 |
1 |
4.00 |
7 |
8.14 |
High |
557,399 |
4.78 |
108 |
4.08 |
221 |
22.53 |
16 |
64.00 |
47 |
54.65 |
Water |
119,009 |
1.02 |
23 |
0.87 |
6 |
0.61 |
0 |
0 |
3 |
3.49 |
Steep Slopes |
64,700 |
0.55 |
12 |
0.45 |
6 |
0.61 |
0 |
0 |
0 |
0 |
Mines |
332,182 |
2.85 |
78 |
2.95 |
12 |
1.22 |
0 |
0 |
0 |
0 |
Total |
11,671,408 |
100 |
2647 |
100 |
981 |
100 |
25 |
100 |
87 |
100 |
No geomorphic models have been developed for these three subsections. Much of the area is covered by glacial deposits, but some areas of glacial lake sediment and organic deposits may have potential for buried sites.
8.16 Hardwood Hills
8.17 Laurentian Highlands
8.18 Littlefork-Vermilion Uplands
8.19 Mille Lacs Uplands
8.20 Minnesota River Prairie
8.21 Oak Savanna
8.22 Pine Moraines & Outwash Plains
8.23 Red River Prairie
8.24 Rochester Plateau
8.25 St. Croix Moraines and Outwash Plains (Twin Cities Highlands)
8.26 St. Louis Moraines/ Tamarack Lowlands
8.27 Conclusion
References
The Mn/Model Final Report (Phases 1-3) is available on CD-ROM. Copies may be requested by visiting the contact page.

Acknowledgements
MnModel was financed with Transportation Enhancement and State Planning and Research funds from the Federal Highway Administration and a Minnesota Department of Transportation match.
Copyright Notice
The MnModel process and the predictive models it produced are copyrighted by the Minnesota Department of Transportation (MnDOT), 2000. They may not be used without MnDOT's consent.