Quick Links
Chapters
- Management Summary
- Research Design & Time Line
- Environment & Native American Culture
- GIS Design
- Archaeological Database
- Archaeological & Environmental Variables
- Model Development & Evaluation
- Model Results & Interpretation
- Project Applications
- Model Enhancements
- Model Implementation
- Landscape Suitability Models
- Summary & Recommendations
Appendices
- Archaeological Predictive Modeling: An Overview
- GIS Standards & Procedures
- Archaeology Field Survey Standards, Procedures & Rationale
- Archaeology Field Survey Results
- Geomorphology Survey Profiles, Sections, & Lists
- Building a Macrophysical Climate Model for the State of Minnesota
- Correspondence of Support for Mn/Model
- Glossary
- List of Figures
- List of Tables
- Acknowledgments
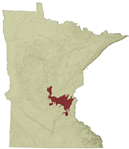
8.8 ANOKA SAND PLAIN SUBSECTION OF MINNESOTA & NE IOWA MORAINAL SECTION
8.8.2 Site Probability Model
8.8.3 Survey Probability Model
8.8.4 Survey Implementation Model
8.8.5 Other Models
This regional model report is organized as described in Sections 8.2.1 through 8.4.1. Refer to these sections of the report for explanations of the tables, variables, and statistics.
Anoka Sand Plain is a subsection of the Minnesota and Northeast Iowa Morainal Section of the Eastern Broadleaf Forest Province (Figure 8.1) (Minnesota DNR 1998). It is dominated by a flat, sandy lake plain, with sandy terraces along the Mississippi River (Figure 8.8.1a).
Boundaries of this subsection follow the extent of the Anoka Sandplain landform (Figure 8.8.2.a), which was created by glacial outwash of the Grantsburg sublobe of the Des Moines Lobe (Wright 1972a). In addition to the outwash substrates, an end moraine is situated in the center of the subsection (Figure 8.8.2.a). The terraced Mississippi River valley forms the western and a short section of the most southern border. Ice contact sediments occur south of the river. Moraines, in adjacent subsections, surround the outwash plain. An interface of the sand plain with a Superior Lobe ground moraine defines the northern boundary of the subsection.
The outwash plain topography ranges from level to gently rolling. The predominant soils (Figure 8.8.2.b) are sandy and well-drained to excessively well-drained. Organic soils, left from ice block depressions, are distributed throughout the outwash plain. These include a large deposit in eastern Anoka County and another in northern Morrison County. Drainage from many of the smaller depressions is in a southwesterly direction to the Mississippi River. Poorly drained alluvial soils are located in the Mississippi River Valley.
Historic vegetation patterns (Figure 8.8.1.b) reflect the soil characteristics. Oak barrens and openings, as well as brush prairie, were the dominant vegetation on the droughty upland soils of the sand plain in the 19th century. Wet prairies and conifer bogs and swamps occurred on the poorly drained depressions. Wet prairie was also recorded in the Mississippi River valley. Prairie was a major vegetation component in a swath paralleling the Mississippi River valley, occurring on the north and south sides of the river. Aspen-oak woodland, with small inclusions of Big Woods, was found on the loam soils of the end moraine in the center of the subsection. On the ice contact sediments west and south of the Mississippi River, the dominant vegetation was Big Woods (maple, elm, and basswood). The transition from oak barrens within the sand plain, to Big Woods on the ground moraine of the Superior Lobe in the Mille Lacs Uplands was very distinct.
8.8.2.1 Description
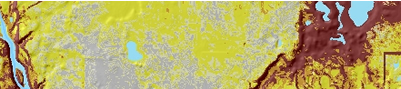
Areas of high and medium site potential correspond to a combination of factors related to surface water features (Figure 8.8.3). Rivers and their associated relief (e.g. bluffs and ridges) exhibit consistent patterns of high and medium site potential. Lakes larger than approximately 350 acres are associated with high and medium site potential in at least 20 locations in the subsection.
The most prominent feature associated with high and medium site potential is the Mississippi River. The high and medium site potential zones in the creek and river valleys are characterized by proximity to water and sharp changes in elevation. Along the Mississippi River, the area of high site potential follows the river shoreline and terraces. The variable on river terraces occurs in the model. The high site potential zone ends abruptly at the boundary between terrace and the outwash features. Minnehaha Creek, a tributary of the Mississippi River, is outlined as a high potential zone through southeastern Hennepin County. Areas of high to medium site potential dominate the extreme southern part of the subsection along the Mississippi River and along the lower reaches of the Minnesota River.
Other rivers are also designated as areas of high and medium site potential, though to a lesser extent. In east central Stearns County, the Sauk River flows through the middle lobe of three lobes of outwash material that extend to the southwest. Wide areas of high and medium potential surround the river at its most southern point in the subsection. The high and medium site potential zone narrows to the width of the river corridor as the river nears its confluence with the Mississippi.
Scattered areas of high and medium site potential characterize the eastern portion of Sherburne County and include the Elk and St. Francis rivers and Rice, Elk, and Fremont lakes. There is a subtle decrease in the extent of high and medium potential associated with water features in the Becker and Orrock quadrangles. High resolution (1:24,000 scale) digital elevation data were absent from these quadrangles, therefore the terrain features are less defined. This is also an area of wetlands, with no well-developed streams and few lakes. Portions of the Rum River, (starting at the north central border of the subsection in south Mille Lacs County) as it flows through southeastern Mille Lacs, central Isanti, and western Anoka Counties, are also areas of high and medium site potential. Zones of high and medium potential border Cedar Creek, a tributary of the Rum River, as it flows to the southwest through north central Anoka County.
The Clearwater River has a wide band of high site potential area surrounding it. The river forms a partial border between Stearns and Wright counties and flows from Clearwater Lake to the Mississippi River. In the northeastern portion of the subsection, a narrow zone of medium to high site potential borders the Sunrise River in Chisago County.
Zones of high and medium site potential around large (greater than 350 acres) lakes coincide with the pattern of the variable size of nearest lake in at least 20 instances throughout the entire subsection. In the northwest part of the subsection, in southern Morrison County, the zone of high potential surrounds three lakes (Rice, Skunk, and Pierz) and then follows the Platte River and Little Rock Creek south to the Mississippi. In the north central part of the subsection, high and medium site potential surrounds Green Lake in Isanti County. Areas of high site potential fringe several lakes in northwestern Wright County, including Clearwater, Twin, and Sylvia. A large area of high and medium potential is present in the Linwood and Coon Lakes area of northeastern Anoka County. Numerous areas of medium to high site potential characterize the chain of lakes stretching north from northern Ramsey County, through southeastern Anoka County, and into northwestern Washington County.
Throughout the subsection there are conspicuous straight east-west and north-south lines of high and medium probability. These lines are artifacts of the edges of adjacent quad sheets and should not be considered predictive features. They represent boundaries between 1:250,000 scale and 1:24,000 scale quads and between adjacent 1:24,000 scale quads that were digitized using different methods. They have been assigned high site potential values because of apparent (not real) elevation changes from one quad sheet to the next. These elevation differences are data errors.
8.8.2.2 Evaluation
The site probability model (Figure 8.8.3) performed very well. It is based on 12 variables (Table 8.8.1) representing topography (Figure 8.8.1.a), vegetation (Figure 8.8.1.b), soils (Figure 8.8.2.b), and hydrology (Figure 8.8.1.a).
Table 8.8.1: Site Probability Model, Anoka Sand Plain Subsection
Intercept |
3.692 |
|
ln (nonsites/sites) |
1.2196 |
|
Variable |
Regression Coefficient |
Probability |
Direction to nearest water or wetland (sine) |
-0.3785032 |
91.3 |
Distance to edge of nearest large lake |
-0.02199266 |
100.0 |
Distance to edge of nearest large wetland |
-0.02093221 |
100.0 |
Distance to edge of nearest perennial river or stream |
-0.04597187 |
100.0 |
Distance to hardwoods |
-0.01736736 |
100.0 |
Distance to mixed hardwoods and pine |
-0.011321424 |
91.8 |
Distance to nearest lake, wetland, organic soil, or stream |
-0.05324623 |
100.0 |
Distance to paper birch |
0.01679916 |
100.0 |
Height above surroundings |
0.09829705 |
100.0 |
On river terraces |
1.591608 |
100.0 |
Size of major watershed |
-0.001056506 |
64.5 |
Size of nearest lake |
0.001102178 |
100.0 |
In this model, 83.98 percent of all known sites are in high/medium site potential areas, which make up only 24.56 percent of landscape (Table 8.8.2). This produces a strong gain statistic of 0.70755 (Table 8.6.11). The database included 337 sites that were not single artifacts. This is about an average number of sites for the Phase 3 regions, but is small enough to reduce confidence in the model results. The model test performed well, with 81.58 percent of new sites in the high and medium probability areas. The test gain statistic is 0.69891.
Table 8.8.2. Evaluation of Site Probability Model, Anoka Sand Plains Subsection.
Region |
Random Points |
Negative Survey Points |
Modeled Sites |
Test Sites |
||||||
# |
% |
# |
% |
# |
% |
# |
% |
# |
% |
|
Low |
4183122 |
73.72 |
837 |
73.36 |
375 |
57.43 |
52 |
15.43 |
6 |
15.79 |
Medium |
557369 |
9.82 |
115 |
10.08 |
98 |
15.01 |
34 |
10.09 |
3 |
7.89 |
High |
836459 |
14.74 |
162 |
14.20 |
179 |
27.41 |
249 |
73.89 |
28 |
73.68 |
Water |
97618 |
1.72 |
27 |
2.37 |
1 |
0.15 |
1 |
0.30 |
1 |
2.63 |
Steep Slopes |
90 |
0 |
0 |
0 |
0 |
0 |
1 |
0.30 |
0 |
0 |
Mines |
0 |
0 |
0 |
0 |
0 |
0 |
0 |
0 |
0
|
0 |
Total |
5674658 |
100 |
1141 |
100 |
653 |
100 |
337 |
100 |
38 |
100 |
Two preliminary models, using different halves of the database, had only 79.40 percent agreement. The Kappa statistic, which is adjusted for the amount of agreement expected by chance alone, was only 0.49125 (Table 8.6.11). The conditional Kappa statistics (Table 8.8.3) are highest for the low site potential zone and lowest for medium site potential. This indicates that the greatest instability in the model is in the assignment of cells to medium probability.
Table 8.8.3. Conditional Kappa Values for Preliminary Site Probability Models, Anoka Sand Plain Subsection.
Class |
Ki |
Proportion Correct |
Low |
0.5910 |
0.8978 |
Medium |
0.1340 |
0.2206 |
High |
0.5969 |
0.6573 |
Doubling the number of sites for modeling may improve confidence in the model and model stability. Another refinement that could improve the model, as well as improve model confidence, is replacing the 1:250,000 DEMs with 1:24,000 DEMs when they are available.
8.8.2.3 Interpretation
There are 12 variables used to construct the site probability model, half of which are related to surface hydrology. The remaining variables represent vegetation (3), topography (2), and landforms (1).
8.8.2.3.1 Differences between Modeled Sites and Random Points for Individual Model Variables
In correlations with modeled sites, only three variables (height above surroundings (Figures 8.8.4.a and 8.8.7c) , distance to nearest large lake (Figure 8.8.9b), and size of nearest lake (Figure 8.8.9c) have moderately high coefficients (Table 8.8.4). Sites in the Anoka Sand Plain are higher by an average of about six feet (Figure 8.8.7c), are situated closer to large lakes by about 1900 meters (Figure 8.8.9b), and near lakes about 400 acres larger than those nearest to random points or nonsites (Figure 8.8.9c). However, in this subsection, large stretches of the Mississippi River are coded as lakes in the National Wetlands Inventory, so the model must be interpreted to mean that sites are near large rivers or lakes. Likewise, many of the highest values for height above surroundings are associated with bluffs along the Mississippi River and its tributary streams.
Lower correlations with modeled sites were calculated for two hydrologic (distance to nearest large wetland, distance to nearest perennial river or stream) and two vegetation variables (distance to hardwoods, distance to mixed hardwoods and pine). Sites tend to be about 400 to 600 meters closer to large wetlands and streams (Figures 8.8.8b and 8.8.8c) and approximately 1400 to 2900 meters nearer hardwoods and pines (Figures 8.8.10a and 8.8.10b)compared to random points or nonsites. Areas of mixed hardwoods and pine are peripheral to the region. Some of the lowest values correspond to a cluster of 76 sites associated with a chain of lakes in southeastern Anoka County. About half of these sites are lakeshore, island, or peninsula sites, while the remainder are mostly on uplands.
The relationships between site probability and nine of the twelve variables are significant at the 0.05 level, as measured by the Mann-Whitney U test (Table 8.8.4). With respect to these variables, modeled sites and random points are not drawn from the same population. However, there is not a significant difference between sites and random points on three variables (size of major watershed (Figure 8.8.7d ), distance to paper birch (Figures 8.8.4b and 8.8.10c ), on river terraces (Figure 8.8.11c)). Consequently, it is likely that they contribute information to the model that is meaningful only in conjunction with other variables.
Although its univariate correlation with modeled sites is not statistically significant, the histogram for direction to nearest water or wetland (Figure 8.8.8a) illustrates an interesting trend. While the preponderance of random points are south of water and wetlands and negative survey points are mostly likely to be either north (value = -1) or south (value = 1) of those features, modeled sites show the greatest proclivity to be either east or west (value = 0) of water and wetlands. It would be informative to use the cosine of direction to water and wetlands for this subsection in the next modeling phase. This could tell us whether prehistoric people had a location preference for locations protected from fire. The final model variable, distance to nearest lake, wetland, organic soil, or stream (Figure 8.8.8d) underscores the importance of hydrologic features in general to the site probability model.
Table 8.8.4. Model Variable Statistics.
Anoka Sand Plain |
Modeled Sites |
Surveyed Areas |
Modeled Sites |
Sites in Low Prob. |
Negative Survey Points |
Random Points |
||||||
Model Variable |
Coeff. |
Sign. |
Coeff. |
Sign. |
Mean |
S.D. |
Mean |
S.D. |
Mean |
S.D. |
Mean |
S.D. |
Distance to nearest major ridge or divide |
- |
- |
-0.023 |
0.004 |
80.05 |
31.69 |
79.99 |
31.1 |
70.66 |
32.53 |
78.42 |
32.6 |
Elevation |
- |
- |
-0.207 |
0 |
935.24 |
77.97 |
956.5 |
73 |
942.03 |
67.62 |
956.7 |
75.52 |
Height above surroundings |
0.419 |
0 |
0.576 |
0 |
10.13 |
10.73 |
4.42 |
3.85 |
6.96 |
7.4 |
4.35 |
5.59 |
Size of major watershed |
-0.068 |
0.318 |
- |
- |
1655.17 |
224.93 |
1702.75 |
226.82 |
1702.14 |
267.87 |
1670.7 |
250.63 |
Direction to nearest water or wetland (sine) |
-0.061 |
0.013 |
-0.095 |
0 |
0.16 |
0.7 |
0.06 |
0.64 |
0.08 |
0.74 |
0.26 |
0.74 |
Distance to edge of nearest large wetland |
-0.283 |
0 |
- |
- |
25.25 |
21.27 |
33.57 |
25.87 |
26.16 |
16.79 |
31.73 |
20.79 |
Distance to edge of nearest perennial river or stream |
-0.266 |
0 |
-0.441 |
0 |
21.23 |
14.92 |
33.33 |
16.85 |
26.22 |
14.91 |
32.23 |
15.62 |
Distance to nearest lake, wetland, organic soil, or stream |
-0.155 |
0 |
-0.278 |
0 |
7.06 |
5.39 |
9.14 |
6.33 |
8.37 |
6.12 |
10.21 |
8.16 |
Distance to nearest permanent wetland inlet/outlet |
- |
- |
-0.145 |
0 |
185.73 |
71.83 |
211.79 |
61.79 |
184.8 |
56.43 |
200.24 |
69.97 |
Distance to edge of nearest large lake |
-0.38 |
0 |
- |
- |
37.55 |
31.33 |
56.76 |
30.57 |
55.42 |
23.83 |
57.39 |
24.86 |
Size of nearest lake |
0.424 |
0 |
0.366 |
0 |
649.11 |
685.65 |
237.01 |
332.86 |
267.59 |
422.86 |
235.26 |
408.47 |
Distance to hardwoods |
-0.277 |
0 |
- |
- |
37.8 |
29.46 |
50.78 |
30.16 |
50.54 |
26.25 |
53.15 |
27.15 |
Distance to mixed hardwoods and pine |
-0.259 |
0 |
- |
- |
156.75 |
44.77 |
166.66 |
41.79 |
157.49 |
38.6 |
166.25 |
38.65 |
Distance to paper birch |
-0.122 |
0.324 |
- |
- |
67.76 |
23.43 |
65.81 |
21.53 |
64.22 |
21.44 |
68.31 |
23.14 |
Distance to pine barrens or flats |
- |
- |
0.071 |
0.039 |
289.72 |
43.1 |
283.61 |
43.44 |
283.94 |
40.4 |
283.54 |
41.69 |
Distance to glacial lake sediment |
- |
- |
-0.263 |
0 |
175.41 |
74.88 |
201.17 |
67.2 |
178.18 |
57.11 |
196.85 |
66.62 |
Distance to edge of nearest area of organic soils |
- |
- |
-0.211 |
0 |
34.54 |
23.78 |
42.77 |
28.76 |
29.41 |
18.1 |
38.32 |
23.83 |
On river terraces |
-0.12 |
0.224 |
- |
- |
0.2 |
0.4 |
0.29 |
0.46 |
0.08 |
0.28 |
0.17 |
0.38 |
Frequency counts |
337 |
1016 |
337 |
52 |
653 |
1141 |
||||||
See Interpretation section for documentation of the statistics:
Coeff. = correlation coefficient
Sign. = significance of the Mann-Whitney U test
S.D. = standard deviation
Distances and areas are expressed in square roots of meters. Square the values in the table to get actual values.
8.8.2.3.2 Relationships between Variable Pairs
There are only three variables in the site model that are moderately to highly correlated with each other (Table 8.8.5). Distance to nearest large lake is negatively associated with size of nearest lake (-0.72). As sites tend to be nearer to large lakes, distance would be expected to be inversely proportional to size. Distance to the nearest large lake is also positively correlated (0.56) with the variable on river terraces. This is an artifact of the data, where large wide stretches of the Mississippi River are coded as lakes. Naturally, the river and its terraces coincide. The presence of all three variables in the model may seem redundant, but it does serve to emphasize the importance of the Mississippi River and its terraces for site locations in this region.
Table 8.8.5. Variable Correlation Matrix.
Anoka Sand Plain |
Height above surroundings |
Size of major watershed |
Direction to nearest water or wetland (sine) |
Distance to edge of nearest large wetland |
Distance to edge of nearest large lake |
Distance to edge of nearest perennial river or stream |
Height above surroundings |
1 |
|||||
Size of major watershed |
0.06 |
1 |
||||
Direction to nearest water or wetland (sine) |
-0.18 |
-0.09 |
1 |
|||
Distance to edge of nearest large wetland |
0.13 |
-0.07 |
-0.07 |
1 |
||
Distance to edge of nearest large lake |
0.15 |
-0.07 |
-0.03 |
0.24 |
1 |
|
Distance to edge of nearest perennial river or stream |
-0.1 |
0.15 |
-0.09 |
-0.09 |
-0.28 |
1 |
Distance to nearest permanent wetland inlet/outlet |
0.02 |
0.04 |
0 |
0.4 |
0.36 |
-0.05 |
Size of nearest lake |
-0.09 |
0.06 |
0 |
-0.22 |
-0.72 |
0.27 |
Distance to hardwoods |
-0.13 |
0.04 |
0 |
-0.19 |
-0.11 |
0.09 |
Distance to mixed hardwoods and pine |
0.12 |
-0.07 |
-0.03 |
0.43 |
0.13 |
0.11 |
Distance to paper birch |
-0.01 |
0.14 |
-0.02 |
0.2 |
0.02 |
0.21 |
On river terraces |
0.06 |
-0.17 |
-0.02 |
0.37 |
0.56 |
-0.12 |
Distance to nearest permanent wetland inlet/outlet |
Size of nearest lake |
Distance to hardwoods |
Distance to mixed hardwoods and pine |
Distance to paper birch |
On river terraces |
|
Height above surroundings |
||||||
Size of major watershed |
||||||
Direction to nearest water or wetland (sine) |
||||||
Distance to edge of nearest large wetland |
||||||
Distance to edge of nearest large lake |
||||||
Distance to edge of nearest perennial river or stream |
||||||
Distance to nearest permanent wetland inlet/outlet |
1 |
|||||
Size of nearest lake |
-0.31 |
1 |
||||
Distance to hardwoods |
0 |
0.11 |
1 |
|||
Distance to mixed hardwoods and pine |
0.27 |
-0.08 |
-0.08 |
1 |
||
Distance to paper birch |
0.1 |
0 |
0.17 |
0.48 |
1 |
|
On river terraces |
0.21 |
-0.35 |
-0.14 |
0.31 |
0.11 |
1 |
Refer to "Relationships between variable pairs" for interpretation of the table values.
8.8.2.3.3 Sites in Low Probability Areas
Sites in the low probability area have variable means near the those of the random points for six variables and values closer to the site means for only three other variables (Table 8.8.4). For the remaining three variables, the average value of random points falls between modeled sites and sites in low potential areas. Overall, this indicates that sites falling in the low site potential areas of the Anoka Sand Plain, as defined by the model, are distributed more randomly with respect to environmental variables than are all modeled sites. That is, they are further from water, hardwoods and pines, and located in lower elevation settings compared to the total population of modeled sites.
Of the 52 sites in the low probability areas, 22 are lithic scatters, 14 are artifact scatters, three are mounds, 11 are other earthworks, one is rock art, and one is a trading post. If the model predicts all sites types equally well, 15.43 percent of each type should be found in low site potential areas. Mounds and earthworks are near the expected value, with 14 percent of these sites in low probability areas. Artifact scatters are underrepresented in low probability areas (10 percent of all artifact scatters), indicating that the model does a relatively good job predicting these sites. On the other hand, 26.2 percent of lithic scatters are found in low site potential zones. The rock art site is the only one of its kind in the subsection. Because no data are available regarding locations of suitable rock outcrops, the model is not expected to predict this site type. The trading post is one of two in the subsection. The other is in a high probability zone.
8.8.2.3.4 Relationships between Cultural Context, Descriptive, or Settlement Variables and Site Potential.
Another way to evaluate how well the site model predicts the locations of sites is to examine the distribution of particular types of sites by site potential class. Table 8.8.6 summarizes three sets of contingency or bivariate tables that cross-tabulate the three site potential classes by simple dichotomies (aceramic vs. not-aceramic, Archaic vs. not-Archaic, single component vs. not-single component).
The results of this analysis indicate that there is a non-random relationship between site potential and aceramic/non-aceramic sites, significant at the 0.05 level. Aceramic sites are over represented in the low probability class by 22.8 percent compared to 11.1 percent of those classified as not-aceramic, indicating that the model is a better predictor of sites containing pottery than of aceramic sites (e.g. small lithic scatters). Some of the aceramic sites may be Archaic in age, since Archaic sites tend to be more frequently found in low (25.0 percent) and medium (15.0 percent) areas vs. sites with no Archaic components (10.7 percent in low, 8.8 percent in medium). This may indicate that the model is better at predicting more recent sites, which make up a larger proportion of the database. There is little difference in the distribution of single and multiple component sites.
8.8.3 Survey Probability Model
8.8.3.1 Description
The survey probability model for the Anoka Sand Plain subsection indicates that environmental settings away from water have not been adequately surveyed. Such settings are extensive, particularly in the western portion of the subsection (Figure 8.8.5). The areas of high and medium survey potential follow many of the same water features as in the site model. However, the extent of high and medium survey potential zones is more than twice the extent of the corresponding site potential zones.
Table 8.8.6. Summary of Bivariate Relationships between Three Dichotomous Archaeological Variables and Three Areas of Site Potential, Anoka Sand Plain (Site Probability Model).
Low Potential |
Medium Potential |
High Potential |
Total |
Chi-square Test |
|||||||
Dichotomous Variable |
N |
% |
N |
% |
N |
% |
N |
% |
value |
df |
p-value |
All Modeled Sites |
52 |
15.5 |
34 |
10.2 |
249 |
74.3 |
335 |
100.0 |
- |
- |
- |
Aceramic |
29 |
22.8 |
15 |
11.8 |
83 |
65.4 |
127 |
100.0 |
9.82 |
2 |
0.01 |
Not Aceramic |
23 |
11.1 |
19 |
9.1 |
166 |
79.8 |
208 |
100.0 |
|||
Archaic |
5 |
25.0 |
3 |
15.0 |
12 |
60.0 |
20 |
100.0 |
4.86 |
2 |
0.09 |
Not Archaic |
23 |
10.7 |
19 |
8.8 |
173 |
80.5 |
215 |
100.0 |
|||
Single Component |
22 |
11.8 |
19 |
10.2 |
145 |
78.0 |
186 |
100.0 |
0.77 |
2 |
0.68 |
Not Single Component |
6 |
12.2 |
3 |
6.1 |
40 |
81.6 |
49 |
100.0 |
|||
In general, the eastern half of the subsection shows a dominance of high and medium survey potential, while the western half is dominated by low potential. This pattern reflects a non-uniform pattern of survey distribution. The larger population of surveyed places in the eastern half of the subsection determines the dominance of high survey potential there. If the entire subsection were roughly divided in half by State Highway 169, then Anoka, Isanti, and the eastern part of Sherburne County, with adjacent small portions of neighboring counties, would include 67 percent of all surveyed points while constituting only 49 percent of the land area. In the eastern half of the subsection, surveys combine elements of randomness, when conducted along some highway corridors, and elements of bias, from preferential placement of surveys near lakes and streams.
There is a relatively long linear survey along State Highway 169 across Sherburne County. Surveyed points are concentrated within Chain of Lakes Rice Creek Regional Park and extending northeast to Forest Lake. A well surveyed area of approximately 15 sq. km is located in Anoka County near the Mississippi River at the juncture of Anoka, Wright, Sherburne, and Hennepin counties. High and medium survey potential zones in the eastern half of the subsection display a combination of patterns that are apparently indiscriminate to landscapes in certain well-surveyed areas and gravitate to lakes, streams, and elevated relief in other areas.
As a consequence of this survey pattern, Anoka County is classified almost entirely as high and medium survey potential, with only a few significant areas of low potential in the north. The high and medium survey potential zone extends through Anoka County, south to Hennepin County, enters into the southeast corner of Sherburne County, and reaches north to Isanti County. Several low potential areas are found in the southwestern part of Isanti County. In the western half of the subsection the size of high and medium potential zones is smaller. One zone is located near Pleasant, La Sylvia,and Sugar Lakes in Wright County, another spreads within and around Sherburne National Wildlife Refuge, and several zones are found in Benton and Morrison counties. Survey potential zones along the Mississippi River follow the general pattern of the site potential model.
In a less surveyed western half of the subsection, several relatively short linear surveys were conducted. In Morrison County, some survey has occurred along a ten km segment of State Highway 27 and within a 12 km segment of the Mississippi River Valley. In Benton County, survey has been along the Elk River. Surveys in the western half of the subsection do not often cross the landscape, but are associated with stream network and lakes. This is reflected in the survey probability model, where high and medium probability zones tend to be near lakes and streams or on elevated relief.
As a consequence of this survey pattern, landscape features in the western half of the subsection have a prominent impact on the survey model configuration. High and medium potential zones are less consolidated than in the east and tend to be located near the Mississippi, its major tributaries and around lakes. Low survey potential areas are extensive, corresponding primarily to environmental settings away from water.
This survey potential model displays a number of north – south and east – west straight-line artifacts, corresponding to either elevation discrepancies between adjoining quad sheets or patterns from banded DEMs. They appear within the Becker, Orrock, Lake Fremont, Elk River, Nowthen and Crown quad sheets in Sherburne and Anoka Counties. Similar features are found in Stearns County. These lines are artifacts of digital elevation data inadequacy and should not be considered predictive features.
8.8.3.2 Evaluation
The survey probability model (Figure 8.8.5) predicted surveyed places somewhat better than by chance, suggesting that surveys are not located randomly within the subsection. The model is based on 11 variables, representing topography, vegetation, soils, hydrology, and geomorphology (Table 8.8.7). It predicts 84.95 percent of all surveys in high/medium survey potential areas, which make up 54.04 percent of the landscape (Table 8.8.8). This produces a very weak gain statistic of 0.36386 (Table 8.6.14), which is acceptable for a survey probability model.
This model for the Anoka Sand Plain subsection was able to predict surveyed places with much less precision than the site probability model was able to predict sites. The portions of land classified as high and medium potential in both models indicate that sites are confined to about half the total area surveyed. Relative to other regions, the Anoka Sand Plain subsection is fairly well surveyed. The percentage of land classified as high/medium survey potential is considerably larger than average for the Phase 3 survey probability models and the gain statistic is much lower than average (Table 8.6.14). However, since the models do predict surveyed places better than by chance, the region has not been fully or randomly surveyed.
The number of surveyed places (363 known sites of all types and 653 negative survey points) in the Anoka Sand Plain subsection is close to the average for all regions (Table 8.6.14). Survey frequency (0.20 surveyed places per square km) and site frequency (0.07 sites per square km) are higher than average. However, the strong concentration of both sites and surveys in the eastern portion of the subsection indicate room for improvement.
The two preliminary survey probability models had 71.34 percent agreement. The Kappa statistic for these models was 0.55217 (Table 8.6.14). The conditional Kappa statistics (Table 8.8.9) are lowest for the medium site potential zone, but this is less than 15 percent of the subsection area. It is assumed that doubling the number of surveyed places for modeling will improve model stability, as will distributing more surveys throughout the undersurveyed areas and improving the digital elevation data.
Table 8.8.7. Survey Probability Model, Anoka Sand Plain Subsection.
Intercept |
7.612 |
|
ln(nonsites/sites) |
0.116 |
|
Variable |
Regression Coefficient |
Probability |
Direction to nearest water or wetland (sine) |
-0.3898075 |
100.0 |
Distance to edge of nearest area of organic soils |
-0.014075744 |
85.8 |
Distance to edge of nearest perennial river or stream |
-0.02463914 |
100.0 |
Distance to glacial lake sediment |
-0.009247547 |
100.0 |
Distance to nearest lake, wetland, organic soil, or stream |
-0.02354407 |
62.6 |
Distance to nearest major ridge or divide |
-0.007639850 |
100.0 |
Distance to nearest permanent wetland inlet/outlet |
0.00919036 |
99.9 |
Distance to pine barrens or flats |
-0.008716412 |
85.0 |
Elevation |
-0.004990059 |
81.2 |
Height above surroundings |
0.07832833 |
100.0 |
Size of nearest lake |
0.0008408354 |
61.2 |
Table 8.8.8. Evaluation of Survey Probability Model, Anoka Sand Plains Subsection.
|
||||||||||||||||||||||||||||||||||||||||||||||||||||||||||||||||||||||||||||||||||||||||||||||||||||||||||||||||||||||||||
Table 8.8.9. Conditional Kappa Values for Survey Probability Model, Anoka Sand Plain Subsection.
Class |
Ki |
Proportion Correct |
Low |
0.6537 |
0.7922 |
Medium |
0.2245 |
0.3796 |
High |
0.6690 |
0.8014 |
8.8.3.3 Interpretation
Of the 11 variables contributing to the survey probability model, five are shared with the site probability model (Table 8.8.4). The new variables are distance to nearest major ridge or divide (Figure 8.8.7a ), elevation (Figure 8.8.7b ), distance to nearest permanent wetland inlet/outlet (Figure 8.8.9a ), distance to pine barrens or flats (Figure 8.8.10d ), distance to glacial lake sediment (Figure 8.8.11a ), and distance to edge of nearest area of organic soils (Figure 8.8.11b). Three variables (height above surroundings, distance to nearest perennial river or stream, size of nearest lake) have moderate correlation coefficients, indicating that surveys tend to be conducted on elevated ground near large lakes and perennial rivers and streams (Table 8.8.4). The other variables involved in the survey model also reinforce the hypothesis that topography and hydrology are the dominant features used to decide where surveys are conducted. All variables are significant at the 0.05 level, suggesting that surveyed places and random points are not drawn from the same population.
8.8.4 Survey Implementation Model
The survey implementation model for the Anoka Sand Plain subsection indicates that 42.18 percent of the land area is inadequately surveyed (Table 8.8.10 and Figure 8.8.6). As was apparent from the survey probability model, Anoka County has been well surveyed. Other counties in the subsection are mostly categorized as unknown, except near water bodies. With the unknown area removed, the low and possibly low probability areas occupy 31.54 percent of the landscape, which is far less than ideal. To reduce the unknown area will require more survey data. The proportion of the unknown area occupied by wetlands, pavement, and other unsurveyable land covers has not been calculated.
Table 8.8.10. Evaluation of Survey Implementation Model, Anoka Sand Plains Subsection.
Region |
Random Points |
Negative Survey Points |
Single Artifacts |
Sites |
||||||
# |
% |
# |
% |
# |
% |
# |
% |
# |
% |
|
Unknown |
2393346 |
42.18 |
485 |
42.51 |
110 |
16.85 |
7 |
26.92 |
20 |
5.93 |
Possibly Low |
704381 |
12.41 |
139 |
12.18 |
70 |
10.72 |
0 |
0 |
12 |
3.56 |
Low |
1085395 |
19.13 |
213 |
18.67 |
195 |
29.86 |
6 |
23.08 |
20 |
5.93 |
Suspected Medium |
76766 |
1.35 |
19 |
1.67 |
2 |
0.31 |
0 |
0 |
5 |
1.48 |
Possibly Medium |
88004 |
1.55 |
21 |
1.84 |
12 |
1.84 |
0 |
0 |
5 |
1.48 |
Medium |
392599 |
6.92 |
75 |
6.57 |
84 |
12.86 |
2 |
7.69 |
24 |
7.12 |
Suspected High |
40218 |
0.71 |
7 |
0.61 |
1 |
0.15 |
0 |
0 |
5 |
1.48 |
Possibly High |
43887 |
0.77 |
8 |
0.7 |
4 |
0.61 |
0 |
0 |
8 |
2.37 |
High |
752354 |
13.26 |
147 |
12.88 |
174 |
26.65 |
11 |
42.31 |
236 |
70.03 |
Water |
97618 |
1.72 |
27 |
2.37 |
1 |
0.15 |
0 |
0 |
1 |
0.3 |
Steep Slopes |
90 |
0 |
0 |
0 |
0 |
0 |
0 |
0 |
1 |
0.3 |
Mines |
0 |
0 |
0 |
0 |
0 |
0 |
0 |
0 |
0 |
0 |
Total |
5674658 |
100 |
1141 |
100 |
653 |
100 |
26 |
100 |
337 |
100 |
Portions of the Anoka Sand Plain have the potential to contain deeply buried sites. These include both upland areas of wind blown sediment and river valley floors and terraces. Mn/Model landscape suitability models were created for the northern stretch of the Mississippi River Valley (north of St. Cloud, Section 12.4) and for two upland 7.5 minute quadrangles in this subsection (Section 12.11). The US Army Corps of Engineers mapped landscape sediment assemblages of the Mississippi River Valley from St. Paul south, but did not model landscape suitability or include mapping of subsurface characteristics. The portion of the Mississippi River Valley between St. Cloud and St. Paul is now being mapped and modeled for landscape suitability by MnDOT. These models should be consulted for information regarding the geomorphic potential for both surface and subsurface archaeological sites.
8.9 Aspen Parklands
8.10 Big Woods
8.11 Blufflands
8.12 Border Lakes
8.13 Chippewa Plains
8.14 Coteau Moraines / Inner Coteau
8.15 Glacial Lake Superior Plain/Northshore Highlands/ Nashwauk
Uplands
8.16 Hardwood Hills
8.17 Laurentian Highlands
8.18 Littlefork-Vermilion Uplands
8.19 Mille Lacs Uplands
8.20 Minnesota River Prairie
8.21 Oak Savanna
8.22 Pine Moraines & Outwash Plains
8.23 Red River Prairie
8.24 Rochester Plateau
8.25 St. Croix Moraines and Outwash Plains (Twin Cities Highlands)
8.26 St. Louis Moraines/ Tamarack Lowlands
8.27 Conclusion
References
The Mn/Model Final Report (Phases 1-3) is available on CD-ROM. Copies may be requested by visiting the contact page.

Acknowledgements
MnModel was financed with Transportation Enhancement and State Planning and Research funds from the Federal Highway Administration and a Minnesota Department of Transportation match.
Copyright Notice
The MnModel process and the predictive models it produced are copyrighted by the Minnesota Department of Transportation (MnDOT), 2000. They may not be used without MnDOT's consent.