Quick Links
Chapters
- Management Summary
- Research Design & Time Line
- Environment & Native American Culture
- GIS Design
- Archaeological Database
- Archaeological & Environmental Variables
- Model Development & Evaluation
- Model Results & Interpretation
- Project Applications
- Model Enhancements
- Model Implementation
- Landscape Suitability Models
- Summary & Recommendations
Appendices
- Archaeological Predictive Modeling: An Overview
- GIS Standards & Procedures
- Archaeology Field Survey Standards, Procedures & Rationale
- Archaeology Field Survey Results
- Geomorphology Survey Profiles, Sections, & Lists
- Building a Macrophysical Climate Model for the State of Minnesota
- Correspondence of Support for Mn/Model
- Glossary
- List of Figures
- List of Tables
- Acknowledgments
8.9 ASPEN PARKLANDS SUBSECTION OF LAKE AGASSIZ & ASPEN PARKLANDS SECTION
8.9.1 Environmental Context
8.9.2 Site Probability Model
8.9.3 Survey Probability Model
8.9.4 Survey Implementation Model
8.9.5 Other Models
This regional model report is organized as described in Sections 8.2.1 through 8.4.1. Refer to these sections of the report for explanations of the tables, variables, and statistics.
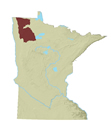
Aspen Parklands is a subsection of the Lake Agassiz, Aspen Parklands Section of the Eastern Broadleaf Forest Province (Figure 8.1) (Minnesota DNR 1998). This subsection consists of a low level plain, marked by low dunes, beach ridges, and wet swales along the western edge (Figure 8.9.1a). These features reduced the frequency and intensity of fires moving from west to east, so that aspen, poplar, and shrubs were able to become dominant here. There are extensive wetlands in the eastern part of the subsection.
The western boundary is the historical interface between aspen parklands and prairie vegetation. The eastern boundary is based on the western edge of the large peatlands. The southern boundary is based on the interface between prairie and forested lands to the south.
This subsection consists of a glacial lake plain with topography that is level to gently rolling and is in two distinct parts. The lacustrine plain in the west is level with small dunes, beach ridges and, swales. The water reworked till plain in the east (Figure 8.9.2.a) contains low relief. Poorly drained soils dominate the subsection (Figure 8.9.2b). Soils of the lacustrine plain range from loams and silts to sands and gravels. Large boulders are mixed in with the till. There are few lakes in this subsection. Thief and Mud Lakes, both in the east-central portion, are the largest.
The presettlement vegetation (Figure 8.9.1.b) was a mosaic of prairie, brush prairie, and aspen-oak woodland. Prairie vegetation was continuous along the western edge, far south, and between the Red Lake River and Thief River. Brush prairie was widespread in the south central, central, and northeast parts. The southeast was mostly wet prairie and marshland. Aspen-oak woodlands were most extensive in the north and, along with river bottom forest, were found around some of the major water courses.
8.9.2.1 Description
Zones of high site potential are located in wide zones, primarily around water features (Figure 8.9.3). The largest contiguous area is around Thief Lake. Other areas of high and medium site potential follow the Thief and Red Lake Rivers and their confluence in the central part of the subsection; the Clearwater and Black Rivers on the southwestern edge of the subsection; the Middle River and the Tamarac River in the west central area; the Middle and South Branches of the Two Rivers along the western edge of the subsection; the South Branch Two Rivers nearest Twin Lakes in the north central area; the lowest stretch of the Roseau River in Minnesota, at the Canadian border; and the South Fork Roseau River along the eastern edge of the subsection.
The South Branch Two Rivers nearest Twin Lakes (in the central area of the northern region of the subsection) has a stripe of high site potential that follows along modern State Highway 11. The elevation data reflect the modern roadbed, but whether the highway followed an existing ridge or created a false ridge is unclear. There are two known sites along this stretch of the highway, as well as a stream that generally follows the alignment of the road on its south side. The zones along the South Fork Roseau River and, to a lesser extent, along the confluence of the Thief and Red Lake Rivers, have areas of medium site potential that bear fingerprint patterns that appear to radiate from some points in the area of high site potential. These appear to be artifacts of the variable direction to nearest water or wetland.
Additional zones of high site potential are found east of Mud Lake in the central part of the subsection, and in the west along the North Branch Two Rivers, the upper Snake River, and the Middle River. The latter appear to be related to the variable height above surroundings.
8.9.2.2 Evaluation
The site probability model selected to represent the Aspen Parkland subsection was developed for the Hardwood Hills/Aspen Parklands combined region. An individual subsection model was not developed for Aspen Parklands because of the small number of known sites and strong performance of the combined model, compared to the preliminary individual subsection models based on halves of the dataset. The model is based on 20 variables (Table 8.9.1) representing topography, soils, vegetation, and hydrology.
Table 8.9.1. Site Probability Model, Aspen Parklands and Hardwood Hills Subsections.
Intercept |
1.830 |
|
ln(nonsites/sites) |
2.538 |
|
Variable |
Regression Coefficient |
Probability |
Direction to nearest water or wetland |
-0.3611561 |
100.0 |
Distance to Big Woods |
0.008578941 |
91.8 |
Distance to edge of nearest large wetland |
0.008325594 |
51.6 |
Distance to edge of nearest area of organic soils |
0.007515449 |
92.3 |
Distance to edge of nearest large lake |
-0.03106535 |
100.0 |
Distance to edge of nearest perennial river or stream |
-0.02852951 |
100.0 |
Distance to hardwoods |
-0.01949951 |
100.0 |
Distance to nearest intermittent stream |
0.01268584 |
94.1 |
Distance to nearest lake, wetland, organic soil, or stream |
-0.03863329 |
100.0 |
Distance to nearest minor ridge or divide |
-0.01769332 |
100.0 |
Distance to prairie |
-0.009381177 |
100.0 |
Distance to river bottom forest |
0.01296978 |
100.0 |
Distance to sugar maple |
0.010183778 |
100.0 |
Distance to well-drained soils |
-0.02280302 |
100.0 |
Elevation |
-0.006629980 |
100.0 |
Height above surroundings |
0.06377088 |
100.0 |
On river terraces |
3.706405 |
100.0 |
Size of major watershed |
0.0000578547 |
100.0 |
Vegetation diversity within 1 km |
0.3912551 |
100.0 |
Vertical distance to permanent water |
-0.01143975 |
100.0 |
When the Hardwood Hills/Aspen Parklands model is applied directly to the Aspen Parklands subsection, 59.32 percent of all sites, excluding single artifacts, are in the high and medium site potential areas, which constitute 8.49 percent of landscape (Table 8.9.2). This produces a very strong overall gain statistic of 0.85688 and a Kappa of 0.65854. However, this does not capture enough sites to meet Mn/Model standards. To remedy this problem, the model was reclassified for the Aspen Parklands subsection.
Table 8.9.2. Evaluation of Aspen Parklands Portion of the Site Probability Model, Aspen Parklands and Hardwood Hills Subsections.
Region (30 meter cells) |
Random Points |
Negative Survey Points |
Modeled Sites |
|||||
# |
% |
# |
% |
# |
% |
# |
% |
|
Low |
10644702 |
91.07 |
2188 |
91.13 |
564 |
86.77 |
24 |
40.68 |
Medium |
534053 |
4.57 |
106 |
4.41 |
43 |
6.62 |
18 |
30.51 |
High |
458434 |
3.92 |
99 |
4.12 |
43 |
6.62 |
17 |
28.81 |
Water |
51242 |
0.44 |
8 |
0.33 |
0 |
0 |
0 |
0 |
Steep Slopes |
0 |
0 |
0 |
0 |
0 |
0 |
0 |
0 |
Mines |
0 |
0 |
0 |
0 |
0 |
0 |
0 |
0 |
Total |
11688431 |
100.0 |
2401 |
100.0 |
650 |
100.0 |
59 |
100.0 |
The reclassified model for this subsection is created by taking the 20 class site probability model from the Aspen Parklands and Hardwood Hills combined subsections, extracting the Aspen Parklands subsection, and reclassifying the clipped subsection model to capture 85 percent of the sites. This reclassified site probability model performed very well. When this reclassified model is applied to the Aspen Parklands subsection, 83.03 percent of all sites, excluding single artifacts, are in the high and medium site potential areas, which constitute 22.84 percent of the landscape (Table 8.9.3). This produces a strong overall gain statistic of 0.72492 (Table 8.6.11). The model tested extremely well, predicting 96.54 percent of the test sites. The test gain statistic was 0.76316.
Table 8.9.3. Evaluation of Aspen Parklands Portion of the Reclassified Site Probability Model, Aspen Parklands and Hardwood Hills Subsections.
Region (30 meter cells) |
Random Points |
Negative Survey Points |
Modeled Sites |
Test
Sites |
||||||
# |
% |
# |
% |
# |
% |
# |
% |
# |
% |
|
Low |
8,967,817 |
76.72 |
1833 |
76.28 |
453 |
69.69 |
10 |
16.95 |
1 |
3.57 |
Medium |
1,339,065 |
11.46 |
276 |
11.49 |
82 |
12.62 |
9 |
15.25 |
4 |
14.29 |
High |
1,330,307 |
11.38 |
286 |
11.90 |
115 |
17.69 |
40 |
67.80 |
23 |
82.14 |
Water |
51242 |
0.44 |
8 |
0.33 |
0 |
0 |
0 |
0 |
0 |
0 |
Steep Slopes |
0 |
0 |
0 |
0 |
0 |
0 |
0 |
0 |
0 |
0 |
Mines |
0 |
0 |
0 |
0 |
0 |
0 |
0 |
0 |
0 |
0 |
Total |
11688431 |
100.0 |
2403 |
100.0 |
650 |
100.0 |
59 |
100.0 |
28 |
100 |
The database included 59 sites that were not single artifacts. Model stability improved by combining the subsections for modeling. Two preliminary models using different halves of the known sites from Aspen Parkland alone had only 67.15 percent agreement (67.15 percent of the cells in the subsection were classified the same in both models). The two preliminary models from the combined Aspen Parklands and Hardwood Hills subsections, when reclassified for Aspen Parklands, had 88.13 percent agreement). The Kappa statistic, which is adjusted for the amount of agreement expected by chance alone, for these models was 0.681 (Table 8.6.11). The conditional Kappa statistics (Table 8.9.4) are lowest for the medium site potential zone, but this is less than 5 percent of the subsection area. Increasing the number of sites for modeling may improve both confidence in the model and model stability.
Table 8.9.4. Conditional Kappa Values for the Aspen Parklands Portion of the Reclassified Site Probability Model, Aspen Parklands and Hardwood Hills Subsections.
Class |
Ki |
Proportion Correct |
Low |
0.8777 |
0.9751 |
Medium |
0.2716 |
0.3214 |
High |
0.6783 |
0.7219 |
8.9.2.3 Interpretation
The site probability model for Aspen Parklands is constructed from 20 variables including four topographic, eight hydrologic, six vegetation, and two soils variables (Table 8.9.1). This is a rather large number of variables for a model built with a relatively small number of known sites. Because this was a combined model, some variables may be more applicable to the Hardwood Hills and others to the Aspen Parklands. For example, the variable on river terraces (Figure 8.9.15a) is in the model, even though there are no river terraces mapped in this subsection.
8.9.2.3.1 Differences between Modeled Sites and Random Points for Individual Model Variables
The Mann-Whitney U tests indicate that the distribution of variable values is significantly different (at the 0.05 level) from random points for all except four variables (Table 8.9.5). Thus the model effectively identifies a set of variables discriminating between the two populations. Sites are not randomly distributed across the landscape.
Table 8.9.5. Model Variable Statistics.
Aspen Parklands |
Modeled Sites |
Surveyed Areas |
Modeled Sites |
Sites in Low Prob. |
Negative Survey Points |
Random Points |
||||||
Model Variable |
Coeff. |
Sign. |
Coeff. |
Sign. |
Mean |
S.D. |
Mean |
S.D. |
Mean |
S.D. |
Mean |
S.D. |
Distance to nearest major ridge or divide |
- |
- |
0.129 |
0.028 |
74.12 |
31.39 |
95.26 |
79.87 |
74.03 |
29.8 |
70.72 |
30.65 |
Distance to nearest minor ridge or divide |
-0.208 |
0.051 |
-0.246 |
0.103 |
21.65 |
12.74 |
23.71 |
24.54 |
23.87 |
12.09 |
24.7 |
11.77 |
Elevation |
-0.294 |
0 |
0.193 |
0.002 |
1047.53 |
61.72 |
1104 |
57.0 |
1103.94 |
72.81 |
1087.3 |
76.75 |
Height above surroundings |
0.002 |
0 |
0.076 |
0 |
4.51 |
5.46 |
4.0 |
3.0 |
1.25 |
1.98 |
0.86 |
1.74 |
Size of major watershed |
0.044 |
0.065 |
-0.098 |
0 |
35025.12 |
7632.52 |
34740.93 |
24392.24 |
32465.26 |
6657.74 |
33530 |
7610.6 |
|
|
|||||||||||
Direction to nearest water or wetland (sine) |
-0.045 |
0.329 |
-0.031 |
0.063 |
0.11 |
0.73 |
0.81 |
1.0 |
0.18 |
0.72 |
0.22 |
0.73 |
Distance to edge of nearest large wetland |
0.266 |
0.017 |
0.119 |
0.467 |
51.81 |
26.35 |
44.72 |
44.01 |
42.77 |
27.28 |
43.19 |
26.48 |
Distance to edge of nearest large lake |
0.267 |
0 |
-0.216 |
0.057 |
181.22 |
47.95 |
152.93 |
123.23 |
149.34 |
49.86 |
157.44 |
55.69 |
Distance to edge of nearest perennial river or stream |
-0.455 |
0 |
-0.101 |
0 |
30.94 |
31.81 |
73.12 |
70.67 |
60.41 |
27.35 |
67.81 |
29.55 |
Distance to nearest intermittent stream |
-0.124 |
0.001 |
0.045 |
0.004 |
38.05 |
25.37 |
58.90 |
63.72 |
47.08 |
26.05 |
48.42 |
24.47 |
Distance to nearest lake inlet/outlet |
-0.189 |
0.001 |
0.029 |
0 |
84.65 |
35.8 |
109.58 |
94.17 |
89.38 |
20.73 |
100.46 |
34.11 |
Distance to nearest lake, wetland, organic soil, or stream |
-0.174 |
0 |
-0.334 |
0 |
8.96 |
7.16 |
15.49 |
16.67 |
10.83 |
7.26 |
14.88 |
11.1 |
Vertical distance to permanent water |
-0.088 |
0.58 |
- |
- |
8.47 |
17.98 |
12.0 |
15.0 |
6.81 |
23.69 |
8.14 |
19.25 |
Distance to nearest confluence between perennial or intermittent streams and large rivers |
- |
- |
0.266 |
0.611 |
78.49 |
38.47 |
109.68 |
74.77 |
101.55 |
29.79 |
100.73 |
36.08 |
Distance to nearest permanent lake inlet/outlet |
- |
- |
0.088 |
0.006 |
116.38 |
47.46 |
118.89 |
93.26 |
124.35 |
41.61 |
128.54 |
46.77 |
|
|
|||||||||||
Distance to Big Woods |
0.18 |
0.001 |
- |
- |
294.4 |
65.31 |
261.91 |
210.19 |
245.53 |
76.8 |
264.46 |
74.59 |
Distance to conifers |
- |
- |
-0.026 |
0.115 |
113.52 |
46.14 |
96.51 |
86.68 |
118.55 |
43.66 |
120.77 |
51.79 |
Distance to hardwoods |
-0.364 |
0 |
0.191 |
0 |
71.24 |
45.58 |
107.72 |
83.98 |
90.27 |
36 |
99.13 |
39.13 |
Distance to pine barrens or flats |
- |
- |
0.325 |
0 |
176.95 |
58.99 |
155.93 |
118.22 |
192.58 |
42.24 |
176.04 |
56.43 |
Distance to prairie |
-0.356 |
0.001 |
- |
- |
20.63 |
26.61 |
58.49 |
70.77 |
35.12 |
34.81 |
36.4 |
34.52 |
Distance to river bottom forest |
-0.388 |
0 |
0.435 |
0.026 |
87.22 |
52.2 |
130.90 |
91.65 |
131.5 |
49.19 |
125 |
48.17 |
Distance to sugar maple |
0.066 |
0.007 |
- |
- |
282.69 |
77.81 |
271.99 |
222.60 |
229.54 |
72.61 |
255.13 |
83.07 |
Vegetation diversity within 1 km |
0.311 |
0.001 |
0.299 |
0 |
2.34 |
0.84 |
2.0 |
1.0 |
2.23 |
0.82 |
1.98 |
0.77 |
Distance to aspen-birch |
- |
- |
-0.086 |
0 |
95.19 |
41.3 |
86.28 |
62.87 |
95.83 |
44.72 |
100.79 |
43.03 |
Distance to mixed hardwoods and pine |
- |
- |
-0.148 |
0 |
523.72 |
39.91 |
509.42 |
231.91 |
493.73 |
37.5 |
508.75 |
41.69 |
Distance to oak woodland |
- |
- |
-0.245 |
0 |
231.88 |
77.88 |
225.62 |
191.46 |
165.65 |
80.9 |
196.84 |
84.65 |
|
|
|||||||||||
Distance to edge of nearest area of organic soils |
0.348 |
0.044 |
-0.32 |
0 |
61.57 |
31.31 |
40.42 |
44.86 |
41.72 |
32.36 |
53.81 |
30.74 |
Distance to well-drained soils |
-0.238 |
0 |
- |
- |
27.13 |
31.8 |
51.58 |
55.52 |
63.06 |
37.9 |
57.83 |
44.02 |
On river terraces |
NA |
1 |
- |
- |
0 |
0 |
0 |
0 |
0 |
0 |
0 |
0 |
Distance to glacial lake sediment |
- |
- |
0.171 |
0.121 |
1.9 |
5.86 |
8.66 |
13.78 |
5.06 |
12.08 |
4.35 |
11.46 |
Frequency counts |
59 |
722 |
59 |
10 |
650 |
3978 |
||||||
See Interpretation section for explanation of the statistics:
Coeff. = correlation coefficient
Sign. = significance of the Mann-Whitney U test
S.D. = standard deviationDistances and areas are expressed in square roots of meters. Square the values in the table to get actual values.
Focusing on those variables exhibiting a large mean difference between modeled sites and random points, sites tend to be closer to perennial rivers or streams (957 vs. 4,598 meters, Figure 8.9.10a), lakes, wetlands, organic soils, or streams (80 vs. 221 meters, Figure 8.9.10d), and prairie (426 vs. 1,325 meters, Figure 8.9.12d) compared to random points. Compared to random points, sites also are higher than their surroundings (4.5 vs. 0.9 feet, Figures 8.9.4a and 8.9.8d) and in areas of greater vegetation diversity within one kilometer (2.3 vs. 2.0, Figures 8.9.5a and 8.9.13c). These variables, together with others strongly correlated to site distributions, provide a very generalized picture of prehistoric settlement patterns. As is typical throughout the state, proximity to water bodies is important. However, in this region sites tend to be closer to streams, both perennial and intermittent streams (Figure 8.9.10b), and somewhat farther from wetlands and lakes (distance to nearest area of organic soils (Figure 8.9.14c), distance to edge of nearest large wetland (Figure 8.9.9c), distance to edge of nearest large lake (Figure 8.9.9d)). The explanation for this may be in the proportions of these features in the landscape. Although sites tend to be at lower elevations (Figure 8.9.8c), lakes occupy only 0.5 percent of the subsection (Figure 8.9.1a). Consequently, there is not much available land near lakes for settlement. Wetlands, on the other hand, occupy 20.8 percent of the landscape. They provide important resources, but the poorly drained soil near them is not desirable for settlement. The importance of drainage is attested by the tendency of sites to be closer to a minor ridge or divide (Figure 8.9.8b) and well-drained soils (Figures 8.9.2b and 8.9.14d). Rivers and streams, then, become more important in this region as places where available water and good soil drainage can be found.
Vegetation also plays an important role in site distributions in the Aspen Parklands. According to the statistics, sites should be close to prairie (Figure 8.9.12d), hardwoods (Figure 8.9.12b), and river bottom forest (Figure 8.9.13a). However, there is very little river bottom forest mapped in the subsection (Figure 8.9.1b); the association may be related to the proximity of this vegetation type to streams. Aspen-oak and aspen-birch (hardwood phase) are the dominant hardwoods, though prairie is much more extensive. Still , the wood resources are important for fuel and the hardwood communities may have provided some protection from frequent prairie fires. Both Big Woods (Figure 8.9.11d) and sugar maple (Figures 8.9.5b and 8.9.13b) are all but absent from this subsection but present in adjacent areas. Consequently, sites tend to be farther from these resources than do random points.
The model variables with distributions that are not significantly different than random points are size of major watershed (Figure 8.9.9a ), direction to nearest water or wetland (Figure 8.9.9b ), and vertical distance to permanent water (Figures 8.9.4b and 8.9.11a). However, these variables are distinctive enough in their distribution to provide information to the model in combination with other variables.
8.9.2.3.1 Relationships between Variable Pairs
There are 14 pairs of variables with correlations greater than 0.5 (Table 8.9.6). This indicates that there is a relatively low amount of data redundancy or overlap in what the variables are measuring, since it represents only 7 percent of all possible pairs. This indicates that, since there are so many variables involved in the site model, each variable accounts for a small part of the model’s variation. A majority of the variables involved in these relationships are hydrologic or vegetative in nature. Distance to large lake decreases as elevation increases (-0.64) and size of major watershed decreases (0.51). Distance to nearest intermittent stream increases with decreasing distance to nearest large wetland (-0.59). Elevated areas tend not to be associated with prairie (0.59) or river bottom forest (0.55). Distance to Big Woods is negatively associated with elevation (-0.54) but positively related to size of major watershed (0.60), distance to nearest large lake (0.92) and distance to sugar maple (0.93). Distance to sugar maple is in turn directly associated with size of major watershed (0.74) and distance to nearest large lake (0.84). Since both Big Woods and sugar maples are absent from this subsection, these relationships may be less pertinent than others. Finally, as distance to nearest area of organic soil decreases, distance to nearest large wetland decreases (0.72) and distance to nearest lake inlet/outlet increases (-0.54).
Table 8.9.6. Variable Correlation Matrix.
Aspen Parklands |
Distance to nearest minor ridge or divide |
Elevation |
Height above surroundings |
Size of major watershed |
Direction to nearest water or wetland (sine) |
Distance to edge of nearest large wetland |
Distance to edge of nearest large lake |
Distance to edge of nearest perennial river or stream |
Distance to nearest intermittent stream |
Distance to nearest lake inlet/outlet |
Elevation |
-0.21 |
1 |
||||||||
Height above surroundings |
0.07 |
0.12 |
1 |
|||||||
Size of major watershed |
-0.05 |
-0.02 |
-0.05 |
1 |
||||||
Direction to nearest water or wetland (sine) |
0.08 |
-0.16 |
-0.09 |
-0.2 |
1 |
|||||
Distance to edge of nearest large wetland |
0.01 |
-0.24 |
-0.13 |
-0.3 |
0.27 |
1 |
||||
Distance to edge of nearest large lake |
0.16 |
-0.64 |
0.08 |
0.51 |
0 |
-0.19 |
1 |
|||
Distance to edge of nearest perennial river or stream |
-0.18 |
0.16 |
0.06 |
0.15 |
-0.12 |
-0.18 |
-0.1 |
1 |
||
Distance to nearest intermittent stream |
0.01 |
0.06 |
0 |
0.35 |
-0.31 |
-0.59 |
0.27 |
0.05 |
1 |
|
Distance to nearest lake inlet/outlet |
-0.09 |
0.11 |
0.05 |
0.32 |
-0.17 |
-0.42 |
0.19 |
0.17 |
0.26 |
1 |
Distance to nearest lake, wetland, organic soil, or stream |
-0.08 |
0.1 |
-0.02 |
0.19 |
-0.43 |
-0.36 |
0.03 |
0.36 |
0.32 |
0.22 |
Vertical distance to permanent water |
0.02 |
-0.01 |
0.42 |
0.21 |
-0.04 |
0.02 |
0.16 |
0.28 |
-0.11 |
0.04 |
Distance to Big Woods |
0.07 |
-0.54 |
0.12 |
0.6 |
-0.07 |
-0.32 |
0.92 |
-0.05 |
0.35 |
0.32 |
Distance to hardwoods |
0.04 |
0.25 |
0.16 |
0.19 |
-0.16 |
-0.04 |
-0.08 |
-0.02 |
0.22 |
-0.1 |
Distance to prairie |
-0.18 |
0.59 |
-0.05 |
0.08 |
-0.24 |
-0.32 |
-0.42 |
0.1 |
0.24 |
0.13 |
Distance to river bottom forest |
0.05 |
0.55 |
0.14 |
-0.08 |
-0.14 |
-0.01 |
-0.39 |
0.13 |
0.13 |
-0.18 |
Distance to sugar maple |
0.08 |
-0.38 |
0.06 |
0.74 |
-0.09 |
-0.33 |
0.84 |
-0.01 |
0.36 |
0.39 |
Vegetation diversity within 1 km |
-0.11 |
0.26 |
-0.07 |
0.11 |
-0.2 |
-0.21 |
-0.01 |
-0.05 |
0.13 |
0.23 |
Distance to edge of nearest area of organic soils000 |
-0.05 |
-0.33 |
-0.37 |
-0.09 |
0.23 |
0.72 |
0.02 |
-0.28 |
-0.34 |
-0.54 |
Distance to well-drained soils |
0.08 |
0.32 |
-0.08 |
0.21 |
-0.08 |
-0.37 |
-0.1 |
-0.22 |
0.36 |
0.15 |
On river terraces |
NA |
NA |
NA |
NA |
NA |
NA |
NA |
NA |
NA |
NA |
Aspen Parklands |
Distance to nearest lake, wetland, organic soil, or stream |
Vertical distance to permanent water |
Distance to Big Woods |
Distance to hardwoods |
Distance to prairie |
Distance to river bottom forest |
Distance to sugar maple |
Vegetation diversity within 1 km |
Distance to edge of nearest area of organic soils |
Distance to well-drained soils |
On river terraces |
Distance to nearest lake, wetland, organic soil, or stream |
1 |
||||||||||
Vertical distance to permanent water |
0.24 |
1 |
|||||||||
Distance to Big Woods |
0.14 |
0.27 |
1 |
||||||||
Distance to hardwoods |
-0.07 |
0.1 |
0.02 |
1 |
|||||||
Distance to prairie |
0.19 |
-0.2 |
-0.33 |
0.04 |
1 |
||||||
Distance to river bottom forest |
-0.11 |
-0.18 |
-0.37 |
0.68 |
0.24 |
1 |
|||||
Distance to sugar maple |
0.1 |
0.23 |
0.93 |
0.12 |
-0.19 |
-0.26 |
1 |
||||
Vegetation diversity within 1 km |
0.19 |
-0.06 |
-0.03 |
-0.32 |
0.23 |
-0.09 |
0.04 |
1 |
|||
Distance to edge of nearest area of organic soils |
-0.35 |
-0.14 |
-0.13 |
0.06 |
-0.21 |
-0.04 |
-0.16 |
-0.15 |
1 |
||
Distance to well-drained soils |
0.05 |
-0.18 |
0.02 |
0.33 |
0.24 |
0.31 |
0.13 |
0.17 |
-0.19 |
1 |
|
On river terraces |
NA |
NA |
NA |
NA |
NA |
NA |
NA |
NA |
NA |
NA |
NA |
Refer to "Relationships between variable pairs" for interpretation of the table values.
8.9.2.3.2 Sites in Low Probability Areas
Since there are only 10 known sites in the low probability areas of this model, generalizations may not be meaningful. However, average values for these sites are distinct from those for all modeled sites and for random points on 12 model variables (Table 8.9.5). This implies that they are not randomly located, nor are they like the majority of sites. Compared to modeled sites and random points, sites in low probability areas are at higher elevations, at a greater distance above permanent water, in a more southerly direction with respect to water, farther from the nearest major ridge or divide, intermittent streams, lake inlet/outlets, river confluences, hardwoods, and prairie, and closer to conifers, pine barrens or flats, and aspen-birch.
Sites in low potential areas are most similar to random points in their vegetation diversity, distances to Big Woods, mixed hardwoods and pines, river bottom forest, large wetlands, large lakes, perennial rivers and streams, and lakes, wetlands, organic soils, and streams. They are more similar to sites in their values for height above surroundings, size of major watershed, distance to nearest permanent lake inlet/outlet, and distance to oak woodland.
Of the 10 sites in low probability areas, two are mortuary/cemetery sites, one is a mound or earthwork, five are artifact scatters, and two are lithic scatters. If the model predicts all site types equally well, 16.95 percent of each type should be in the low site potential zones. Most site types are underrepresented in this zone, with only 11.76 of mortuary/cemetery sites, 9.1 percent of mound/earthworks, and 13.33 percent of lithic scatters found in low probability areas. Artifact scatter, however, are overrepresented in the low probability areas (22 percent), implying that the model does a relatively poor job predicting such sites.
8.9.2.3.3 Relationships between Cultural Context, Descriptive, or Settlement Variables and Site Potential.
The number of sites in this subsection is insufficient to permit an analysis of the distribution of sites within the three probability zones by cultural context and site type variables.
8.9.3 Survey Probability Model
8.9.3.1 Description
The survey probability model selected to represent Aspen Parklands was developed as a combined model for the Littlefork-Vermillion Uplands, Agassiz Lowlands, and Aspen Parklands subsections. There is very little resemblance between this model and the site probability model in their overall extent and configuration. With almost 2/3 of the landscape classified as high and medium survey potential (Figure 8.9.6), an area seven times larger than the areas of high site potential, a wider range of environmental conditions is present within areas similar to those that have been surveyed. The major factor shaping the survey probability model is survey point distribution along several major infrastructure systems in northwestern Minnesota. Most high and medium site potential zones, adjacent to water areas, are also included in the survey model as areas of high potential. However, water features can explain only a minor fraction of all high survey potential zones.
Areas of high and medium survey potential overlay the major survey tracks as two 20-30 km wide continuous belts stretching across the subsection. One belt lies in the center of the subsection with a general eastward direction, the longer one follows a northwest-southeast diagonal. The contiguous areas of high and medium survey potential that occupy almost all of Marshall county are located at the intersection of these two belts. These high and medium survey potential zones contain several distinct linear survey tracks. A straight 140 km long linear survey track, probably a gas pipeline survey, crosses the subsection from southeast to northwest. This survey follows the general direction along State Highways 59, 92, and the C.P.R. Railroad, creating a framework for the diagonal belt. Another parallel 50 km long linear survey is found in the central part of the subsection, 14 km southwest from the previous linear track. A 12 km linear survey is located in the east central part of the subsection between the Agassiz National Wildlife Refuge and Thief Lake . A fourth linear survey is located in the southeast portion of the subsection on the Red Lake Indian Reservation (30 km). Only a few of the 650 negative survey points in Aspen Parklands are located outside of these linear tracks. That makes large portions of the subsection, for example Roseau, and portions of Kittson and Pennington Counties, void of any surveys and, consequently, low survey potential.
While the dominance of the archaeological survey distribution is evident across the entire subsection, it is clear that some types of environments were better surveyed than others. Areas of organic peat deposits (Figure 8.9.2.a), like those in the east central part of the subsection (eastern Marshall County) or scattered spots in the north central portion of the subsection (western Roseau and eastern Kittson Counties), are generally assigned low potential, with the boundary following the interface of peat and glacial deposits. However, high survey potential zones appear on peat when in proximity to linear survey tracks or lakes (Mud Lake in the Agassiz National Wildlife Refuge). Beach ridges, like those in the northeastern part of the subsection (see "well-drained soils" in Figure 8.9.2.b) extending from southwest to northeast, or a beach ridge conglomerate in the southeastern portion of the subsection (around the border between Polk, Pennington and Red Lake Counties), define an increase in survey potential amidst low potential zones. At the northeastern border of the subsection the interface between Lake Agassiz shallow water facie landforms and Red River Lobe lake modified and wave-planed till mark the increased survey potential. Apparently, these landform features are reflected by soil and vegetation variables as shown by the survey probability model.
8.9.3.2 Evaluation
The survey probability model predicted surveyed places somewhat better than by chance, suggesting that surveys are not located randomly within the subsection. The model is based on 24 variables (Table 8.9.7), representing topography, vegetation, soils, geomorphology, and hydrology. When this model is applied to Aspen Parklands, 93.07 percent of all surveyed places are in the high and medium survey potential areas, which constitute 57.68 percent of landscape (Table 8.9.8). This produces a very weak gain statistic of 0.38025 (Table 8.6.14), which is desirable for a survey probability model.
This model was able to predict surveyed places within the subsection with much less precision than the site probability model was able to predict sites, indicating that sites are confined to only a portion of the total area surveyed. Even though the infrastructure surveys remove much subjectivity from where surveys have occurred, the models predicted surveyed places better than by chance, indicating that the region has not been randomly surveyed. The low numbers of both sites (72) and negative survey points (650) in the large area of this subsection indicate a frequency of only 0.069 surveyed points per square km, with a frequency of only 0.007 known sites per square km.
Two preliminary survey probability models had only 77.04 percent agreement. The Kappa statistic for these models was 0.59768 (Table 8.6.14). The conditional Kappa statistics (Table 8.9.9) are lowest for the medium site potential zone, as is typical of all the models. Increasing the number of surveyed places for modeling may improve model stability, particularly if they are distributed throughout the undersurveyed areas.
Table 8.9.7. Survey Probability Model, Littlefork-Vermillion Uplands, Agassiz Lowlands, and Aspen Parklands Subsections.
Intercept |
15.446 |
|
ln(nonsites/sites) |
1.921357209 |
|
Variable |
Regression Coefficient |
Probability |
Direction to nearest water or wetland |
-0.2083746 |
100.0 |
Distance to aspen-birch |
0.009067051 |
100.0 |
Distance to conifers |
-0.01742775 |
100.0 |
Distance to edge of nearest area of organic soils |
-0.02000171 |
100.0 |
Distance to edge of nearest large lake |
-0.006447315 |
100.0 |
Distance to edge of nearest large wetland |
0.007661748 |
81.6 |
Distance to edge of nearest perennial river or stream |
-0.00548944 |
62.6 |
Distance to glacial lake sediment |
0.01206178 |
100.0 |
Distance to hardwoods |
-0.007828774 |
100.0 |
Distance to mixed hardwoods and pines |
-0.005505270 |
100.0 |
Distance to nearest confluence between perennial or intermittent streams and large rivers |
-0.01055636 |
100.0 |
Distance to nearest intermittent stream |
0.005373497 |
67.6 |
Distance to nearest lake inlet/outlet |
-0.008144397 |
100.0 |
Distance to nearest lake, wetland, organic soil, or stream |
-0.05448032 |
100.0 |
Distance to nearest major ridge or divide |
0.006981751 |
100.0 |
Distance to nearest minor ridge or divide |
-0.009719916 |
64.8 |
Distance to nearest permanent lake inlet/outlet |
0.007480810 |
100.0 |
Distance to oak woodland |
-0.009453103 |
100.0 |
Distance to pine barrens or flats |
0.01053629 |
100.0 |
Distance to river bottom forest |
.010036316 |
100.0 |
Elevation |
-0.01302934 |
100.0 |
Height above surroundings |
0.06082276 |
100.0 |
Size of major watershed |
0.00006009177 |
100.0 |
Vegetation diversity within 1 km |
0.4535275 |
100.0 |
Table 8.9.8. Evaluation of Aspen Parklands Portion of the Survey Probability Model, Littlefork-Vermillion Uplands, Agassiz Lowlands, and Aspen Parklands Subsections.
Region (30 meter cells) |
All random points |
All negative survey points |
All sites |
All sites and negative survey points |
||||||
# |
% |
# |
% |
# |
% |
# |
% |
# |
% |
|
Low |
4894728 |
41.88 |
1022 |
42.57 |
37 |
5.69 |
13 |
18.06 |
50 |
6.93 |
Medium |
3010128 |
25.75 |
617 |
25.70 |
151 |
23.23 |
14 |
19.44 |
165 |
22.85 |
High |
3732345 |
31.93 |
0 |
31.40 |
462 |
71.08 |
45 |
62.50 |
507 |
70.22 |
Water |
51230 |
0.44 |
754 |
0.33 |
0 |
0 |
0 |
0 |
0 |
0 |
Steep Slopes |
0 |
0 |
0 |
0 |
0 |
0 |
0 |
0 |
0 |
0 |
Mines |
0 |
0 |
8 |
0.00 |
0 |
0 |
0 |
0 |
0 |
0 |
Total |
11688431 |
100 |
2401 |
100 |
650 |
100 |
72 |
100 |
722 |
100 |
Table 8.9.9. Conditional Kappa Values for the Aspen Parklands Portion of the Survey Probability Model, Littlefork-Vermillion Uplands, Agassiz Lowlands, and Aspen Parklands Subsections.
Class |
Ki |
Proportion Correct |
Low |
0.8492 |
0.9370 |
Medium |
0.1128 |
0.1971 |
High |
0.5578 |
0.7004 |
8.9.3.3 Interpretation
The survey probability model is constructed from 24 variables, 14 of which are also included in the site probability model. The breakdown includes five topographic, nine hydrologic, eight vegetative, and two soils variables (Table 8.9.5). Although there are a large number of variables in this model, only four have univariate correlation coefficients with survey potential greater than 0.3. This means there is no strong patterning to the way surveyed places are distributed according to the variables in the model. Rather, each variable accounts for a small portion of the overall way surveys are distributed across the landscape. This model is also unusual because the mean values of 18 variables for the negative survey points are closest to their mean values for random points. For some variables, negative survey points exhibit a large difference in means from modeled sites. These include height above surroundings (1.25 vs. 4.51 feet, Figure 8.9.8d), distance to nearest perennial river or stream (3,649 vs. 957 meters, Figure 8.9.10a), and distance to glacial lake sediment (25.6 vs. 3.6 meters, Figure 8.9.15b). These are all good indicators of the low degree of survey bias in Aspen Parklands, compared to other subsections. This can be attributed to the infrastructure surveys that have occurred here.
Because survey locations in this subsection, though non-random, are not strongly biased by archaeologists' models of where sites should be, it is meaningless to try to interpret the variables individually. The ten variables in the survey probability model that did not contribute to the site probability model are distance to nearest lake inlet/outlet (Figure 8.9.10c), distance to nearest confluence between perennial or intermittent streams and large rivers (Figure 8.9.11b), distance to nearest permanent lake inlet/outlet (8.9.11c), distance to glacial lake sediment (Figure 8.9.15b), distance to conifers (Figure 8.9.12a), distance to aspen-birch (Figure 8.9.13d), distance to mixed hardwoods and pines (Figure 8.9.14a), distance to pine barrens or flats (Figure 8.9.12c), distance to oak woodland (Figure 8.9.14b) and distance to nearest major ridge or divide (Figure 8.9.8a).
The results of the Mann-Whitney U tests indicate that all except seven survey probability model variables are significant at the 0.05 level (Table 8.9.5). These tests suggest that surveyed areas, which includes negative survey points and all sites (including single artifacts), tend to be different enough from the random points to consider them as drawn from different populations. In this sense, the places examined by archaeologists are not randomly distributed across the landscape. However, as the map indicates (Figure 8.9.6), they are less biased by professional prejudice than by the location of infrastructure.
8.9.4 Survey Implementation Model
The survey implementation model for Aspen Parklands categorizes 38.75 percent of the landscape as unknown (Table 8.9.10 and Figure 8.9.7). Fully 37.97 percent of the subsection is categorized as low or possibly low probability for sites. This is much higher than the statewide average, but less than ideal. To reduce the unknown area and increase the area of low site probability will require more survey data, particularly in the unknown area.
Table 8.9.10. Evaluation of Survey Implementation Model, Aspen Parklands Subsection.
Region (30 meter cells) |
Random Points |
Negative Survey Points |
Single Artifacts |
Sites |
||||||
# |
% |
# |
% |
# |
% |
# |
% |
# |
% |
|
Unknown |
4,529,209 |
38.75 |
931 |
38.74 |
34 |
5.23 |
4 |
30.77 |
4 |
6.78 |
Possibly Low |
2,309,745 |
19.76 |
488 |
20.31 |
122 |
18.77 |
1 |
7.69 |
1 |
1.69 |
Low |
2,128,863 |
18.21 |
414 |
17.23 |
297 |
45.69 |
3 |
23.08 |
5 |
8.47 |
Suspected Medium |
274,468 |
2.35 |
69 |
2.87 |
0 |
0 |
0 |
0 |
3 |
5.08 |
Possibly Medium |
472,125 |
4.04 |
83 |
3.45 |
22 |
3.38 |
1 |
7.69 |
2 |
3.39 |
Medium |
592,472 |
5.07 |
124 |
5.16 |
60 |
9.23 |
0 |
0 |
3 |
5.08 |
Suspected High |
91,042 |
0.78 |
23 |
0.96 |
2 |
0.31 |
1 |
7.69 |
1 |
1.69 |
Possibly High |
228,258 |
1.95 |
47 |
1.96 |
9 |
1.38 |
0 |
0 |
8 |
13.56 |
High |
1,011,007 |
8.65 |
216 |
8.99 |
104 |
16.00 |
3 |
23.08 |
32 |
54.24 |
Water |
51242 |
0.44 |
8 |
0.33 |
0 |
0 |
0 |
0 |
0 |
0 |
Steep Slopes |
0 |
0 |
0 |
0 |
0 |
0 |
0 |
0 |
0 |
0 |
Mines |
0 |
0 |
0 |
0 |
0 |
0 |
0 |
0 |
0 |
0 |
Total |
11688431 |
100 |
2403 |
100 |
650 |
100 |
13 |
100 |
59 |
100 |
No landscape suitability models have been developed for this subsection.
8.10 Big Woods
8.11 Blufflands
8.12 Border Lakes
8.13 Chippewa Plains
8.14 Coteau Moraines / Inner Coteau
8.15 Glacial Lake Superior Plain/Northshore Highlands/ Nashwauk
Uplands
8.16 Hardwood Hills
8.17 Laurentian Highlands
8.18 Littlefork-Vermilion Uplands
8.19 Mille Lacs Uplands
8.20 Minnesota River Prairie
8.21 Oak Savanna
8.22 Pine Moraines & Outwash Plains
8.23 Red River Prairie
8.24 Rochester Plateau
8.25 St. Croix Moraines and Outwash Plains (Twin Cities Highlands)
8.26 St. Louis Moraines/ Tamarack Lowlands
8.27 Conclusion
References
The Mn/Model Final Report (Phases 1-3) is available on CD-ROM. Copies may be requested by visiting the contact page.

Acknowledgements
MnModel was financed with Transportation Enhancement and State Planning and Research funds from the Federal Highway Administration and a Minnesota Department of Transportation match.
Copyright Notice
The MnModel process and the predictive models it produced are copyrighted by the Minnesota Department of Transportation (MnDOT), 2000. They may not be used without MnDOT's consent.