Quick Links
Chapters
- Management Summary
- Research Design & Time Line
- Environment & Native American Culture
- GIS Design
- Archaeological Database
- Archaeological & Environmental Variables
- Model Development & Evaluation
- Model Results & Interpretation
- Project Applications
- Model Enhancements
- Model Implementation
- Landscape Suitability Models
- Summary & Recommendations
Appendices
- Archaeological Predictive Modeling: An Overview
- GIS Standards & Procedures
- Archaeology Field Survey Standards, Procedures & Rationale
- Archaeology Field Survey Results
- Geomorphology Survey Profiles, Sections, & Lists
- Building a Macrophysical Climate Model for the State of Minnesota
- Correspondence of Support for Mn/Model
- Glossary
- List of Figures
- List of Tables
- Acknowledgments
8.18 LITTLEFORK-VERMILLION UPLANDS SUBSECTION OF NORTHERN MINNESOTA & ONTARIO PEATLANDS SECTION
8.18.1 Environmental Context
8.18.2 Site Probability Model
8.18.3 Survey
Probability Model
8.18.4 Survey Implementation Model
8.18.5 Other Models
This regional model report is organized as described in Sections 8.2.1 through 8.4.1. Refer to these sections of the report for explanations of the tables, variables, and statistics.
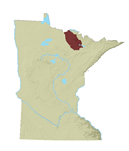
Littlefork-Vermilion Uplands is a subsection of the North Minnesota & Ontario Peatlands section of the Laurentian Mixed Forest Province (Figure 8.1) (Minnesota DNR 1998). The subsection is a gently rolling lake plain in the west, with higher relief in the east serving as a transition zone to the Border Lakes subsection.
The boundaries of this subsection are glacial in origin. The western border is defined by the eastern extent of large peatlands and the western edge of the landscape dominated by lake modified till (Figure 8.18.2.a). The southern boundary is based on the interface between the northern extent of the Rainy Lobe materials and the southeastern limit of lake-washed till deposited from Glacial Lake Agassiz. To the east, the boundary is based on the transition from mineral lake-laid sediment and ground moraines to a bedrock-dominated landscape.
This subsection is a level to gently rolling lake plain, with relief (Figure 8.18.1.a) becoming greater in the eastern half as the landform composition changes from lake plain to ground moraine. Elevation increases from west to east. Bedrock outcrops become more frequent in the furthest east portion of the subsection. Two major drainages in this subsection flow north to the Rainy River. These are the Vermilion River, which forms part of the eastern boundary, and the Little Fork River, which forms a significant river valley through the entire west half of the subsection. There are three large lakes in the eastern half of the subsection (Vermilion Lake, Pelican Lake, and Nett Lake) and no lakes of significance in the western half. Smaller lakes and streams form an intricate network throughout the eastern half. Well-drained soils dominate the eastern half and the Little Fork River valley, while poorly-drained and peat soils dominate the lake plain (Figure 8.18.2.b).
Historic vegetation (Figure 8.18.1.b) was predominantly aspen-birch forest (coniferous phase) mixed with conifer bogs. The aspen-birch hardwood phase was present in several locations, most extensively in river valleys in the southwestern portion of the subsection. Conifer bogs are more prominent than the aspen-birch forest in the far north and west central areas. This is also the case in the far south, where scattered jack pine barrens combined with conifer bogs to cover significant areas. Small patches of jack pine barrens were scattered thinly across the east and central part of the subsection. In the east central portion of the subsection, approximately north and east of Pelican Lake, and south to areas west of Lake Vermilion, white and red pine were prevalent. Other areas of white and red pine occurred around the confluence of the Little Fork and Sturgeon Rivers and along the middle stretch of the Nett Lake River. River bottom forest was prominent along the lower course of the Little Fork River, from several miles above its confluence with Beaver Brook.
8.18.2.1 Description
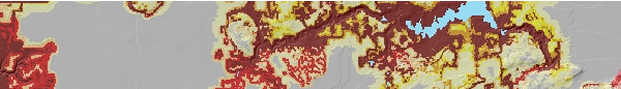
Areas of high and medium site potential in the site probability model (Figure 8.18.3) are concentrated around lakes and in river valleys. The largest contiguous region of high site potential occurs in the northwest, along the lower course of the Little Fork River, below its confluence with Ester Brook in northern Koochiching County. Between that point and the confluence with Beaver Brook, the area of high site potential closely follows the distribution of alluvium as mapped in Figure 8.18.2a. Continuing downstream, the area of high site potential widens beyond the extent of alluvium.
Smaller areas of high site potential occur in the northernmost part of the subsection. A thin strip follows the Rainy River, which widens upland along two creeks. Across the northern and eastern third of the subsection are scattered zones of high site potential following minor stream courses and ridges, as represented by the variables height above surroundings and distance to edge of nearest perennial river. Most of the course of the Little Fork River is classified as high site potential, but this zone remains narrow, closely following the river and its tributaries.
A web of high site potential appears south of Lake Kabetogama, from its south shore around Irwin Bay and across the low lands to Ash River Falls. A thin strip of high site potential follows the Ash River. From the Ash's confluence with the Black Duck River, both rivers are lined by high site potential, as are their source lakes, Ash and Black Duck lakes. Nearby, to the east, Elephant Lake also follows this pattern.
High site potential also follows the eastern boundary of the subsection, beginning at the most northern point of the subsection on the south shore of Rainy Lake. Along the way, it branches off into river valleys. A large area of high site potential extends southwest from this border along the Rat Root River and into Rat Root Lake.
In St. Louis County, a zone of high site potential starts at the east shore of Pelican Lake and follows the Pelican River to the Vermilion River. Arms of high site potential stretch east from the Pelican River to Myrtle Lake to Kjostad Lake to the Vermilion River, and over lowlands east of Myrtle Lake. From Pelican Lake, branches of high site potential stretch northeast to Moose Lake to Bell Lake to the Pelican River, along Cusson Creek, and along other small watercourses and low site potential areas throughout the region, such as along Clear Creek. A smaller zone of high site potential follows from the Pelican River southeast along the Elbow River to Elbow Lake, and to Ban and Winchester lakes. Most of the length of the Vermilion River abuts areas designated high site potential.
In the northwestern corner of the subsection, straight line artifacts are apparent where low resolution digital elevation data abut the higher resolution data. These should not be interpreted as predictive features. Similar artifacts of the digital elevation data are found around the edges of the Gheen quadrangle, which exhibits banding. For the most part, however, elevation data in this subsection are of the highest quality available.
8.18.2.2 Evaluation
The site probability model from Agassiz Lowlands (Figure 8.18.3). Littlefork-Vermilion Uplands subsections was selected to represent Littlefork-Vermilion Uplands subsection. This model is composed of eight variables (Table 8.18.1).
Table 8.18.1. Site Probability Model, Agassiz Lowlands -- Littlefork-Vermilion Uplands Subsections.
Intercept |
12.854 |
|
ln(nonsites/sites) |
4.215 |
|
Variable |
Regression Coefficient |
Probability |
Distance to edge of nearest large lake |
-0.01173764 |
62.4 |
Distance to nearest lake, wetland, organic soil, or stream |
-0.09649622 |
100.0 |
Distance to nearest permanent wetland inlet/outlet |
-0.016982793 |
98.9 |
Elevation |
-0.01746815 |
96.5 |
Height above surroundings |
0.1149597 |
100.0 |
On alluvium |
1.566352 |
25.8 |
Vegetation diversity within 1 km |
0.6024363 |
92.6 |
Vertical distance to permanent water |
-0.03629524 |
100.0 |
When this site probability model was applied to the Littlefork-Vermilion Uplands subsection, it performed extremely well. In this model 92 percent of all modeled sites are in the high and medium site potential areas, which constitute 18.32 percent of landscape (Table 8.18.2). This produces a very strong overall gain statistic of 0.80087 (Table 8.6.11). The model did not test nearly as well, indicating that the model site population was not representative of the universe of sites in the region. Only 63.64 percent of test sites were predicted, producing a test gain statistic of 0.71208.
Table 8.18.2. Evaluation of the Littlefork-Vermilion Uplands Portion of Site Probability Model, Agassiz Lowlands - Littlefork-Vermilion Uplands Subsections.
Region (30 meter cells) |
Random Points |
Negative Survey Points |
Modeled Sites |
Test Sites |
||||||
# |
% |
# |
% |
# |
% |
# |
% |
# |
% |
|
Low |
5036256 |
79.56 |
1042 |
80.9 |
57 |
31.84 |
2 |
8 |
6 |
27.27 |
Medium |
377076 |
5.96 |
76 |
5.9 |
16 |
8.94 |
1 |
4 |
3 |
13.64 |
High |
782695 |
12.36 |
143 |
11.1 |
105 |
58.66 |
22 |
88 |
11 |
50.00 |
Water |
132515 |
2.09 |
27 |
2.1 |
0 |
0 |
0 |
0 |
2 |
9.09 |
Steep Slopes |
1929 |
0.03 |
0 |
0 |
1 |
0.56 |
0 |
0 |
0 |
0 |
Mines |
0 |
0 |
0 |
0 |
0 |
0 |
0 |
0 |
0 |
0 |
Total |
6330471 |
100 |
1288 |
100 |
179 |
100 |
25 |
100 |
22 |
100 |
The database for this subsection included 25 sites that were not single artifacts. However, the combined Agassiz Lowlands-Littlefork-Vermilion Uplands model was based on a total of 78 sites. Two preliminary combined models had 70 percent agreement in this subsection. This is a much higher level of agreement, than was recorded for the individual subsection models for Littlefork - Vermilion Uplands (49 percent). The Kappa statistic, which is adjusted for the amount of agreement expected by chance alone, for the combined models is 0.35445 (Table 8.6.11), the third lowest value in the state. The conditional Kappa statistics (Table 8.18.3) are lowest for the high and medium site potential zones, indicating that the distinction between these zones accounts for much of the model's instability. Vastly increasing the number of sites for modeling should improve confidence in the model and model stability.
Table 8.18.3. Conditional Kappa Values for the Littlefork-Vermilion Uplands Portion of Site Probability Model, Agassiz Lowlands - Littlefork-Vermilion Uplands Subsections.
Class |
Ki |
Proportion Correct |
Low |
0.3947 |
0.8031 |
Medium |
0.3156 |
0.4711 |
High |
0.3023 |
0.3707 |
8.18.2.3 Interpretation
Of the eight variables in the site probability model for the Littlefork-Vermillion Uplands, two are topographic, four are hydrologic, one represents vegetation, and one is geomorphic (Table 8.18.1).
8.18.2.3.1 Differences between Modeled Sites and Random Points for Individual Model Variables
All but two variables have correlation coefficients of 0.3 and greater with modeled sites (Table 8.18.4). Compared to random points, sites are more likely to be on alluvium (Figure 8.18.14c), at lower elevations (1185 vs. 1281 feet, Figure 8.18.8c), in areas of greater vegetation diversity (2.92 vs. 2.17, Figures 8.18.5.a and 8.18.13d), and closer to permanent wetland inlet/outlets (21.97 vs. 29.29 km, Figure 8.18.11c) and to the nearest lake, wetland, organic soil, or stream (25 vs. 114 meters, Figure 8.18.11a). Sites also are closer in the vertical dimension to permanent water (9.2 vs. 22.05 feet, Figures 8.18.4.b and 8.18.11d).
The only permanent wetland inlet/outlet within the Littlefork-Vermillion subsection is along the Pelican River, in northwestern St. Louis County. Another that has an effect on the model is northwest of the subsection near Loman, in Koochiching, at the confluence of the Rainy and Black rivers. This variable, then, provides very low resolution information about site distributions compared to other model variables.
The results of the Mann-Whitney U tests (Table 8.18.4) indicate that the six variables discussed above are significant at the 0.05 level. This means that the distribution of values for sites and random points are different enough for them to be considered drawn from different populations.
Table 8.18.4. Model Variable Statistics.
Littlefork-Vermillion Uplands |
Modeled Sites |
Surveyed Areas |
Modeled Sites |
Sites in Low Prob. |
Neg. Survey Points |
Random Points |
||||||
Model Variable |
Coeff. |
Sign. |
Coeff. |
Sign. |
Mean |
S.D. |
Mean |
S.D. |
Mean |
S.D. |
Mean |
S.D. |
Distance to nearest major ridge or divide |
- |
- |
0.03 |
0 |
62.4 |
38.06 |
106.78 |
10.4 |
93.73 |
36.8 |
79.28 |
32.72 |
Distance to nearest minor ridge or divide |
- |
- |
-0.34 |
0 |
20.97 |
16.95 |
20.1 |
20.68 |
24.13 |
12.04 |
27.74 |
13.48 |
Elevation |
-0.452 |
0 |
-0.272 |
0 |
1184.6 |
97.36 |
1243 |
69.3 |
1185.91 |
89.05 |
1280.78 |
92.34 |
Height above surroundings |
0.112 |
0.265 |
0.194 |
0.08 |
10.08 |
11.73 |
17 |
12.73 |
9.57 |
14.27 |
6.6 |
9.47 |
Size of major watershed |
- |
- |
-0.114 |
0 |
1567.56 |
610.67 |
1737.32 |
490.24 |
1357.84 |
450.37 |
1769.91 |
400.15 |
Direction to nearest water or wetland (sine) |
- |
- |
0.082 |
0.055 |
0.28 |
0.75 |
0.48 |
0.68 |
0.34 |
0.76 |
0.43 |
0.74 |
Distance to edge of nearest large wetland |
- |
- |
-0.037 |
0.148 |
27.12 |
9.5 |
16.49 |
6.95 |
18.01 |
12.56 |
17.64 |
11.94 |
Distance to edge of nearest large lake |
0.458 |
0.106 |
0.282 |
0 |
121.02 |
83.61 |
131.3 |
4.97 |
115.35 |
37.62 |
100.48 |
50.72 |
Distance to edge of nearest perennial river or stream |
- |
- |
-0.41 |
0 |
13.55 |
14.34 |
18.61 |
10.57 |
19.07 |
14.2 |
26.25 |
13.51 |
Distance to nearest confluence between perennial or intermittent streams and large rivers or intermittent streams and large rivers |
- |
- |
-0.5 |
0 |
38.49 |
34.52 |
55.26 |
59.18 |
46.07 |
26.28 |
68.71 |
27.77 |
Distance to nearest intermittent stream |
- |
- |
-0.038 |
0 |
66.1 |
35.32 |
45.85 |
18.21 |
71.84 |
32.97 |
54.52 |
27.24 |
Distance to nearest lake inlet/outlet |
- |
- |
0.001 |
0.005 |
60.14 |
30.67 |
93.51 |
13.14 |
75.74 |
30.49 |
67.37 |
23.71 |
Distance to nearest lake, wetland, organic soil, or stream |
-0.3 |
0 |
-0.308 |
0.244 |
4.95 |
4.85 |
8.86 |
4.79 |
10.13 |
7.48 |
10.67 |
9.04 |
Distance to nearest permanent lake inlet/outlet |
- |
- |
0.09 |
0 |
67.43 |
32.61 |
98.1 |
6.65 |
95.49 |
19.19 |
73.74 |
25.32 |
Distance to nearest permanent wetland inlet/outlet |
-0.587 |
0.003 |
- |
- |
148.21 |
39.88 |
193.49 |
32.66 |
178.33 |
28.12 |
171.14 |
37.46 |
Vertical distance to permanent water |
-0.281 |
0.005 |
- |
- |
9.2 |
13.09 |
34 |
15.56 |
24.21 |
45.57 |
22.05 |
28.8 |
Distance to aspen-birch |
- |
- |
-0.089 |
0.001 |
19.5 |
19.81 |
0 |
0 |
21.9 |
18.83 |
17.54 |
19.12 |
Distance to conifers |
- |
- |
-0.115 |
0.851 |
11.34 |
15.21 |
21.79 |
30.82 |
9.21 |
11.89 |
10.42 |
14.24 |
Distance to mixed hardwoods and pine |
- |
- |
0.136 |
0.851 |
132.42 |
53.57 |
151.58 |
4.56 |
139.95 |
60.3 |
148.86 |
39.55 |
Distance to hardwoods |
- |
- |
0.021 |
0 |
86.39 |
62.4 |
69.29 |
98 |
122.67 |
44.2 |
91.02 |
43.15 |
Distance to oak woodland |
- |
- |
-0.232 |
0.261 |
367.86 |
42.53 |
387.77 |
28.36 |
383.81 |
28.46 |
384.86 |
32.49 |
Distance to pine barrens or flats |
- |
- |
0.357 |
0.094 |
96.6 |
48.85 |
76.63 |
46.72 |
68.8 |
36.27 |
66.61 |
36.87 |
Distance to river bottom forest |
- |
- |
-0.229 |
0.928 |
142.4 |
101.29 |
189.29 |
51.25 |
189.74 |
50.2 |
186.1 |
61.47 |
Vegetation diversity within 1 km |
0.504 |
0 |
0.198 |
0 |
2.92 |
0.86 |
2 |
0 |
2.74 |
0.73 |
2.17 |
0.76 |
Distance to edge of nearest area of organic soils |
- |
- |
-0.193 |
0 |
32.34 |
10.9 |
8.86 |
4.79 |
24.28 |
13.3 |
29.36 |
13.88 |
Distance to glacial lake sediment |
- |
- |
0.04 |
0 |
46.94 |
58.73 |
7.09 |
10.02 |
74.95 |
63.73 |
39.29 |
47.06 |
On alluvium |
0.513 |
0 |
- |
- |
0.2 |
0.41 |
0 |
0 |
0.02 |
0.13 |
0.01 |
0.11 |
Frequency counts |
25 |
208 |
25 |
2 |
180 |
1288 |
||||||
See Interpretation section for discussion of the statistics:
Coeff. = correlation coefficient
Sign. = significance of the Mann-Whitney U test
S.D. = standard deviation
Distances and areas are expressed in square roots of meters. Square the values in the table to get actual values.
8.18.2.3.2 Relationships between Variable Pairs
Four out of a possible 28 pairs of variables in the site probability model have correlation coefficients greater than 0.5 (Table 8.18.5). Distance to the nearest large lake (Figure 8.18.9d) decreases with increased elevation. However, , vegetation diversity is higher away from large lakes. As elevation increases, vertical distance to permanent water and height above surroundings (Figure 8.18.4.a and Figures 8.18.8d) also increase.
Table 8.18.5. Variable Correlation Matrix.
Littlefork-Vermillion Uplands |
Elevation |
Height above surroundings |
Distance to edge of nearest large lake |
Distance to nearest lake, wetland, organic soil, or stream |
Distance to nearest permanent wetland inlet/outlet |
Vertical distance to permanent water |
Vegetation diversity within 1 km |
On alluvium |
Elevation |
1 |
|||||||
Height above surroundings |
0.48 |
1 |
||||||
Distance to edge of nearest large lake |
-0.87 |
-0.16 |
1 |
|||||
Distance to nearest lake, wetland, organic soil, or stream |
-0.35 |
-0.19 |
0.43 |
1 |
||||
Distance to nearest permanent wetland inlet/outlet |
0.06 |
0.04 |
0.03 |
0.48 |
1 |
|||
Vertical distance to permanent water |
0.56 |
0.79 |
-0.24 |
0.04 |
0.31 |
1 |
||
Vegetation diversity within 1 km |
-0.47 |
-0.16 |
0.58 |
0.01 |
-0.13 |
-0.15 |
1 |
|
On alluvium |
-0.46 |
-0.13 |
0.38 |
0.18 |
-0.07 |
-0.13 |
0.16 |
1 |
Refer to "Relationships between variable pairs" for interpretation of the table values.
8.18.2.3.3 Sites in Low Probability Areas
Only two sites are in low probability areas in the Littlefork-Vermillion Uplands, so the following discussion has little statistical significance. However, these two sites appear to be quite different from the population of all modeled sites (Table 8.18.4). On the variables elevation and distance to nearest lake, wetland, organic soil, or stream, their mean values are closer to those for random points than to those for sites. Sites in low probability areas are much higher above their surroundings (Figures 8.18.8d) and farther from large lakes (Figures 8.18.9d) than sites and random points. Sites in low probability areas are even more different from sites than are random points by being farther from permanent wetland inlet/outlets, at a greater distance above permanent water, in areas of lower vegetation diversity, and not on alluvium.
Of the 12 sites in low probability areas, two are mortuary/cemetery sites, two are mounds/earthworks, three are artifact scatters, and five are lithic scatters. If all sites types were equally well predicted by the model, eight percent of each site type would be found in low probability areas. However, three site types are overrepresented in the low probability areas. These are mortuary/cemetery sites (20 percent of all sites of this type are in low probability), mounds/earthworks (33.33 percent) and lithic scatters (23.81 percent). The model does a relatively poor job predicting these sites in this subsection.
8.18.2.3.4 Relationships between Cultural Context, Descriptive, or Settlement Variables and Site Potential
An attempt was made to examine the distribution of sites assigned to various cultural contexts or site types according to the three areas of site potential. Because of the paucity of sites in the subsection, the results of this analysis are not meaningful.
8.18.3 Survey Probability Model
8.18.3.1 Description
The survey probability model (Figure 8.18.6) for the Littlefork-Vermillion Uplands indicates that most environmental settings away from open water and streams have not been adequately surveyed. However, 41 percent of the low survey potential area is wetland.
The survey probability model is strikingly similar in pattern to the site probability model, with high and medium probability in the same general areas. The extent of the high and medium survey potential zones is only a slightly larger percentage of the landscape (21 vs. 18 percent) than in the site probability model.
Surveys in this subsection are concentrated in several locations representing only a very small portion of the landscape. For example, 77 surveyed points are found within a 100 sq. km area along a bay of Kabetogama Lake and the Ash/Black Duck River outlets. In another instance, 38 survey points are concentrated within 40 sq. km below the East Fork and Rat Root junction near Black Bay of Rainy Lake. Consequently, almost 80 percent of all surveyed places are concentrated within only 3 percent of the subsection territory. A few remaining surveys are scattered along the Little Fork River.
Four distinct zones of high survey potential surround these survey locations. The first is located at the north along the Rainy River and its southern tributaries. The second zone, in the northeast, spreads around Ash, Black Duck, Moose and Elephant Lakes. The third, a more fragmented zone, covers the territory from Pelican Lake to the eastern subsection border. The fourth is a narrow zone extending along nearly the entire Little Fork River. In all four zones, with the exception of the midstream of the Little Fork River, high and medium survey probability zones exceed extents of high and medium site probability.
Straight line artifacts of original elevation data are visible in the model and should not be considered as predictive features.
8.18.3.2 Evaluation
The survey probability model from Littlefork-Vermilion Uplands, Agassiz Lowlands, and Aspen Parklands subsections was selected to represent the Littlefork-Vermilion Uplands subsection. It is based on 24 variables (Table 8.18.6), representing topography, vegetation, soils, geomorphology and hydrology. When the survey probability model is applied to the Littlefork-Vermilion Uplands, it predicted surveyed places very well.
Table 8.18.6. Survey Probability Model, Littlefork-Vermilion Uplands, Agassiz Lowlands, and Aspen Parklands Subsections.
Intercept |
15.446 |
|
ln(nonsites/sites) |
1.921357209 |
|
Variable |
Regression coefficient |
Probability |
Direction to nearest water or wetland |
-0.2083746 |
100.0 |
Distance to aspen-birch |
0.009067051 |
100.0 |
Distance to conifers |
-0.01742775 |
100.0 |
Distance to edge of nearest area of organic soils |
-0.02000171 |
100.0 |
Distance to edge of nearest large lake |
-0.006447315 |
100.0 |
Distance to edge of nearest large wetland |
0.007661748 |
81.6 |
Distance to edge of nearest perennial river or stream |
-0.00548944 |
62.6 |
Distance to glacial lake sediment |
0.01206178 |
100.0 |
Distance to hardwoods |
-0.007828774 |
100.0 |
Distance to mixed hardwoods and pines |
-0.005505270 |
100.0 |
Distance to nearest confluence between perennial or intermittent streams and large rivers |
-0.01055636 |
100.0 |
Distance to nearest intermittent stream |
0.005373497 |
67.6 |
Distance to nearest lake inlet/outlet |
-0.008144397 |
100.0 |
Distance to nearest lake, wetland, organic soil, or stream |
-0.05448032 |
100.0 |
Distance to nearest major ridge or divide |
0.006981751 |
100.0 |
Distance to nearest minor ridge or divide |
-0.009719916 |
64.8 |
Distance to nearest permanent lake inlet/outlet |
0.007480810 |
100.0 |
Distance to oak woodland |
-0.009453103 |
100.0 |
Distance to pine barrens or flats |
0.01053629 |
100.0 |
Distance to river bottom forest |
.010036316 |
100.0 |
Elevation |
-0.01302934 |
100.0 |
Height above surroundings |
0.06082276 |
100.0 |
Size of major watershed |
0.00006009177 |
100.0 |
Vegetation diversity within 1 km |
0.4535275 |
100.0 |
The model predicts 88.88 percent of all surveyed places in the high and medium survey potential areas, which constitute 20.63 percent of the landscape (Table 8.18.7). This produces a strong gain statistic of 0.76788 (Table 8.6.14). It was able to predict surveyed places with almost the same precision as the site probability model was able to predict sites, indicating that the region has not been randomly surveyed. The low numbers of sites (28) and negative survey points (207) (Table 8.18.7) occurring over the large area of this subsection bear this out. Survey frequency (0.036 surveyed places per square km) is much lower than average (Table 8.6.14). Site frequency in Littlefork-Vermillion Uplands, at only 0.005 known sites per square km, is the lowest in the state.
Table 8.18.7. Evaluation of the Littlefork-Vermilion Uplands Portion of Survey Probability Model, Littlefork-Vermilion Uplands, Agassiz Lowlands, and Aspen Parklands Subsections.
Region (30 meter cells) |
All random points |
All negative survey points |
All sites |
All sites and negative survey points |
||||||
# |
% |
# |
% |
# |
% |
# |
% |
% |
||
Low |
4889950 |
77.24 |
1013 |
78.65 |
19 |
10.61 |
3 |
10.71 |
22 |
10.63 |
Medium |
697511 |
11.02 |
142 |
11.02 |
17 |
9.50 |
7 |
25.00 |
24 |
11.59 |
High |
608566 |
9.61 |
106 |
8.23 |
142 |
79.33 |
18 |
64.29 |
160 |
77.29 |
Water |
132515 |
2.09 |
27 |
2.10 |
0 |
0 |
0 |
0 |
0 |
0 |
Steep Slopes |
1929 |
0.03 |
0 |
0 |
1 |
0.56 |
0 |
0 |
1 |
0.48 |
Mines |
0 |
0 |
0 |
0 |
0 |
0 |
0 |
0 |
0 |
0 |
Total |
6330471 |
100 |
1288 |
100 |
179 |
100 |
28 |
100 |
207 |
100 |
The combined subsection database used to build the model included 1124 surveyed places. Only 207 of these were from Littlefork-Vermillion Uplands. Two preliminary survey probability models had 89.58 percent agreement, when applied to the Littlefork-Vermilion Uplands subsection. The Kappa statistic for these models was 0.70685 (Table 8.6.13), making this model one of the most stable in the state. The conditional Kappa statistics (Table 8.18.8) are lowest for the medium site potential zone, but this is only 11 percent of the subsection area. As the model shows a very high degree of survey bias, distributing new surveys throughout the undersurveyed areas is warranted. A large number of new surveys will be required before this subsection can be modeled on its own.
Table 8.18.8. Conditional Kappa Values for the Littlefork-Vermilion Uplands Portion of Survey Probability Model, Littlefork-Vermilion Uplands, Agassiz Lowlands, and Aspen Parklands Subsections.
Class |
Ki |
Proportion Correct |
Low |
0.7719 |
0.9503 |
Medium |
0.3805 |
0.4333 |
High |
0.8085 |
0.8339 |
8.18.3.3 Interpretation
There are 24 variables in the survey probability model (Tables 8.18.6) and only eight variables in the site probability model (Table 8.18.1). This difference can be attributed to the number of records available for modeling (1124 surveyed places vs. 78 sites). Five variables are found in both models. The survey probability model is composed of five topographic, nine hydrologic, eight vegetation, and two soil variables. Only five of these are correlated with model values at surveyed places with coefficients of 0.3 or higher (Table 8.18.4).
Surveys tend to be conducted near minor ridges or divides (Figure 8.18.8b), perennial rivers or streams (Figure 8.18.10a), confluences of perennial or intermittent streams and rivers (Figure 8.18.10b), and lakes, wetlands, organic soils or streams (Figure 8.18.11a). On the other hand, surveys tend to be conducted in areas away from pine barrens or flats (Figure 8.18.13b), with sites being found much farther from pine areas than negative survey points.
Negative survey points are much farther from glacial lake sediment (5,618 meters) than are sites (2,203 meters) or random points (1,544 meters, Figure 8.18.14b). Compared to both modeled sites and random points, they are also farther from major ridges and divides (Figure 8.18.8a), intermittent streams (Figure 8.18.10c), lake inlet/outlets (Figure 8.18.10d), permanent lake inlet/outlets (Figure 8.18.11b), aspen-birch (Figure 8.18.12a), and hardwoods (Figure 8.18.12c). Negative survey points are, on the average, in smaller major watersheds (Figure 8.18.9a) than modeled sites or random points.
Negative points are closer, however, to organic soil (590 meters) than either sites (1,045 meters) or random points (862 meters, Figure 8.18.14a). They are also closer to conifers (Figure 8.18.12b).
Negative survey points tend to be most similar to modeled sites in their greater height above surroundings (Figure 8.18.4.a and Figure 8.18.8d), vegetation diversity within 1 kilometer (Figure 8.18.5.a and Figure 8.13.3d), and proximity to mixed hardwoods and pine (Figure 8.18.12d). Like sites, negative survey points tend to be in a less southerly direction from water than random points (Figure 8.18.9b).
Negative survey points are found in areas most typical of random points with regards to distance to nearest large wetland (Figure 8.18.9c), distance to nearest lake, wetland, organic soil or stream (Figure 8.18.11c), distance to oak woodland (Figure 8.18.13a), and distance to river bottom forest (Figure 8.18.13c).
Results of the Mann-Whitney U tests (Table 8.18.4) indicate that 16 variables are significant at the 0.05 level. This means that negative survey and random points are different enough to have been drawn from different populations. The eight variables that fail to meet the minimal requirements for significance may be in the model because of data from Agassiz Lowlands or Aspen Parklands, which contributed more surveyed places to the model than did Littlefork-Vermilion Uplands.
8.18.4 Survey Implementation Model
The survey implementation model for Littlefork-Vermilion Uplands indicates that 72.02 percent of the land area is categorized as unknown because of inadequate survey (Table 8.18.9 and Figure 8.18.7). Water and wetlands cover 42.57 percent of the unknown area. However, the peat bogs in this subsection should be considered locations for future survey because of their ability to preserve archaeological properties that might deteriorate in other environments. Six test sites (27.27 percent) came from the unknown area.
High probability areas are found primarily along rivers and streams and near lakes. These include areas of suspected and possibly high site potential in places not typical of those previously surveyed. Low and possibly low probability areas occupy only 7.54 percent of the landscape because of the strong survey bias observed in this subsection.
Table 8.18.9. Evaluation of Survey Implementation Model, Littlefork-Vermilion Uplands Subsection.
Region (30 meter cells) |
Random Points |
Negative Survey Points |
Single Artifacts |
Sites |
||||||
# |
% |
# |
% |
# |
% |
# |
% |
# |
% |
|
Unknown |
4559192 |
72.02 |
939 |
72.9 |
17 |
9.44 |
1 |
33.33 |
1 |
4 |
Possibly Low |
358846 |
5.67 |
81 |
6.29 |
7 |
3.89 |
1 |
33.33 |
1 |
4 |
Low |
118218 |
1.87 |
22 |
1.71 |
34 |
18.89 |
0 |
0 |
0 |
0 |
Suspected Medium |
189585 |
2.99 |
45 |
3.49 |
3 |
1.67 |
0 |
0 |
0 |
0 |
Possibly Medium |
108032 |
1.71 |
17 |
1.32 |
2 |
1.11 |
0 |
0 |
0 |
0 |
Medium |
79459 |
1.26 |
14 |
1.09 |
11 |
6.11 |
0 |
0 |
1 |
4 |
Suspected High |
141173 |
2.23 |
29 |
2.25 |
0 |
0 |
0 |
0 |
1 |
4 |
Possibly High |
230633 |
3.64 |
44 |
3.42 |
8 |
4.44 |
1 |
33.33 |
4 |
16 |
High |
410889 |
6.49 |
70 |
5.43 |
97 |
53.89 |
0 |
0 |
17 |
68 |
Water |
132515 |
2.09 |
27 |
2.1 |
0 |
0 |
0 |
0 |
0 |
0 |
Steep Slopes |
1929 |
0.03 |
0 |
0 |
1 |
0.56 |
0 |
0 |
0 |
0 |
Mines |
0 |
0 |
0 |
0 |
0 |
0 |
0 |
0 |
0 |
0 |
Total |
6330471 |
100 |
1288 |
100 |
180 |
100 |
3 |
100 |
25 |
100 |
The eastern 32 km of the Rainy River landscape suitability model (Section 12.5) follow the northern boundary of this subsection and extent about 20 km up the valley of the Little Fork River. This model should be consulted for information regarding the geomorphic potential for both surface and subsurface archaeological sites.
8.19 Mille Lacs Uplands
8.20 Minnesota River Prairie
8.21 Oak Savanna
8.22 Pine Moraines & Outwash Plains
8.23 Red River Prairie
8.24 Rochester Plateau
8.25 St. Croix Moraines and Outwash Plains (Twin Cities Highlands)
8.26 St. Louis Moraines/ Tamarack Lowlands
8.27 Conclusion
References
The Mn/Model Final Report (Phases 1-3) is available on CD-ROM. Copies may be requested by visiting the contact page.

Acknowledgements
MnModel was financed with Transportation Enhancement and State Planning and Research funds from the Federal Highway Administration and a Minnesota Department of Transportation match.
Copyright Notice
The MnModel process and the predictive models it produced are copyrighted by the Minnesota Department of Transportation (MnDOT), 2000. They may not be used without MnDOT's consent.