Quick Links
Chapters
- Management Summary
- Research Design & Time Line
- Environment & Native American Culture
- GIS Design
- Archaeological Database
- Archaeological & Environmental Variables
- Model Development & Evaluation
- Model Results & Interpretation
- Project Applications
- Model Enhancements
- Model Implementation
- Landscape Suitability Models
- Summary & Recommendations
Appendices
- Archaeological Predictive Modeling: An Overview
- GIS Standards & Procedures
- Archaeology Field Survey Standards, Procedures & Rationale
- Archaeology Field Survey Results
- Geomorphology Survey Profiles, Sections, & Lists
- Building a Macrophysical Climate Model for the State of Minnesota
- Correspondence of Support for Mn/Model
- Glossary
- List of Figures
- List of Tables
- Acknowledgments
8.20 MINNESOTA RIVER PRAIRIE SUBSECTION OF NORTH CENTRAL GLACIATED PLAINS SECTION
8.20.1 Environmental Context
8.20.2 Site Probability Model
8.20.3 Survey
Probability Model
8.20.4 Survey Implementation Model
8.20.5 Other Models
This regional model report is organized as described in Sections 8.2.1 through 8.4.1. Refer to these sections of the report for explanations of the tables, variables, and statistics.
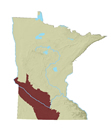
Minnesota River Prairie is a subsection of the North Central Glaciated Plains Section of the Prairie Parkland Province. It is the largest subsection of all ECS units modeled (Figure 8.1) (Minnesota DNR 1998).
Boundaries of this subsection are defined primarily by geomorphology. The northeastern border with the Red River Prairie is based on the interface between the southern extent of the Agassiz Lake Plain and Des Moines moraines on the south. The eastern boundary that adjoins the Hardwood Hills and the Big Woods subsections is based on the interface between Alexandria stagnation moraines, to the north and east, and the Des Moines ground moraines to the south. Further east, the border with the Big Woods follows an ecotone between Big Woods to the east and prairie to the west, as interpreted by Marschner (1974) (Figure 8.20.1.b). The southeast border with the Oak Savanna subsection is based on the ecotone between prairie to the west and oak savanna / prairie complex to the east. The western border from Iowa follows the Des Moines River north to where the river heads west and the border then becomes the interface between the till plain within the subsection and the Coteau to the west to the South Dakota state border (Dan Hanson, personal communication 1997).
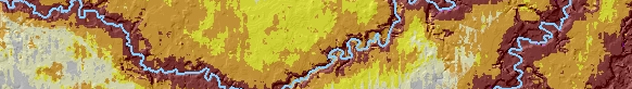
The subsection is predominantly on ground moraine (Figure 8.20.2a). Topography is gently rolling. The Minnesota River, with associated alluvium and river terraces splits this region in half from northwest to southeast. There are two significant areas of glacial lake sediment located at the north end and the south end of the subsection. The Minnesota and Blue Earth rivers are the most prominent hydrologic features (Figure 8.20.1a). Several outwash channels cut through the region, but only some are occupied by present-day streams. Many of the wetlands in this subsection have been drained for agriculture. Poorly drained soils are quite extensive (Figure 8.20.2b).
Historic vegetation was predominantly prairie, with wet prairie, marshes and sloughs distributed throughout the subsection (Figure 8.20.1b). River bottom forest, consisting of silver maple, elm, cottonwood, and willow, populated the river valleys. Small stands of the Big Woods forest community occurred along the eastern border.
8.20.2.1 Description
The distribution of medium and high site potential in the site probability model for the Minnesota River Prairie (Figure 8.20.3) are primarily along major rivers and around larger lakes. The main channel of the Minnesota River Valley contains the longest (300-km) continuous high and medium site potential zone, extending from the western border of the state to the southeastern subsection border. This zone begins along the reservoir-lakes Big Stone and Traverse at the extreme northwest of the subsection and continues uninterrupted to the Minnesota's confluence with the Mississippi River. Major tributaries of the Minnesota are also lined by zones of high and medium site potential. Probability values tend to be high adjacent to water and decline to medium with greater distance from water. Concentrated zones of high and medium site potential also occur around Swan Lake near the Minnesota River bend and around a group of small lakes in Kandiyohi, Meeker and McLeod counties at the north of the subsection.
The traces of vertical striping from banded digital elevation data are prevalent in the eastern part of the subsection from Renville County to the eastern border. These artifacts should not be considered predictive features.
8.20.2.2 Evaluation
The site probability model for the Minnesota River Prairie performed very well. It is based on 17 variables (Table 8.20.1) representing topography, vegetation, soils and hydrology.
Table 8.20.1. Site Probability Model, Minnesota River Prairie Subsection.
Intercept |
-0.445 |
|
ln(nonsites/sites) |
1.398092395 |
|
Variable |
Regression Coefficient |
Probability |
Distance to brushlands |
0.02416896 |
100 |
Distance to edge of nearest perennial river or stream |
-0.009067593 |
98 |
Distance to edge of nearest swamp |
-0.02100625 |
100 |
Distance to hardwoods |
-0.009038448 |
100 |
Distance to nearest confluence between perennial or intermittent streams and large rivers |
-0.007934209 |
94.6 |
Distance to nearest intermittent stream |
0.01182407 |
98.6 |
Distance to nearest lake, wetland, organic soils, or stream |
-0.04553736 |
100 |
Distance to nearest major ridge or divide |
-0.008993313 |
100 |
Distance to oak woodland |
-0.02461310 |
100 |
Distance to prairie |
0.01604437 |
100 |
Distance to sugar maple |
0.003923996 |
94.6 |
Height above surroundings |
0.05816495 |
100 |
On alluvium |
0.6502604 |
98.3 |
On river terraces |
0.6446472 |
75.6 |
Size of nearest lake |
0.0006067873 |
70.8 |
Vegetation diversity within 1 km |
0.3166257 |
100 |
Vertical distance to water |
0.006682293 |
91.4 |
In this model, 82.98 percent of all modeled sites are in high/medium site potential areas, which make up only 19.84 percent of the landscape (Table 8.20.2). This produces a strong gain statistic of 0.76091 (Table 8.6.11). The model tested nearly as well, predicting 80.7 percent of the test sites. The test gain statistic was 0.75421.
Table 8.20.2. Evaluation of the Site Probability Model, Minnesota River Prairie Subsection.
Region (30 meter cells) |
Random Points |
Negative Survey Points |
Modeled Sites |
Test Sites |
||||||
# |
% |
# |
% |
# |
% |
# |
% |
# |
% |
|
Low |
27673666 |
79.34 |
3079 |
78.51 |
812 |
49.75 |
156 |
16.10 |
10 |
17.54 |
Medium |
5189284 |
14.88 |
606 |
15.45 |
454 |
27.82 |
258 |
26.63 |
15 |
26.32 |
High |
1729036 |
4.96 |
209 |
5.33 |
365 |
22.37 |
546 |
56.35 |
31 |
54.39 |
Water |
270840 |
0.78 |
25 |
0.64 |
1 |
0.06 |
4 |
0.41 |
0 |
0 |
Steep Slopes |
14821 |
0.04 |
3 |
0.08 |
0 |
0 |
5 |
0.52 |
1 |
1.75 |
Mines |
0 |
0 |
0 |
0 |
0 |
0 |
0 |
0 |
0 |
0 |
Total |
34877647 |
100 |
3922 |
100 |
1632 |
100 |
969 |
100 |
57 |
100 |
The database included 969 sites that were not single artifacts. This is the largest number of sites within any subsection. Two preliminary models using different halves of the known sites had 83 percent agreement (83 percent of the cells in the subsection were classified the same in both models). However, the Kappa statistic, which is adjusted for the amount of agreement expected by chance alone, for this model is 0.58827 (Table 8.6.10), only somewhat higher than average. The conditional Kappa statistics (Table 8.20.3) are lowest for the medium and high site potential zones. This indicates that the model's primary instability is in distinguishing between these two zones.
Table 8.20.3. Conditional Kappa Values for Site Probability Model, Minnesota River Prairie.
Class |
Ki |
Proportion Correct |
Low |
0.6716 |
0.9179 |
Medium |
0.3817 |
0.4744 |
High |
0.7074 |
0.7367 |
8.20.2.3 Interpretation
Seventeen variables are used to build the site probability model for the Minnesota River Prairie (Table 8.20.1). Of these variables, two are topographic, seven are hydrologic, six are vegetative, and two relate to soils or landforms. Ten of these variables have correlation coefficients with modeled sites greater than 0.3 (Table 8.20.4).
8.20.2.3.1 Differences between Modeled Sites and Random Points for Individual Model Variables
The proximity of high and medium probability to water features is reflected in these statistical relationships. Sites also tend to be nearer perennial rivers or streams (1079 vs. 3,600 meters, Figure 8.20.10c), intermittent streams (993 vs. 1,535 meters, Figure 8.20.11a), swamps (532 vs. 1,379 meters, Figure 8.20.10d), confluences between perennial or intermittent streams and large rivers (4,128 vs. 10,588 meters, Figure 8.20.11c), and lakes, wetlands organic soils, or streams (114 vs. 324 meters, Figure 8.20.10b) compared to random points. Sites are also associated with somewhat larger lakes than would be expected by chance (Figure 8.20.11d).
Sites are more likely than random points to be on either alluvium (Figure 8.20.15a) or river terraces (Figure 8.20.15b). They are higher than their surroundings by an average of 9.8 feet (Figure 8.20.4.a and Figure 8.20.9c) and are at greater vertical distances from water (26 vs. 10 feet, Figure 8.20.12b) compared to random points. This also puts them closer to major ridges or divides (Figure 8.20.9a).
Sites are strongly associated with areas of high vegetation diversity (Figures 8.20.4.b and 8.20.14d). In this subsection, that implies they are further from the dominant prairie community (Figure 8.20.14b) and closer to hardwoods (Figures 8.20.13c and 8.20.14c), sugar maples (Figures 8.20.5.a and 8.20.14c), oak woodland (Figure 8.20.13d), and brushlands (Figure 8.20.13a).
The Mann-Whitney U tests indicate that all 17 site model variables are significant at the 0.05 level (Table 8.20.4). This means that the sites and random points differ enough to be considered drawn from different populations and that this model is able to discriminate between the two.
Table 8.20.4. Model Variable Statistics.
Minnesota River Prairie |
Modeled Sites |
Surveyed Areas |
Modeled Sites |
Sites in Low Prob. |
Neg. Survey Points |
Random Points |
||||||
Model Variable |
Coeff. |
Sign. |
Coeff. |
Sign. |
Mean |
S.D. |
Mean |
S.D. |
Mean |
S.D. |
Mean |
S.D. |
Distance to nearest major ridge or divide |
-0.176 |
0 |
-0.261 |
0 |
61.06 |
32.55 |
67.62 |
32.28 |
62.13 |
31.03 |
70.17 |
32.6 |
Elevation |
- |
- |
-0.536 |
0 |
1038.43 |
110.18 |
1111.64 |
95.3 |
1050.25 |
95.77 |
1098.4 |
98.74 |
Height above surroundings |
0.609 |
0 |
0.525 |
0 |
14.77 |
15.88 |
5.54 |
4.57 |
7.29 |
8.57 |
5.03 |
6.14 |
Size of major watershed |
- |
- |
0.077 |
0 |
1687.25 |
381.09 |
1661.64 |
407.08 |
1664.33 |
382.12 |
1652.4 |
392.37 |
Distance to edge of nearest large lake |
- |
- |
0.184 |
0 |
82.39 |
46.07 |
86.94 |
38.01 |
87.01 |
40.23 |
92.23 |
38.69 |
Distance to nearest lake, wetland, organic soil, or stream |
-0.2 |
0 |
-0.336 |
0 |
10.69 |
7.11 |
15.42 |
9.95 |
14.19 |
9.42 |
18 |
10.87 |
Distance to edge of nearest perennial river or stream |
-0.487 |
0 |
-0.625 |
0 |
32.85 |
27.14 |
59.64 |
30.57 |
47.34 |
29.86 |
60.01 |
29.92 |
Distance to edge of nearest swamp |
-0.37 |
0 |
-0.404 |
0 |
23.07 |
13.21 |
34.65 |
16.62 |
30.64 |
15.3 |
37.14 |
16.56 |
Distance to nearest intermittent stream |
-0.118 |
0 |
-0.296 |
0 |
31.51 |
16.82 |
37.46 |
20.64 |
36.18 |
21.63 |
39.18 |
22.22 |
Distance to nearest permanent lake inlet/outlet |
- |
- |
-0.262 |
0 |
82.85 |
45.55 |
106.61 |
33.72 |
100.32 |
47.77 |
104.89 |
35.65 |
Distance to nearest confluence between perennial or intermittent streams and large rivers |
-0.517 |
0 |
- |
- |
64.25 |
46.75 |
106.72 |
40.14 |
83.48 |
46.2 |
102.88 |
43.06 |
Size of nearest lake |
0.104 |
0 |
- |
- |
464.17 |
800.78 |
208.55 |
327.61 |
318.34 |
611.34 |
270.18 |
478.5 |
Size of nearest permanent lake |
- |
- |
0.014 |
0 |
464.75 |
802.09 |
208.61 |
327.65 |
324.27 |
618.07 |
271.83 |
481.43 |
Vertical distance to water |
0.387 |
0 |
- |
- |
25.79 |
37.9 |
7.93 |
15.38 |
13.34 |
25.38 |
10.47 |
18.71 |
Vertical distance to permanent water |
- |
- |
0.344 |
0 |
37.35 |
46.21 |
20.86 |
31.72 |
36.11 |
50.5 |
23.29 |
33.95 |
Distance to aspen-birch |
- |
- |
0.091 |
0 |
364.85 |
83.14 |
358.4 |
95.1 |
363.09 |
81.12 |
352.94 |
93.5 |
Distance to brushlands |
-0.242 |
0 |
- |
- |
88.17 |
50.36 |
107.54 |
46.66 |
89.59 |
52.38 |
108.17 |
50.26 |
Distance to Big Woods |
- |
- |
-0.339 |
0 |
94.76 |
84.45 |
123.83 |
70.35 |
97.46 |
78.33 |
131.81 |
77.95 |
Distance to hardwoods |
-0.509 |
0 |
- |
- |
41.96 |
41.53 |
76.2 |
37.09 |
58.9 |
42.51 |
80.21 |
39.69 |
Distance to oak woodland |
-0.265 |
0 |
- |
- |
89.92 |
49.2 |
111.88 |
42.39 |
95.71 |
49.88 |
111.18 |
47.77 |
Distance to paper birch |
- |
- |
-0.127 |
0 |
249.66 |
109.64 |
271.47 |
80.77 |
247.68 |
110 |
271.34 |
92.19 |
Distance to prairie |
0.33 |
0 |
- |
- |
12.16 |
15.45 |
7.6 |
14.56 |
8.94 |
15.01 |
5.67 |
13.03 |
Distance to sugar maple |
-0.327 |
0 |
- |
- |
120.5 |
76.63 |
141.68 |
48.39 |
129.29 |
72.4 |
142.21 |
58.43 |
Vegetation diversity within 1 km |
0.357 |
0 |
0.431 |
0 |
2.38 |
0.85 |
1.86 |
0.76 |
2.1 |
0.83 |
1.76 |
0.72 |
On alluvium |
0.3 |
0 |
- |
- |
0.2 |
0.4 |
0 |
0 |
0.07 |
0.26 |
0.03 |
0.16 |
On river terraces |
0.204 |
0 |
0.429 |
0 |
0.1 |
0.3 |
0.01 |
0.08 |
0.12 |
0.32 |
0.02 |
0.13 |
Frequency counts |
969 |
2667 |
969 |
156 |
1632 |
3922 |
||||||
See Interpretation section for discussion of the statistics:
Coeff. = correlation coefficient
Sign. = significance of the Mann-Whitney U test
S.D. = standard deviation
Distances and areas are expressed in square roots of meters. Square the values
in the table to get actual values.
8.20.2.3.2 Relationships between Variable Pairs
There is very little overlap or redundancy between the site model variables, as indicated by the correlation matrix (Table 8.20.5). Only four variables have correlation coefficients greater than 0.5; a majority are less than 0.1.
Since oak woodland and brushlands are often adjacent, as distance to oak woodland declines, distance to brushlands also tends to decline. Likewise, sugar maple is a component of hardwood forests in the Minnesota River Valley and on the margins of the study area (Figure 8.20.1), so distance to sugar maple and distance to hardwoods are positively correlated. Further, as sites increase in relation to height above their surroundings, vertical distance to water also rises. Finally, distance to nearest perennial river or stream generally decreases as distance to nearest confluence between perennial or intermittent streams and large rivers also declines.
Table 8.20.5. Variable Correlation Matrix.
Minnesota River Prairie |
Distance to nearest major ridge or divide |
Height above surroundings |
Distance to nearest lake, wetland, organic soil, or stream |
Distance to edge of nearest perennial river or stream |
Distance to edge of nearest swamp |
Distance to nearest intermittent stream |
Distance to nearest confluence between perennial or intermittent streams and large rivers |
Size of nearest lake |
Vertical distance to water |
Distance to nearest major ridge or divide |
1 |
||||||||
Height above surroundings |
0.02 |
1 |
|||||||
Distance to nearest lake, wetland, organic soil, or stream |
0.02 |
0.06 |
1 |
||||||
Distance to edge of nearest perennial river or stream |
0.07 |
-0.28 |
0.19 |
1 |
|||||
Distance to edge of nearest swamp |
-0.05 |
-0.05 |
0.29 |
0.31 |
1 |
||||
Distance to nearest intermittent stream |
0.05 |
-0.19 |
0.15 |
0.32 |
-0.01 |
1 |
|||
Distance to nearest confluence between perennial or intermittent streams and large rivers |
0.09 |
-0.28 |
-0.01 |
0.65 |
0.17 |
0.4 |
1 |
||
Size of nearest lake |
-0.08 |
-0.12 |
-0.17 |
0.4 |
-0.06 |
0.22 |
0.33 |
1 |
|
Vertical distance to water |
0.05 |
0.59 |
0.37 |
-0.13 |
0.01 |
0.02 |
-0.21 |
-0.12 |
1 |
Distance to brushlands |
0.05 |
-0.14 |
-0.04 |
0.04 |
-0.07 |
0.12 |
0.18 |
-0.16 |
-0.08 |
Distance to hardwoods |
-0.05 |
-0.28 |
-0.05 |
0.33 |
0.26 |
0.04 |
0.43 |
0.12 |
-0.3 |
Distance to oak woodland |
0.02 |
-0.16 |
-0.05 |
0.06 |
-0.06 |
0.15 |
0.21 |
-0.15 |
-0.08 |
Distance to prairie |
-0.21 |
0.02 |
-0.06 |
-0.03 |
-0.04 |
0.08 |
-0.08 |
0.18 |
-0.03 |
Distance to sugar maple |
0.03 |
-0.24 |
-0.09 |
0.3 |
0.22 |
-0.02 |
0.47 |
0.16 |
-0.24 |
Vegetation diversity within 1 km |
-0.05 |
0.09 |
-0.01 |
-0.02 |
-0.1 |
0.11 |
-0.17 |
0.19 |
0.1 |
On alluvium |
-0.01 |
0.08 |
-0.05 |
-0.35 |
-0.23 |
-0.12 |
-0.37 |
-0.22 |
-0.01 |
On river terraces |
-0.11 |
0.12 |
0.03 |
-0.13 |
0.08 |
-0.14 |
-0.17 |
0.02 |
0.02 |
Minnesota River Prairie |
Distance to brushlands |
Distance to hardwoods |
Distance to oak woodland |
Distance to prairie |
Distance to sugar maple |
Vegetation diversity within 1 km |
On alluvium |
On river terraces |
|
Distance to nearest major ridge or divide |
|||||||||
Height above surroundings |
|||||||||
Distance to nearest lake, wetland, organic soil, or stream |
|||||||||
Distance to edge of nearest perennial river or stream |
|||||||||
Distance to edge of nearest swamp |
|||||||||
Distance to nearest intermittent stream |
|||||||||
Distance to nearest confluence between perennial or intermittent streams and large rivers |
|||||||||
Size of nearest lake |
|||||||||
Vertical distance to water |
|||||||||
Distance to brushlands |
1 |
||||||||
Distance to hardwoods |
0.22 |
1 |
|||||||
Distance to oak woodland |
0.98 |
0.2 |
1 |
||||||
Distance to prairie |
-0.33 |
-0.27 |
-0.29 |
1 |
|||||
Distance to sugar maple |
0.31 |
0.64 |
0.3 |
-0.14 |
1 |
||||
Vegetation diversity within 1 km |
-0.31 |
-0.41 |
-0.28 |
0.32 |
-0.32 |
1 |
|||
On alluvium |
-0.06 |
-0.26 |
-0.07 |
-0.01 |
-0.29 |
0.13 |
1 |
||
On river terraces |
-0.13 |
0.1 |
-0.14 |
0.1 |
0.14 |
-0.03 |
-0.17 |
1 |
Refer to "Relationships between variable pairs" for interpretation of the table values.
8.20.2.3.3 Sites in Low Probability Areas
Sites in low potential areas (Table 8.20.4) have means on 15 variables that are near the values for random points, and two variables have values between modeled sites and random points. There are nine variables where the values for sites in low potential areas are even more different from modeled sites than are random points. Compared to modeled sites and random points, sites in low probability areas are at higher elevations, have less height above their surroundings, are farther from confluences between perennial or intermittent streams and large rivers, are closer to smaller lakes and smaller permanent lakes, are closer to water and permanent water in the vertical dimension, and are less likely to be on alluvium or river terraces.
Of the 156 sites not predicted by the model, two are base camps, two are kill or butchering sites, two are mortuary/cemeteries, 21 are mounds or earthworks, 11 are rock art, 39 are artifact scatters, and 79 are lithic scatters. If all site types were predicted equally well by the model, 16 percent of each site type should be in the low probability areas. Base camps come closest to this expectation, with 14.3 percent of all base camps in low probability areas. Mortuary/cemetery sites (8.3 percent), mounds/earthworks (11 percent), and artifact scatters (12.8 percent) are underrepresented in the low probability areas, implying that the model does a relatively good job predicting these types of sites. On the other hand, kill/butcher sites (50 percent), rock art (61 percent), and lithic scatters (19.9 percent) are not well-predicted by this model.
8.20.2.3.4 Relationships between Cultural Context, Descriptive, or Settlement Variables and Site Potential
The relatively large number of sites in the Minnesota River Prairie provides a unique opportunity to examine the distribution of sites according to site potential and archaeological context. Table 8.20.6 is a composite of nine separate tables, each listing the number and percent of sites classified according to dichotomous variables and the three areas of site potential. The significance of each relationship is given by the chi-square statistic. Two of the nine relationships are significant at the 0.05 level. Sites containing Plains Village components are relatively more common in the high potential areas than are sites lacking this component (76.6 percent vs. 57.2 percent). Conversely, they are under represented in the low and medium potential areas. Aceramic sites tend to occur in higher percentages in the low potential areas compared to ceramic-bearing ones (18.4 percent vs. 12.0 percent). Archaic sites mirror this pattern with a higher percent of site in the low potential areas compared to sites lacking Archaic components (19.6 percent vs. 12.1 percent). Oneota and Mississippian sites, on the other hand, tend to occur in lower relative frequencies in these areas than sites lacking these components (6.4 percent and 4.8 percent vs. 14.2 percent and 13.7 percent).
Table 8.20.6. Summary of Bivariate Relationships between Nine Dichotomous Archaeological Variables and Three Areas of Site Potential, Minnesota River Prairie (Site Probability Model).
Low Potential |
Medium Potential |
High Potential |
Total |
Chi-square Test |
|||||||
Dichotomous Variable |
N |
% |
N |
% |
N |
% |
N |
% |
value |
Df |
p-value |
All Sites |
156 |
16.2 |
258 |
26.9 |
546 |
56.9 |
960 |
100.0 |
- |
- |
- |
Paleoindian |
2 |
10.0 |
4 |
20.0 |
14 |
70.0 |
20 |
100.0 |
0.95 |
2 |
0.62 |
Not Paleoindian |
49 |
13.4 |
101 |
27.6 |
216 |
59.0 |
366 |
100.0 |
|||
Archaic |
11 |
19.6 |
16 |
28.6 |
29 |
51.8 |
56 |
100.0 |
2.76 |
2 |
0.25 |
Not Archaic |
40 |
12.1 |
89 |
27.0 |
201 |
60.9 |
330 |
100.0 |
|||
Woodland |
42 |
13.4 |
88 |
28.0 |
184 |
58.6 |
314 |
100.0 |
0.73 |
2 |
0.69 |
Not Woodland |
9 |
12.5 |
17 |
23.6 |
46 |
63.9 |
72 |
100.0 |
|||
Plains Village |
4 |
8.5 |
7 |
14.9 |
36 |
76.6 |
47 |
100.0 |
6.47 |
2 |
0.04 |
Not Plains Village |
47 |
13.9 |
98 |
28.9 |
194 |
57.2 |
339 |
100.0 |
|||
Oneota |
3 |
6.4 |
16 |
34.0 |
28 |
59.6 |
47 |
100.0 |
2.81 |
2 |
0.25 |
Not Oneota |
48 |
14.2 |
89 |
26.3 |
202 |
59.6 |
339 |
100.0 |
|||
Mississippian |
1 |
4.8 |
7 |
33.3 |
13 |
61.9 |
21 |
100.0 |
1.53 |
2 |
0.47 |
Not Mississippian |
50 |
13.7 |
98 |
26.8 |
217 |
59.5 |
365 |
100.0 |
|||
Aceramic |
117 |
18.4 |
170 |
26.7 |
349 |
54.9 |
636 |
100.0 |
6.68 |
2 |
0.04 |
Not Aceramic |
39 |
12.0 |
88 |
27.2 |
197 |
60.8 |
324 |
100.0 |
|||
Single Component |
43 |
14.7 |
77 |
26.3 |
173 |
59.0 |
293 |
100.0 |
2.41 |
2 |
0.30 |
Not Single Component |
8 |
8.6 |
28 |
30.1 |
57 |
61.3 |
93 |
100.0 |
|||
Mounds |
5 |
12.2 |
10 |
24.4 |
26 |
63.4 |
41 |
100.0 |
0.85 |
2 |
0.65 |
Not Mounds |
151 |
16.4 |
248 |
27.0 |
520 |
56.6 |
919 |
100.0 |
|||
8.20.3 Survey Probability Model
8.20.3.1 Description
The survey probability model (Figure 8.20.7) for the Minnesota River Prairie subsection indicates that environmental settings away from stream valleys and clusters of lakes have not been adequately surveyed. However, the distribution of the high and medium survey potential zones is greater than twice the amount of corresponding site potential zones.
As in the site probability model, the Minnesota River and its major tributaries comprise contiguous high and medium potential zones that are connected and expanded at river confluences. High survey potential zones are wider than those in the site probability model and have approximately 10-15 km average width along valleys and up to 40-60 km width near major confluences. Most tributaries of the Minnesota River, including minor creeks, are lined by zones of high and medium survey potential. These zones frequently extend further upstream than those in the site model.
Most surveys have been conducted on riverbanks, terraces or in close proximity to streams. There have been several linear surveys away from stream valleys, but with seemingly little effect on the survey potential level on these types of landscapes. Surveys conducted across landscapes in Chippewa, Stevens, Renville, McLeod, and Sibley Counties have a linear pattern but have little or no high or medium potential in their vicinities. The exception to this is in McLeod County.
Linear artifacts from the original elevation maps, known as "banding" because of their characteristic striped pattern, are very noticeable in the survey model. The affected area extends from Renville County to the eastern border of the subsection. These artifacts should not be considered as predictive features.
8.20.3.2 Evaluation
The survey probability model predicted surveyed places better than by chance, suggesting that surveys are not located randomly with the subsection. The model is based on 17 variables (Table 8.20.7), representing topography, vegetation, soils and hydrology.
Table 8.20.7. Survey Probability Model, Minnesota River Prairie Subsection.
Intercept |
1.283 |
|
ln(nonsites/sites) |
0.385647482 |
|
Variable |
Regression Coefficient |
Probability |
Distance to aspen-birch |
0.003135484 |
100 |
Distance to Big Woods |
-0.005971312 |
100 |
Distance to edge of nearest intermittent stream |
0.005286273 |
69.9 |
Distance to edge of nearest large lake |
0.003842949 |
96.1 |
Distance to edge of nearest perennial river or stream |
-0.008625312 |
100 |
Distance to edge of nearest swamp |
-0.01768766 |
100 |
Distance to major ridge or divide |
-0.007550767 |
100 |
Distance to nearest lake, wetland, organic soils, or stream |
-0.02533337 |
100 |
Distance to nearest permanent lake inlet/outlet |
0.004031382 |
98.5 |
Distance to paper birch |
0.004821792 |
100 |
Elevation |
-0.003494511 |
100 |
Height above surroundings |
0.04144106 |
100 |
On river terraces |
1.118862 |
100 |
Size of major watershed |
0.0006115077 |
100 |
Size of nearest permanent lake |
0.000187538 |
62.7 |
Vegetation diversity within 1 km |
0.2414957 |
100 |
Vertical distance to permanent water |
0 0.004734572 |
100 |
The model predicts 83.24 percent of all sites in high/medium survey potential areas, which make up 44.63 percent of the landscape (Table 8.20.8). This produces a weak gain statistic of 0.46384 (Table 8.6.14), which is slightly below average for a survey probability model. As lower gain statistics are considered desirable for these models, this indicates that surveys in this subsection are perhaps somewhat less biased than in other parts of the state.
In Minnesota River Prairie subsection, surveyed places were predicted with less precision than were sites. This indicates that sites are confined to only a portion of the total area surveyed. However, the number of sites (1035) and negative survey points (1632) in the region (Table 8.20.8) indicate a frequency of 0.085 surveys per square km. This is below average for the state.
Table 8.20.8. Evaluation of Survey Probability Model, Minnesota River Prairie Subsection.
Region (30 meter cells) |
All random points |
All negative survey points |
All sites |
All sites and negative survey points |
||||||
# |
% |
# |
% |
# |
% |
# |
% |
# |
% |
|
Low |
19026549 |
54.56 |
2129 |
54.28 |
350 |
21.45 |
87 |
8.41 |
437 |
16.39 |
Medium |
6918529 |
19.84 |
787 |
20.07 |
268 |
16.42 |
99 |
9.57 |
367 |
13.76 |
High |
8643774 |
24.79 |
978 |
24.94 |
1013 |
62.07 |
840 |
81.16 |
1853 |
69.48 |
Water |
270840 |
0.78 |
25 |
0.64 |
1 |
0.06 |
4 |
0.39 |
4 |
0.15 |
Steep Slopes |
14821 |
0.04 |
3 |
0.08 |
0 |
0 |
5 |
0.48 |
6 |
0.22 |
Mines |
0 |
0 |
0 |
0 |
0 |
0 |
0 |
0 |
0 |
0 |
Total |
34874513 |
100 |
3922 |
100 |
1632 |
100 |
1035 |
100 |
2667 |
100 |
T
he database included 2667 surveyed places (Table 8.20.8). Two preliminary survey probability models had 79 percent agreement. The Kappa statistic for these models was 0.65697 (Table 8.16.14), which is higher than average. The conditional Kappa statistics (Table 8.20.9) are lowest for the medium potential zone, indicating that most instability in the model is distinguishing between this zone and the high and low site potential areas. Distributing more surveys throughout the undersurveyed areas should improve both model performance and model stability.
Table 8.20.9. Conditional Kappa Values for Survey Probability Model, Minnesota River Prairie.
Class |
Ki |
Proportion Correct |
Low |
0.8197 |
0.9189 |
Medium |
0.3615 |
0.4892 |
High |
0.7769 |
0.8327 |
8.20.3.3 Interpretation
Like the site model, the survey model (Figure 8.20.7) also consists of 17 variables. It has only eight variables in common with the site model. About half of the survey probability model variables are hydrologic in nature; the remaining are equally divided between topography and vegetation with one landform variable (on river terraces). Nine of the survey model variables have correlation coefficients above 0.3 (Table 8.20.4).
Places that have been surveyed are lower in elevation (Figure 8.20.9b), but higher above water (Figures 8.20.6.a and 8.20.6.b), higher than their surroundings (Figures 8.20.4.a and 8.20.9c), closer to perennial rivers or streams (Figure 8.20.10c), swamps (Figure 8.20.10d), and Big Woods (Figure 8.20.13b) compared to random points. Surveyed areas also tend to be on river terraces (Figure 8.20.15b) and in environments with greater vegetation diversity within one kilometer (Figure 8.20.4.b) than random points. Negative survey points are similar to modeled sites in their proximity to major ridges and divides (Figure 8.20.9a) and to paper birch (Figure 8.20.14a) and their greater distance from aspen-birch (Figure 8.20.12d) compared to random points. Negative survey points are more similar to random points with respect to distance to nearest permanent lake inlet/outlet (Figure 8.20.11b) and size of nearest permanent lake (Figure 8.20.12a). Their mean values are between modeled sites and random points for size of major watershed (Figure 8.20.9d), distance to edge of nearest large lake (Figure 8.20.10a), distance to nearest lake, wetland, organic soil, or stream (Figure 8.20.10b), and distance to nearest intermittent stream (Figure 8.20.11a).
According to the Mann-Whitney U tests (Table 8.20.4), all variables are significant at the 0.05 level, which means that surveyed areas are different enough from random points to consider the two as drawn from different populations. This provides additional evidence that surveys have been conducted in a non-random fashion in this subsection.
8.20.4 Survey Implementation Model
The survey implementation model for the Minnesota River Prairie indicates that 52.63 percent of the subsection is classified as unknown because of inadequate survey (Table 8.20.10 and Figure 8.20.8). These areas are found throughout the subsection away from the Minnesota River, its major tributaries, and several small clusters of lakes. Only three test sites (5.26 percent) are from the unknown area.
Water and wetlands occupy only about 11 percent of the unknown area. The low and possibly low site potential zones account for 26.72 percent of the subsection. More surveys away from water are needed to improve model performance and reduce the extent of the unknown area.
Table 8.20.10. Evaluation of Survey Implementation Model, Minnesota River Prairie Subsection.
Region (30 meter cells) |
Random Points |
Negative Survey Points |
Single Artifacts |
Sites |
||||||
# |
% |
# |
% |
# |
% |
# |
% |
# |
% |
|
Unknown |
18354730 |
52.63 |
2061 |
52.55 |
332 |
20.34 |
9 |
13.64 |
59 |
6.09 |
Possibly Low |
5847799 |
16.77 |
658 |
16.78 |
227 |
13.91 |
4 |
6.06 |
51 |
5.26 |
Low |
3469851 |
9.95 |
360 |
9.18 |
253 |
15.5 |
10 |
15.15 |
46 |
4.75 |
Suspected Medium |
659351 |
1.89 |
65 |
1.66 |
15 |
0.92 |
0 |
0 |
16 |
1.65 |
Possibly Medium |
1030131 |
2.95 |
125 |
3.19 |
35 |
2.14 |
1 |
1.52 |
32 |
3.3 |
Medium |
3498269 |
10.03 |
416 |
10.61 |
404 |
24.75 |
18 |
27.27 |
210 |
21.67 |
Suspected High |
12468 |
0.04 |
3 |
0.08 |
3 |
0.18 |
0 |
0 |
3 |
0.31 |
Possibly High |
40599 |
0.12 |
4 |
0.1 |
6 |
0.37 |
1 |
1.52 |
10 |
1.03 |
High |
1675654 |
4.8 |
202 |
5.15 |
356 |
21.81 |
23 |
34.85 |
533 |
55.01 |
Water |
270840 |
0.78 |
25 |
0.64 |
0 |
0 |
0 |
0 |
4 |
0.41 |
Steep Slopes |
14821 |
0.04 |
3 |
0.08 |
1 |
0.06 |
0 |
0 |
5 |
0.52 |
Mines |
0 |
0 |
0 |
0 |
0 |
0 |
0 |
0 |
0 |
0 |
Total |
34874513 |
100 |
3922 |
100 |
1632 |
100 |
66 |
100 |
969 |
100 |
Landscape suitability models for the Minnesota River (Section 12.3), Mountain Lake Uplands (Section 12.15) and Nicollet Uplands (Section 12.16) are all within the Minnesota River Prairie Subsection. Areas of high buried site potential are found at all depths within the Minnesota River Valley. Buried site potential is present on the uplands, but is not as significant or as extensive. The landscape suitability models should be consulted for projects in the areas mapped. They are relevant for both surface and subsurface sites.
8.21 Oak Savanna
8.22 Pine Moraines & Outwash Plains
8.23 Red River Prairie
8.24 Rochester Plateau
8.25 St. Croix Moraines and Outwash Plains (Twin Cities Highlands)
8.26 St. Louis Moraines/ Tamarack Lowlands
8.27 Conclusion
References
The Mn/Model Final Report (Phases 1-3) is available on CD-ROM. Copies may be requested by visiting the contact page.

Acknowledgements
MnModel was financed with Transportation Enhancement and State Planning and Research funds from the Federal Highway Administration and a Minnesota Department of Transportation match.
Copyright Notice
The MnModel process and the predictive models it produced are copyrighted by the Minnesota Department of Transportation (MnDOT), 2000. They may not be used without MnDOT's consent.