Quick Links
Chapters
- Management Summary
- Research Design & Time Line
- Environment & Native American Culture
- GIS Design
- Archaeological Database
- Archaeological & Environmental Variables
- Model Development & Evaluation
- Model Results & Interpretation
- Project Applications
- Model Enhancements
- Model Implementation
- Landscape Suitability Models
- Summary & Recommendations
Appendices
- Archaeological Predictive Modeling: An Overview
- GIS Standards & Procedures
- Archaeology Field Survey Standards, Procedures & Rationale
- Archaeology Field Survey Results
- Geomorphology Survey Profiles, Sections, & Lists
- Building a Macrophysical Climate Model for the State of Minnesota
- Correspondence of Support for Mn/Model
- Glossary
- List of Figures
- List of Tables
- Acknowledgments
8.17 LAURENTIAN HIGHLANDS SUBSECTION OF NORTHERN SUPERIOR UPLANDS SECTION
8.17.1 Environmental Context
8.17.2 Site Probability Model
8.17.3 Survey
Probability Model
8.17.4 Survey Implementation Model
8.17.5 Other Models
This regional model report is organized as described in Sections 8.2.1 through 8.4.1. Refer to these sections of the report for explanations of the tables, variables, and statistics.
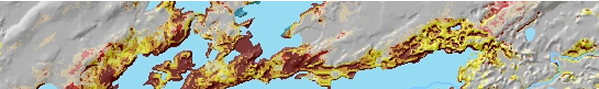
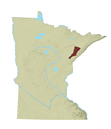
Laurentian Highlands is a subsection of the Northern Superior Uplands Section of the Laurentian Mixed Forest Province (Figure 8.1) (Minnesota DNR 1998). It is characterized by rolling topography, and there are some bedrock outcrops in the east. The dominant landform in the subsection is a drumlin field. The drumlins are oriented in a southwest-northeast direction with rivers and streams flowing southwest. Areas between drumlins are typically poorly drained. There are extensive areas of bog, particularly in the northern half of the subsection (Figure 8.17.2.b). An outwash plain is located along the eastern edge of the subsection (Figure 8.17.2.a).
The western boundary of the Laurentian Highlands is based on the interface between the St. Louis sublobe on the west and the St. Croix ground moraine on the east. The northern boundary is based on the drumlin features in the region. To the east, the boundary follows the interface between Superior Lobe ice-contact sediments and Rainy Lobe ice-contact sediments or outwash sediments, as interpreted on the MN Soil Atlas. The southern edge of the subsection is along the Saint Louis River (Minnesota DNR 1998), where alluvial soils are found (Figure 8.17.2.b). This subsection has a higher elevation than the surrounding regions and many rivers have their headwaters here, including the Saint Louis, Cloquet, and Whitefish rivers (Figure 8.17.1.a).
Before modern settlement, this subsection was dominated by the coniferous aspect of aspen-birch forest (Figure 8.17.1.b). Conifer bogs and swamps were found between the drumlins, where drainage was poor. White and red pine, conifer bogs, and jack pine barrens were interspersed throughout the northern part of the subsection. White and red pine also occurred south of Island Lake Reservoir. Small patches of mixed hardwoods and pine were scattered sparsely throughout the subsection. River bottom forest was found along the Cloquet River.
8.17.2.1 Description
There are two primary areas of high and medium site potential in this subsection (Figure 8.17.3). In the northwest part of the subsection, adjacent to the subsection border, high and medium site potentials surround the present day Whiteface Reservoir in central St. Louis County. In the southern part of the subsection, high and medium site potential is concentrated in the vicinity of the Island Lake and Boulder Lake Reservoirs. Topography appears to be a major influence on the extent of these areas. Low values of height above surrounding and slope (Figures 8.17.4.a and 8.17.4.b) correspond with the general pattern of high site potential around these reservoirs, as do high values of the variable distance to edge of nearest swamp. To a certain degree, the limits of high and medium site potential reflect minor watershed boundaries.
In the north central part of the subsection a smaller area of higher site potential occurs around Cadotte and Bassett lakes. At the western edge of the subsection, west of the Island Lake Reservoir, another small cluster of high and medium site potential is found along the Us-Kab-Wan-Ka River. These locations seem to coincide high values of the variables slope (Figure 8.17.4b), height above surroundings (Figure 8.17.4a), and distance to edge of nearest swamp.
8.17.2.2 Evaluation
The site probability model performed extremely well. It is based on 6 variables (Table 8.17.1) representing topography, vegetation, geomorphology, and hydrology.
Table 8.17.1. Site Probability Model, Laurentian Highlands Subsection.
Intercept |
-9.711 |
|
ln(non-sites/sites) |
1.193922468 |
|
Variable |
Regression Coefficient |
Probability |
Distance to edge of nearest swamp |
0.227659 |
100 |
Distance to glacial lake sediment |
-0.0299932 |
86.7 |
Height above surroundings |
-0.290533 |
100 |
Size of minor watershed |
0.000655579 |
85.8 |
Slope |
1.22585 |
86.7 |
Vegetation diversity within 1 km |
1.23513 |
100 |
In this model, 95 percent of all modeled sites are in high/medium site potential areas, which make up only 9.94 percent of landscape (Table 8.17.2). This produces a very strong gain statistic of 0.89537 (Table 8.6.11), the highest gain anywhere in the state. However, there is a strong bias in the location of surveys that accounts for this (Section 8.17.3). The model tested well, predicting 84 percent of test sites and producing a gain statistic of 0.88166. Until digital data for survey locations are available, it is impossible to evaluate whether this performance is the result of survey bias.
Region (30 meter cells) |
Random Points |
Negative Survey Points |
Modeled Sites |
Test Sites |
||||||
# |
% |
# |
% |
# |
% |
# |
% |
# |
% |
|
Low |
1887797 |
89.41 |
360 |
90.91 |
108 |
18.82 |
4 |
3.33 |
4 |
16 |
Medium |
104857 |
4.97 |
17 |
4.29 |
84 |
14.63 |
15 |
12.50 |
2 |
8 |
High |
104868 |
4.97 |
16 |
4.04 |
374 |
65.16 |
99 |
82.50 |
19 |
76 |
Water |
13744 |
0.65 |
3 |
0.76 |
8 |
1.39 |
2 |
1.67 |
0 |
0 |
Steep Slopes |
33 |
0.002 |
0 |
0 |
0 |
0 |
0 |
0 |
0 |
0 |
Mines |
0 |
0 |
0 |
0 |
0 |
0 |
0 |
0 |
0 |
0 |
Total |
2111299 |
100 |
396 |
100 |
574 |
100 |
120 |
100 |
25 |
100 |
The database for modeled sites included 120 sites that were not single artifacts. This is less than half the average number of sites for the Phase 3 regions (Table 8.6.11) and small enough to weaken the model. Two preliminary models for this region, using different halves of the known sites, had 77 percent agreement within the Laurentian subsection. This seems high, but the Kappa statistic, which is adjusted for the amount of agreement expected by chance alone, for these models was 0.15717 (Table 8.6.11), indicating extremely low stability. The conditional Kappa statistics (Table 8.17.3) are lowest for the high and medium site potential zones. Doubling the number of sites for modeling may improve confidence in the model and model stability, particularly if future surveys are dispersed throughout the subsection.
Table 8.17.3. Conditional Kappa Values for Site Probability Model, Laurentian Highlands Subsection
Class |
Ki |
Proportion Correct |
Low |
||
Medium |
||
High |
8.17.2.3 Interpretation
Only six variables are involved in the construction of the Laurentian Highlands site probability model (Table 8.17.4). The small number of variables is most likely a reflection of the low site numbers in this subsection. Three of the variables are topographic in nature, while the remaining are divided between hydrology, vegetation, and geomorphology.
8.17.2.3.1 Differences between Modeled Sites and Random Points for Individual Model Variables
Two of the variables have moderate to high correlation coefficients (Table 8.17.4). Sites are much further from swamps (Figure 8.17.10a) than random points (494 vs. 58 meters). As indicated by the very high coefficient (0.67), this variable has a strong effect on the model. The highest values for distance to edge of nearest swamp coincide with the three largest areas of high and medium site potential, which happen to be within and adjacent to large reservoir lakes. This may not be a fair representation of past conditions. Sites also occur more often in larger minor watersheds (8,708 acres, Figure 8.17.9c) compared to random points (6,651 acres).
Compared to random points, sites are also found at lower heights above their surroundings (Figures 8.17.4.a and 8.17.9a), in areas of more diverse vegetation (Figures 8.17.12a and 8.17.5.b), and nearer to glacial lake sediment (Figure 8.17.12b). This final variable is an indicator of more westerly locations, as the nearest glacial lake sediment is in the adjacent Tamarack Lowlands subsection. Sites are also on somewhat less sloping terrain (Figure 8.17.9d).
The results of the Mann-Whitney U tests indicate that all variables except slope are significant at the 0.05 level. In other words, the model is successful at isolating variables that discriminate between sites and random points to the extent that the sites can be considered to be drawn from a population different from the random points.
Table 8.17.4. Model Variable Statistics.
Laurentian Highlands |
Modeled Sites |
Surveyed Areas |
Modeled Sites |
Sites in Low Prob. |
Neg. Survey Points |
Random Points |
||||||
Model Variable |
Coeff. |
Sign. |
Coeff. |
Sign. |
Mean |
S.D. |
Mean |
S.D. |
Mean |
S.D. |
Mean |
S.D. |
Height above surroundings |
0.027 |
0 |
- |
- |
2.64 |
4.36 |
14.25 |
9.95 |
4.44 |
6.78 |
6.26 |
6.84 |
Relative elevation |
- |
- |
0.248 |
0 |
8.6 |
7.69 |
14.75 |
10.24 |
12.42 |
10.56 |
8.89 |
7.88 |
Size of minor watershed |
0.379 |
0 |
0.329 |
0 |
8708.55 |
735.28 |
7215.88 |
1405.99 |
8278.42 |
1151.26 |
6651.3 |
1573.1 |
Slope |
0.125 |
0.054 |
- |
- |
1.18 |
1.59 |
2.25 |
2.06 |
1.91 |
2.12 |
1.34 |
1.38 |
Distance to edge of nearest large wetland |
- |
- |
0.608 |
0 |
34.28 |
8.6 |
24.37 |
7.47 |
29.63 |
12.24 |
14.16 |
10.76 |
Distance to edge of nearest swamp |
0.674 |
0 |
0.648 |
0 |
22.22 |
7.98 |
10.63 |
8.36 |
17.39 |
9.34 |
7.6 |
6.39 |
Distance to nearest lake, wetland, organic soil, or stream |
- |
- |
0.219 |
0 |
15.69 |
8.57 |
11.39 |
5.22 |
11.97 |
7.42 |
8.06 |
6.44 |
Vertical distance to permanent water |
- |
- |
-0.193 |
0 |
-0.32 |
22.77 |
69 |
101.01 |
1.25 |
17.05 |
19.31 |
24.33 |
Distance to conifers |
- |
- |
0.125 |
0 |
14.36 |
9.17 |
9.76 |
11.83 |
8.34 |
9.43 |
6.22 |
9.22 |
Distance to hardwoods |
- |
- |
-0.2 |
0 |
63.63 |
20.38 |
78.32 |
47.21 |
60.51 |
29.74 |
108.32 |
49.47 |
Distance to river bottom forest |
- |
- |
-0.204 |
0 |
63.63 |
20.38 |
78.32 |
47.21 |
60.73 |
30.49 |
111.33 |
47.69 |
Distance to sugar maple |
- |
- |
-0.093 |
0 |
47.44 |
12.27 |
37.75 |
16.43 |
45.09 |
14.06 |
61.53 |
23.24 |
Vegetation diversity within 1 km |
0.154 |
0 |
0.313 |
0 |
3.08 |
0.59 |
3.25 |
0.96 |
3.2 |
0.74 |
2.51 |
0.74 |
Distance to glacial lake sediment |
-0.144 |
0 |
- |
- |
114.96 |
15.48 |
119.95 |
14.05 |
122.8 |
15.43 |
137.07 |
34.05 |
Distance to well-drained soils |
- |
- |
-0.012 |
0 |
0.28 |
1.64 |
0 |
0 |
1.45 |
4.5 |
3.29 |
6.21 |
Frequency counts |
120 |
746 |
120 |
4 |
574 |
396 |
||||||
See Interpretation section for discussion of the statistics:
Coeff. = correlation coefficient
Sign. = significance of the Mann-Whitney U test
S.D. = standard deviation
Distances and areas are expressed in square roots of meters. Square the values in the table to get actual values.
8.17.2.3.2 Relationships between Variable Pairs
There is only one relationship between model variables where the correlation is greater than 0.5 (Table 8.17.5). This involves a positive relationship between height above surroundings and slope (0.77). This relationship may explain why sites in this region tend to have less height above their surrounding landscape than random points, a situation found in only two other subsections.
Table 8.17.5. Variable Correlation Matrix.
Laurentian Highlands |
Distance to edge of nearest swamp |
Distance to glacial lake sediment |
Height above surroundings |
Size of minor watershed |
Slope |
Vegetation diversity within 1 km |
Distance to edge of nearest swamp |
1 |
|||||
Distance to glacial lake sediment |
0.21 |
1 |
||||
Height above surroundings |
-0.02 |
0.01 |
1 |
|||
Size of minor watershed |
-0.02 |
-0.46 |
-0.34 |
1 |
||
Slope |
-0.25 |
-0.09 |
0.77 |
-0.14 |
1 |
|
Vegetation diversity within 1 km |
-0.04 |
0.17 |
-0.12 |
0.01 |
-0.23 |
1 |
Refer to "Relationships between variable pairs" for interpretation of the table values.
8.17.2.3.3 Sites in Low Probability Areas
There are only four modeled sites in low site potential areas (Table 8.6.13.2). Compared to modeled sites and random points, these sites tend to be much higher than their surroundings, on steeper slopes, and in areas of somewhat greater vegetation diversity. They are also much closer to swamps than are modeled sites, though not as close as random points. One of these sites is an artifact scatter, and the other three are lithic scatters. All of the sites in the high probability and all but one site in medium probability are lithic scatters. Only artifact and lithic scatters have been found in the Laurentian Highlands.
8.17.2.3.4 Relationships between Cultural Context, Descriptive, or Settlement Variables and Site Potential
The small sample size in the Laurentian Highlands subsection precludes the possibility of examining the distribution of sites from various contexts over the three site potential classes. However, seven of the 120 modeled sites in this subsection have been identified as Paleoindian, three as Archaic, and three as Woodland. Only three sites contained ceramics. There are no mounds and only two multi-component sites.
8.17.3 Survey Probability Model
8.17.3.1 Description
The survey probability model for Laurentian Highlands indicates that most of the landscape has not been adequately surveyed (Figure 8.17.7). The distribution of sites and negative survey points indicates that 79 percent of all surveyed places, a total of 587, are around two reservoirs (Boulder Lake and Island Lake) in southeastern St. Louis County. Another cluster of 33 surveyed places (4.44 percent) is found along the southeastern border of the study area, lining the north shore of the Fish Lake Reservoir. Whiteface Reservoir accounts for 55 surveyed places along the western boundary of the subsection. Areas of high and medium survey potential are associated with all of these reservoirs. Other scattered areas of high and medium survey potential appear to be associated with smaller lakes, streams, and relief. Only 45 surveyed places (6.05 percent) in the Laurentian Highlands are associated with highway surveys. Their impact on the model is not readily apparent.
8.17.3.2 Evaluation
The survey probability model predicted surveyed places extremely well, indicating that surveys have not been located randomly within this region. The model is based on 12 variables (Table 8.17.6), representing topography, vegetation, soils and hydrology.
Table 8.17.6. Survey Probability Model, Laurentian Highlands Subsection.
Intercept |
-3.841 |
|
ln(non-surveys/surveys) |
-0.633311389 |
|
Variable |
Regression Coefficient |
Probability |
Distance to conifers |
0.03219485 |
41.1 |
Distance to edge of nearest large wetland |
0.03631094 |
89.7 |
Distance to edge of nearest swamp |
0.1224319 |
100 |
Distance to hardwoods |
0.06368202 |
94.2 |
Distance to nearest lake, wetland, organic soil, or stream |
-0.07132699 |
63.6 |
Distance to river bottom forest |
-0.07672056 |
100 |
Distance to sugar maple |
-0.02285325 |
91 |
Distance to well-drained soils |
0.06787511 |
65.4 |
Relative elevation |
0.06238967 |
65.6 |
Size of minor watershed |
0.0003478740 |
100 |
Vegetation diversity within 1 km |
0.6312794 |
100 |
Vertical distance to permanent water |
-0.02224699 |
100 |
The model predicts 84.58 percent of all surveyed places in high/medium survey potential areas, which make up 14.9 percent of the landscape (Table 8.17.7). The area designated high and medium survey potential is the smallest for the state and produces the strongest gain statistic (0.82384) of all survey probability models (Table 8.6.14). This model was able to predict surveyed places with a slightly lower precision than the site probability model was able to predict sites, indicating that sites are most likely to be found in places that have been surveyed, which is hardly an acceptable prediction.
Clearly, the region has not been randomly surveyed. The number of sites (172) and negative survey points (574) (Table 8.17.7) in the Laurentian Highlands are low, but the subsection is small. Survey frequencies here are the highest in the state, while site frequencies are about twice the statewide average (Table 8.6.14). Unfortunately, the survey effort has provided very biased information about the subsection.
Region (30 meter cells) |
All random points |
All negative survey points |
All sites |
All sites and negative survey points |
||||||
# |
% |
# |
% |
# |
% |
# |
% |
% |
||
Low |
1783015 |
84.45 |
328 |
82.83 |
92 |
16.03 |
13 |
7.56 |
105 |
14.08 |
Medium |
104845 |
4.97 |
21 |
5.30 |
36 |
6.27 |
7 |
4.07 |
43 |
5.76 |
High |
209662 |
9.93 |
44 |
11.11 |
438 |
76.31 |
150 |
87.21 |
588 |
78.82 |
Water |
13744 |
0.65 |
3 |
0.76 |
8 |
1.39 |
2 |
1.16 |
10 |
1.34 |
Steep Slopes |
33 |
0.002 |
0 |
0 |
0 |
0 |
0 |
0 |
0 |
0 |
Mines |
0 |
0 |
0 |
0 |
0 |
0 |
0 |
0 |
0 |
0 |
Total |
2111299 |
100 |
396 |
100 |
574 |
100 |
172 |
100 |
746 |
100 |
The database included 746 surveyed places (including ten located in "water"). Two preliminary survey probability models had 84 percent agreement in the subsection. The Kappa statistics for these models was 0.40028 (Table 8.6.14), which is lower than average for the state. The conditional Kappa statistics (Table 8.17.8) are lowest for the medium site potential zone. It is assumed that a more random distribution of future surveys will help improve the model.
Table 8.17.8. Conditional Kappa Values for Survey Probability Model, Laurentian Highlands Subsection.
Class |
Ki |
Proportion Correct |
Low |
0.3508 |
0.8702 |
Medium |
0.2253 |
0.3027 |
High |
0.7733 |
0.7959 |
8.17.3.3 Interpretation
The survey probability model is composed of 12 variables, two relating to topographic features, four to hydrology, five to vegetation, and one to soils (Table 8.17.4). There are four variables with correlation coefficients above 0.3 and two with values greater than 0.6. Negative surveys points have mean variable values more similar to those for sites than for random points on eight variables.
The strongest correlations are with distances from nearest large wetland (878 vs. 201 meters, Figure 8.17.10b)and nearest swamp (302 vs. 58 meters, Figure 8.17.10a). As mentioned in Section 8.17.2.3.1, high values of these variables are associated with large reservoir lakes and may not reflect prehistoric landscapes. Like sites, negative survey points also tend to be in larger minor watersheds (8,278 vs. 6651 acres, Figure 8.17.9c) and areas of higher vegetation diversity (3.2 vs. 2.5, Figure 8.17.12a).
Negative survey points and sites are also much closer in vertical distance to permanent water (Figures 8.17.6.b and 8.17.10d). Likewise, both are closer to hardwoods (Figure 8.17.11b), river bottom forest (Figure 8.17.911c),and sugar maple (Figures 8.17.5.a and 8.17.11d) than random points.
Values for relative elevation (Figures 8.17.6.a and 8.17.9b) are higher for negative survey points than for modeled sites or random points. They are intermediate to sites and random points for distance to nearest lake, wetland, organic soil, or stream (Figure 8.17.10c) and distance to well-drained soils (Figure 8.17.12c ). Negative survey points are similar to random points only in their proximity to conifers (Figure 8.17.11a).
8.17.4 Survey Implementation Model
The survey implementation model for the Laurentian Highlands subsection classifies 81.11 percent of the landscape as unknown (Figure 8.17.8). This is by far the highest value in the state, reflecting the strong survey bias apparent in this subsection. Only three test sites (12 percent) are from the unknown area, which may indicate a perpetuation of survey bias in this region.
The low and possibly low site potential zones occupy only 8.3 percent of the subsection. As expected, the largest areas of medium to high site potential are found around the large reservoir lakes. To reduce the unknown area and obtain a better model of site potential will require many more surveys distributed throughout the subsection.
Table 8.17.9. Evaluation of Survey Implementation Model, Laurentian Highlands Subsection.
Region (30 meter cells) |
Random Points |
Negative Survey Points |
Single Artifacts |
Sites |
||||||
# |
% |
# |
% |
# |
% |
# |
% |
# |
% |
|
Unknown |
1712553 |
81.11 |
316 |
79.8 |
69 |
12.02 |
1 |
1.92 |
4 |
3.33 |
Possibly Low |
82745 |
3.92 |
19 |
4.8 |
13 |
2.26 |
1 |
1.92 |
0 |
0 |
Low |
92499 |
4.38 |
25 |
6.31 |
26 |
4.53 |
0 |
0 |
0 |
0 |
Suspected Medium |
57871 |
2.74 |
10 |
2.53 |
16 |
2.79 |
1 |
1.92 |
3 |
2.5 |
Possibly Medium |
14079 |
0.67 |
2 |
0.51 |
12 |
2.09 |
2 |
3.85 |
1 |
0.83 |
Medium |
32907 |
1.56 |
5 |
1.26 |
56 |
9.76 |
5 |
9.62 |
11 |
9.17 |
Suspected High |
12591 |
0.6 |
2 |
0.51 |
7 |
1.22 |
1 |
1.92 |
3 |
2.5 |
Possibly High |
8021 |
0.38 |
0 |
0 |
11 |
1.92 |
2 |
3.85 |
1 |
0.83 |
High |
84256 |
3.99 |
14 |
3.54 |
356 |
62.02 |
39 |
75 |
95 |
79.17 |
Water |
13744 |
0.65 |
3 |
0.76 |
8 |
1.39 |
0 |
0 |
2 |
1.67 |
Steep Slopes |
33 |
0.002 |
0 |
0 |
0 |
0 |
0 |
0 |
0 |
0 |
Mines |
0 |
0 |
0 |
0 |
0 |
0 |
0 |
0 |
0 |
0 |
Total |
2111299 |
100 |
396 |
100 |
574 |
100 |
52 |
100 |
120 |
100 |
No landscape suitability models have been developed within the Laurentian Highlands subsection.
8.18 Littlefork-Vermilion Uplands
8.19 Mille Lacs Uplands
8.20 Minnesota River Prairie
8.21 Oak Savanna
8.22 Pine Moraines & Outwash Plains
8.23 Red River Prairie
8.24 Rochester Plateau
8.25 St. Croix Moraines and Outwash Plains (Twin Cities Highlands)
8.26 St. Louis Moraines/ Tamarack Lowlands
8.27 Conclusion
References
The Mn/Model Final Report (Phases 1-3) is available on CD-ROM. Copies may be requested by visiting the contact page.

Acknowledgements
MnModel was financed with Transportation Enhancement and State Planning and Research funds from the Federal Highway Administration and a Minnesota Department of Transportation match.
Copyright Notice
The MnModel process and the predictive models it produced are copyrighted by the Minnesota Department of Transportation (MnDOT), 2000. They may not be used without MnDOT's consent.