Quick Links
Chapters
- Management Summary
- Research Design & Time Line
- Environment & Native American Culture
- GIS Design
- Archaeological Database
- Archaeological & Environmental Variables
- Model Development & Evaluation
- Model Results & Interpretation
- Project Applications
- Model Enhancements
- Model Implementation
- Landscape Suitability Models
- Summary & Recommendations
Appendices
- Archaeological Predictive Modeling: An Overview
- GIS Standards & Procedures
- Archaeology Field Survey Standards, Procedures & Rationale
- Archaeology Field Survey Results
- Geomorphology Survey Profiles, Sections, & Lists
- Building a Macrophysical Climate Model for the State of Minnesota
- Correspondence of Support for Mn/Model
- Glossary
- List of Figures
- List of Tables
- Acknowledgments
8.23 RED RIVER PRAIRIE SUBSECTION OF RED RIVER VALLEY SECTION
8.23.1 Environmental Context
8.23.2 Site Probability Model
8.23.3 Survey
Probability Model
8.23.4 Survey Implementation Model
8.23.5 Other Models
This regional model report is organized as described in Sections 8.2.1 through 8.4.1. Refer to these sections of the report for explanations of the tables, variables, and statistics.
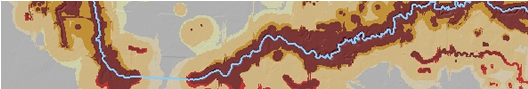
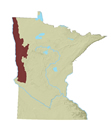
Red River Prairie is a subsection of the North Central Glaciated Plains Section of the Prairie Parkland Province (Figure 8.1) (Minnesota DNR 1998). The subsection consists primarily of a level glacial lake plain, draining to the north by the Red River and its tributaries (Figure 8.23.1.a). Minor landforms include a till plain, beach ridges, sand dunes, and water reworked till.
Glacial Lake Agassiz largely shaped the landscape of Red River Prairie. The subsection's eastern boundary follows several geomorphic discontinuities that also coincide with the boundary between prairie and aspen parklands, oak woodlands, or brush prairie (Minnesota DNR 1998). From Clay County north, glacial lake sediments, along with some lake-modified till from the Erskine Moraine, dominate the subsection (Figure 8.23.2.a). From Polk County north, the eastern boundary roughly follows the lowest beach of Glacial Lake Agassiz. From southern Polk County south through Otter Tail County, the boundary is based on the interface between the moraine deposits and Glacial Lake Agassiz deposits or ice contact sediments. Mahnomen, Becker, and northeastern Clay Counties are dominated by ground moraine. The Fergus Falls Till Plain is included in Red River Prairie.
In the southern portion of the region, Wilkin, Traverse, and the western edges of Otter Tail, Grant, and Stevens Counties are dominated by lake modified till on the Agassiz Lake Plain. Stagnation moraine and a small amount of ground moraine are found along the eastern edge of the subsection in Otter Tail, Grant, and Stevens Counties. The Graceville Till Plain and Big Stone Moraine are to the south and east of this subsection, in the Minnesota River Prairie.
Glacial lake sediments and lake modified till tend to hold poorly drained soils, while the terraces and moraines are well-drained (Figure 8.23.2.b ). The exception is in the drainages of the Red Lake River and Grand Marais Creek, where well-drained soils predominate.
Vegetation cover in the 19th century (Figure 8.23.1.b) was primarily prairie, with extensive areas of wet prairie as well. Narrow bands of river bottom forest were found along the Red River and its major tributaries. Other wooded land, aspen-oak woodland, some brush prairie, and an extensive area of river bottom forest were found only in eastern Norman County. These were located on the eastern sides of tributaries of the Wild Rice River. The streams apparently provided sufficient protection from eastward moving prairie fires to reduce fire frequencies in this area, permitting woody vegetation to become established.
The areas of medium and high site potential in this region closely follow the Red River and its tributaries (Figure 8.23.3). There are high to medium site potentials along the major and some minor tributaries of the Red River. From north to south, these include Two Rivers, Tamarac River, Middle River, Snake River, Grand Marais Creek, Red Lake River, Marsh River, Wild Rice River, Buffalo River, Otter Tail River, Rabbit River, and Mustinka River. Most medium and high site potential areas closely follow the channels of these streams with three exceptions. There is an area of small upland lakes in northeastern Clay County that is characterized by a zone of medium site potential. As the Otter Tail River flows through southwestern Otter Tail County, it enters an area of scattered lakes that extends southward into Grant and northern Stevens Counties. It is in this zone of lakes, marking the transition from the Glacial Lake Agassiz plain into the uplands, that the high and medium site potential areas expand. The third area where the medium and high site potentials deviate from the stream channels is in west central Traverse County between the Mustinka and Bois de Sioux Rivers. This area is characterized by a series of rolling gravel hills marking Glacial Lake Agassiz beach ridge deposits.
There is a noticeable discrepancy in the level of model detail along the western edges of the Lake Olaf, Elizabeth, Carlisle, Dayton Hollow Dam, and Wendell quad sheets. There is also a conspicuous north-south straight line running along the western edges of the Ulen, Hawley, Hawley SE, and Big Slough quad sheets. These are artifacts of the digital elevation data and should not be considered predictive features. Large portions of this subsection do not yet have 1:24,000 digital elevation data available. In these places, 1:250,000 data were used. The discrepancies in the model are artifacts of either boundaries between 1:250,000 scale and 1:24,000 scale quads or between adjacent 1:24,000 scale quads that were apparently digitized using different methods. The greatest articulation of relief in the subsection is in the quads that cover Otter Tail and northern Grant Counties (Figures 8.23.4a and b and 8.23.6). These areas are covered by level 1 DEMs. Level 1 DEMs in other parts of the subsection and Level 2 DEMs have somewhat less relief articulated. MGC100 elevation data, at 1:250,000 scale, have the least relief detail. These differences are reflected in the articulation of the model.
8.23.2.2 Evaluation
The site probability model performed extremely well. It is based on 15 variables (Table 8.23.1) representing topography, vegetation, soils and hydrology.
Table 8.23.1. Site Probability Model, Red River Prairie Subsection.
Intercept |
5.619 |
|
ln(nonsites/sites) |
2.668770227 |
|
Variable |
Regression Coefficient |
Probability |
Distance to aspen-birch |
-0.011073853 |
100.0 |
Distance to brushlands |
0.009819549 |
65.3 |
Distance to edge of nearest area of organic soils |
0.01200435 |
100.0 |
Distance to edge of nearest large wetland |
-0.01459344 |
100.0 |
Distance to edge of nearest perennial river or stream |
-0.02289065 |
100.0 |
Distance to nearest lake inlet/outlet |
-0.01248326 |
100.0 |
Distance to nearest lake, wetland, organic soils, or stream |
-0.06452882 |
100.0 |
Distance to nearest major ridge or divide |
-0.01155328 |
100.0 |
Distance to oak woodland |
-0.02549987 |
100.0 |
Distance to sugar maple |
0.02918333 |
100.0 |
Distance to well drained soils |
0.01182678 |
100.0 |
Elevation |
-0.05182107 |
100.0 |
On alluvium |
1.120053 |
100.0 |
Slope |
-1.0184171 |
94.7 |
Surface roughness |
0.3129549 |
94.7 |
In this model, 84.82 percent of all known sites are in high/medium site potential areas, which make up only 29.90 (Table 8.23.2) percent of landscape. This produces a good gain statistic of 0.64741 (Table 8.6.11). The model tests very well, predicting 87.93 percent of test sites and producing a gain statistic of 0.71409.
Table 8.23.2. Evaluation of Site Probability Model, Red River Prairie Subsection.
Region (30 meter cells) |
Random Points |
Negative Survey Points |
Modeled Sites |
Test Sites |
||||||
# |
% |
# |
% |
# |
% |
# |
% |
# |
% |
|
Low |
14291570 |
69.94 |
2746 |
70.52 |
317 |
41.99 |
41 |
15.19 |
7 |
12.07 |
Medium |
4072212 |
19.93 |
782 |
20.08 |
174 |
23.05 |
45 |
16.67 |
11 |
18.97 |
High |
2038117 |
9.97 |
362 |
9.30 |
264 |
34.97 |
184 |
68.15 |
40 |
68.97 |
Water |
30193 |
0.15 |
4 |
0.10 |
0 |
0 |
0 |
0 |
0 |
0 |
Steep Slopes |
730 |
0.004 |
0 |
0 |
0 |
0 |
0 |
0 |
0 |
0 |
Mines |
0 |
0 |
0 |
0 |
0 |
0 |
0 |
0 |
0 |
0 |
Total |
20432822 |
100 |
3894 |
100 |
755 |
100 |
270 |
100 |
58 |
100 |
The database included 270 sites that were not single artifacts. This is slightly below the average number of sites for the Phase 3 regions (Table 8.6.11). Two preliminary models using different halves of the known sites had only 75 percent agreement (75 percent of the cells in the subsection were classified the same in both models). The Kappa statistic, which is adjusted for the amount of agreement expected by chance alone, for this model was only 0.47199 (Table 8.6.11). The conditional Kappa statistics (Table 8.23.3) are lowest for the medium potential zone. This indicates that the greatest instability in the model is in assignment of cells to this zone. Doubling the number of sites for modeling may improve confidence in the model and model stability.
Table 8.23.3. Conditional Kappa Values for Site Probability Model, Red River Prairie Subsection.
Class |
Ki |
Proportion Correct |
Low |
0.4666 |
0.8133 |
Medium |
0.3062 |
0.4449 |
High |
0.7229 |
0.7645 |
8.23.2.3 Interpretation
The fifteen variables involved in the Red River Prairie site model are nearly evenly divided between topographic, hydrologic, vegetation, and soils characteristics (Table 8.23.1). The relatively low number of hydrologic variables in this model compared to other subsections is related to the small number of lakes in the region. The Red River and its westward-flowing tributaries dominate the surface hydrology of the Red River Prairie.
8.23.2.3.1 Differences between Modeled Sites and Random Points for Individual Model Variables
Eight of the site model variables have moderate to high correlation coefficients; four of these have coefficients of 0.5 or greater (Table 8.23.4). Compared to random points, sites average about 2590 meters closer to the nearest major ridge or divide (Figure 8.23.9a), are about 2450 meters nearer perennial rivers or streams (Figure 8.23.11a), are much closer to lakes, wetlands, organic soils, or streams (Figure 8.23.11c), are closer to lake inlet/outlets (Figure 8.23.11b), and are lower in elevation (Figure 8.23.9b). Sites are on less level slopes (Figure 8.23.10b) than would be expected by chance.
By contrast, the average site tends to be farther from the nearest large wetland (Figure 8.23.10d), brushlands (Figure 8.23.12b), organic soils (Figure 8.23.13b), and well-drained soils (Figure 8.23.13d) than random points or nonsites. Sites tend to more often be on alluvium than random points (Figure 8.23.14a). They are farther from aspen-birch (Figure 8.23.12a) and sugar maple (Figure 8.23.13a,) than would be expected by chance.
Compared to other subsections, the Red River Prairie has a relatively large number of variables with moderate to high correlation coefficients (8 out of 15). This suggests that there is a strong pattern of site location in the subsection defined by a series of highly interrelated variables. The results of the Mann-Whitney U test indicate that all variables except two, surface roughness (Figures 8.23.5.a and 8.23.10c) and distance to oak woodland (Figure 8.23.12c) are significant at the 0.05 level (Table 8.23.4). This means that the variable values of modeled sites compared to those of random points can be considered to have been drawn from two populations. In other words, this model is successful at isolating variables that discriminate between areas containing sites on the one hand versus the general environmental background on the other.
Table 8.23.4. Model Variable Statistics.
Red River Prairie |
Modeled Sites |
Surveyed Areas |
Modeled Sites |
Sites in Low Prob. |
Neg. Survey Points |
Random Points |
||||||
Model Variable |
Coeff. |
Sign. |
Coeff. |
Sign. |
Mean |
S.D. |
Mean |
S.D. |
Mean |
S.D. |
Mean |
S.D. |
Distance to nearest major ridge or divide |
-0.613 |
0 |
- |
- |
41.77 |
32.98 |
72.3 |
30.13 |
57.75 |
30.89 |
65.88 |
30.51 |
Elevation |
-0.356 |
0 |
- |
- |
949.73 |
131.75 |
1072.71 |
147.08 |
963.47 |
148.95 |
987.62 |
149.65 |
Height above surroundings |
- |
- |
0.235 |
0 |
5.7 |
9.72 |
3.05 |
7.28 |
2.98 |
5.83 |
2.18 |
5.19 |
Relative elevation |
- |
- |
0.288 |
0 |
8.09 |
11.69 |
4.02 |
7.18 |
4.1 |
7.06 |
3.23 |
6.46 |
Size of major watershed |
- |
- |
-0.132 |
0 |
1083.28 |
150.29 |
1061.29 |
194.36 |
1069.15 |
203.5 |
1096.9 |
172.89 |
Slope |
0.166 |
0 |
- |
- |
1.03 |
1.6 |
0.56 |
1.05 |
0.57 |
1.21 |
0.44 |
1.11 |
Surface roughness |
-0.293 |
0.161 |
-0.129 |
0 |
150.3 |
23.79 |
166.39 |
25.09 |
149.8 |
25.67 |
152.81 |
25.32 |
Distance to edge of nearest large wetland |
0.642 |
0 |
- |
- |
110.58 |
53.37 |
61.58 |
32.72 |
101.44 |
44.51 |
93.28 |
46.19 |
Distance to edge of nearest perennial river or stream |
-0.542 |
0 |
-0.524 |
0 |
30.37 |
30.34 |
58.52 |
32.53 |
40.31 |
30.01 |
58.09 |
28.26 |
Distance to nearest lake inlet/outlet |
-0.116 |
0 |
-0.217 |
0 |
62.86 |
30.43 |
65.76 |
26.85 |
69.42 |
30.45 |
77.59 |
29.35 |
Distance to nearest lake, wetland, organic soil, or stream |
-0.345 |
0 |
-0.478 |
0 |
9.67 |
6.61 |
16.2 |
9.23 |
13.11 |
9.95 |
17.35 |
10.97 |
Distance to nearest permanent lake inlet/outlet |
- |
- |
0.221 |
0.017 |
113.75 |
44.49 |
97.6 |
33.86 |
111.7 |
44.32 |
107.5 |
34.59 |
Distance to aspen-birch |
0.051 |
0 |
0.281 |
0 |
247.84 |
73.24 |
228.32 |
93 |
262.78 |
75.19 |
228.24 |
72.82 |
Distance to brushlands |
0.478 |
0 |
- |
- |
147.91 |
54.13 |
114.8 |
49.65 |
124.11 |
53.66 |
127.53 |
49.62 |
Distance to oak woodland |
0.264 |
0.159 |
- |
- |
178.79 |
82.4 |
132.55 |
68.3 |
200.49 |
103.94 |
177.25 |
82.27 |
Distance to prairie |
- |
- |
0.101 |
0.08 |
11.12 |
16.66 |
6.24 |
15.24 |
5.93 |
12.7 |
7.26 |
15.34 |
Distance to sugar maple |
0.162 |
0 |
- |
- |
230.51 |
66.87 |
185.04 |
67.56 |
251.15 |
85.6 |
215.24 |
74.94 |
Distance to edge of nearest area of organic soils |
0.421 |
0 |
- |
- |
165.99 |
39.89 |
122.31 |
40.7 |
145.31 |
51.81 |
138.29 |
45.95 |
Distance to glacial lake sediment |
- |
- |
0.208 |
0 |
27.5 |
37.55 |
42.96 |
59.53 |
25.77 |
47.8 |
21.04 |
42.41 |
Distance to well-drained soils |
0.208 |
0 |
0.123 |
0.039 |
44.03 |
43.81 |
17.42 |
28.77 |
28.02 |
33.77 |
29.48 |
34.45 |
On alluvium |
0.686 |
0 |
0.401 |
0 |
0.34 |
0.47 |
0 |
0 |
0.08 |
0.27 |
0.03 |
0.17 |
On river terraces |
- |
- |
0.305 |
0 |
0.07 |
0.26 |
0 |
0 |
0.06 |
0.24 |
0.01 |
0.09 |
Frequency counts |
270 |
1051 |
270 |
41 |
755 |
3894 |
||||||
See Interpretation section for discussion of the statistics:
Coeff. = correlation coefficient
Sign. = significance of the Mann-Whitney U test
S.D. = standard deviation
Distances and areas are expressed in square roots of meters. Square the values in the table to get actual values.
8.23.2.3.2 Relationships between Variable Pairs
There are 24 variable pairs in this subsection with correlation coefficients greater than 0.5 (Table 8.23.5). Variables correlated with elevation reflect differences between the low level lake plain to the west and the higher terraces and moraines to the east. The higher elevations are strongly correlated with greater surface roughness (0.95, Figure 8.23.5a). Because of this strong correlation, both elevation and surface roughness are associated with proximity to oak woodlands, large wetlands, well-drained soils, brushlands, and sugar maple (Figure 8.23.5b). Another topographic variable, distance to nearest major ridge or divide, is negatively associated with distance to nearest large wetland (-0.61), distance to brushlands (-0.63), distance to well-drained soils (-0.5), and on alluvium (-0.61). The negative relationships indicate that these features are more likely to be found in valleys than near major ridges or divides. All other moderately to highly correlated variable pairs involve combinations of the variables already mentioned, implying that topographic distinctions underlie much of the hydrologic and vegetation patterns in this subsection.
Table 8.23.5. Variable Correlation Matrix.
Red River Prairie |
Distance to nearest major ridge or divide |
Elevation |
Slope |
Surface roughness |
Distance to edge of nearest large wetland |
Distance to edge of nearest perennial river or stream |
Distance to nearest lake inlet/outlet |
Distance to nearest lake, wetland, organic soil, or stream |
Distance to nearest major ridge or divide |
1 |
|
|
|||||
Elevation |
0.42 |
1 |
|
|
|
|
|
|
Slope |
0.09 |
0.1 |
1 |
|
|
|
|
|
Surface roughness |
0.4 |
0.95 |
0.36 |
1 |
|
|
|
|
Distance to edge of nearest large wetland |
-0.61 |
-0.72 |
-0.11 |
-0.72 |
1 |
|
|
|
Distance to edge of nearest perennial river or stream |
0.31 |
0.34 |
0.17 |
0.38 |
-0.46 |
1 |
|
|
Distance to nearest lake inlet/outlet |
-0.05 |
-0.31 |
0.1 |
-0.24 |
0.18 |
0.18 |
1 |
|
Distance to nearest lake, wetland, organic soil, or stream |
0.05 |
0.01 |
0.04 |
0.03 |
-0.05 |
0.43 |
0.19 |
1 |
Distance to aspen-birch |
-0.18 |
0.17 |
0.08 |
0.22 |
-0.1 |
0.36 |
0.19 |
0.04 |
Distance to brushlands |
-0.63 |
-0.69 |
-0.22 |
-0.71 |
0.79 |
-0.36 |
0.14 |
-0.04 |
Distance to oak woodland |
-0.4 |
-0.92 |
-0.15 |
-0.9 |
0.68 |
-0.32 |
0.26 |
-0.03 |
Distance to sugar maple |
-0.24 |
-0.58 |
-0.06 |
-0.55 |
0.37 |
0.08 |
0.41 |
-0.03 |
Distance to edge of nearest area of organic soils |
-0.43 |
-0.36 |
0.02 |
-0.33 |
0.56 |
-0.04 |
0.37 |
-0.01 |
Distance to well-drained soils |
-0.5 |
-0.65 |
-0.13 |
-0.64 |
0.57 |
-0.26 |
0.2 |
-0.02 |
On alluvium |
-0.61 |
-0.36 |
-0.05 |
-0.34 |
0.56 |
-0.39 |
-0.14 |
-0.08 |
Distance to aspen-birch |
Distance to brushlands |
Distance to oak woodland |
Distance to sugar maple |
Distance to edge of nearest area of organic soils |
Distance to well-drained soils |
On alluvium |
||
Distance to nearest major ridge or divide |
|
|
|
|
|
|
|
|
Elevation |
|
|
|
|
|
|
|
|
Slope |
|
|
|
|
|
|
|
|
Surface roughness |
|
|
|
|
|
|
|
|
Distance to edge of nearest large wetland |
|
|
|
|
|
|
|
|
Distance to edge of nearest perennial river or stream |
|
|
|
|
|
|
|
|
Distance to nearest lake inlet/outlet |
|
|
|
|
|
|
|
|
Distance to nearest lake, wetland, organic soil, or stream |
|
|
|
|
|
|
|
|
Distance to aspen-birch |
1 |
|
|
|
|
|
|
|
Distance to brushlands |
-0.1 |
1 |
|
|
|
|
|
|
Distance to oak woodland |
-0.13 |
0.75 |
1 |
|
|
|
|
|
Distance to sugar maple |
0.47 |
0.34 |
0.64 |
1 |
|
|
|
|
Distance to edge of nearest area of organic soils |
0.37 |
0.46 |
0.31 |
0.47 |
1 |
|
|
|
Distance to well-drained soils |
0.05 |
0.65 |
0.71 |
0.43 |
0.39 |
1 |
|
|
On alluvium |
-0.06 |
0.62 |
0.34 |
-0.02 |
0.22 |
0.33 |
1 |
Refer to "Relationships between variable pairs" for interpretation of the table values.
8.23.2.3.3 Sites in Low Probability Areas
An examination of the average variable values of sites in the low probability areas indicates that they are usually in environments quite different from the majority of modeled sites (Table 8.23.4). However, they are also distinct from random points. Compared to modeled sites and random points, sites in low probability areas are farther from glacial lake sediment and at higher elevations with higher surface roughness values. Thus, they are less likely to be on alluvium or river terraces. This places them in smaller major watersheds where they are closer to both organic and well-drained soils. They are also closer to brushlands, prairie, and sugar maple.
Of the 41 sites in low probability areas, three are mortuary/cemetery sites, nine are mounds or earthworks, 11 are artifact scatters, and 18 are lithic scatters. If all site types were predicted equally well by the model, 15.19 percent of each site type should be in the low probability areas. However, none of these site types meets this expectation. Artifact scatters are underrepresented in low probability areas (7.9 percent), indicating that the model predicts these sites fairly well. However, the model is less successful predicting mounds/earthworks (25 percent in low probability areas) and lithic scatters (20.7 percent in low probability). Fully 75% of all mortuary/cemetery sites are in low probability areas, but since there are only four such sites known in the subsection this may not be significant.
8.23.2.3.4 Relationships between Cultural Context, Descriptive, or Settlement Variables and Site Potential
There are enough sites in this subsection to permit an analysis of various site attributes by site potential. A summary of these bivariate relationships appears in Table 8.23.6. Two of the four are significant at the 0.05 level as measured by the chi-square test. Sites containing an Archaic component, compared to those without, are more likely (38.5 percent vs. 7.5 percent) to be situated in low potential areas. This relationship should be considered tentative, since there are only 13 sites containing an Archaic component. A similar, but less pronounced, pattern is present among sites lacking pottery (e.g. lithic scatters) compared to those containing ceramics. Aceramic sites are much more likely to be in low site potential areas (24.0 percent) compared to those with pottery (7.6 percent). Conversely, sites containing pottery are more likely to be in high site potential areas compared to non-ceramic bearing sites (77.9 percent vs. 56.8 percent). These relationships are fairly easily interpreted. A correlation between higher elevations and sites in low probability areas has already been noted. In the Archaic period, much of the glacial lake plain would have been occupied by Lake Agassiz, limiting the area in this subsection available for settlement.
Table 8.23.6. Summary of Bivariate Relationships between Four Dichotomous Archaeological Variables and Three Areas of Site Potential, Red River Prairie (Site Probability Model).
Low Potential |
Medium Potential |
High Potential |
Total |
Chi-square Test |
|||||||
Dichotomous Variable |
N |
% |
N |
% |
N |
% |
N |
% |
value |
df |
p-value |
All Sites |
41 |
15.2 |
45 |
16.7 |
184 |
68.1 |
270 |
100.0 |
- |
- |
- |
Archaic |
5 |
38.5 |
3 |
23.1 |
5 |
38.5 |
13 |
100.0 |
14.4 |
2 |
0.00 |
Not Archaic |
11 |
7.5 |
21 |
14.4 |
114 |
78.1 |
146 |
100.0 |
|||
Aceramic |
30 |
24.0 |
24 |
19.2 |
71 |
56.8 |
125 |
100.0 |
17.2 |
2 |
0.00 |
Not Aceramic |
11 |
7.6 |
21 |
14.5 |
113 |
77.9 |
145 |
100.0 |
|||
Single Component |
15 |
10.3 |
22 |
15.2 |
108 |
74.5 |
145 |
100.0 |
0.17 |
2 |
0.92 |
Not Single Component |
1 |
7.1 |
2 |
14.3 |
11 |
78.6 |
14 |
100.0 |
|||
Mounds |
3 |
20.0 |
4 |
26.7 |
8 |
53.3 |
15 |
100.0 |
1.71 |
2 |
0.43 |
Not Mounds |
38 |
14.9 |
41 |
16.1 |
176 |
69.0 |
255 |
100.0 |
|||
8.23.3 Survey Probability Model
8.23.3.1 Description
The survey probability model (Figure 8.23.7) reveal a strong bias towards surveying near water features . There is a persistent pattern of high and medium survey potential zones following the Red River and its major tributaries. The majority of high and medium site potential zones (Section 8.23.2.1) are classified as higher survey potential as well. However, high and medium survey potential zones extend farther from streams in this model, compared to zones of site potential.
At the northern extreme of the subsection, the large contiguous area of high and medium survey potential is attributable to a linear pipeline survey. In the southern part of the subsection, linear surveys along State Highway 75 in Traverse County and along the State Highway 59 south of Morris in Stevens County, expand the extent of high survey potential zones away from water. However, other linear surveys did not contribute to high model values. For example, in Wilkin County a 10-km survey track along the State Highway 75 crosses a low survey potential area south of the Otter Tail River.
This model displays the same artifacts caused by elevation data observed in the site probability model (Section 8.23.2.1). In headwaters of the Todd River, in Otter Tail County, the differences in scale of the elevation data give an impression that height above surroundings determines survey potential. The same area displays traces of a banded DEM in the survey potential zone configuration. Further downstream along the Todd River, a rectangular border appears around a medium potential zone, an artifact of a low-resolution grid on alluvium. These straight-line features or thresholds should not be used as survey potential predictors.
8.23.3.2 Evaluation
The survey probability model predicted surveyed places better than by chance alone, suggesting that surveys are not located randomly within the subsection. The model is based on 14 variables (Table 8.23.7), representing topography, vegetation, soils and hydrology.
Table 8.23.7. Survey Probability Model, Red River Prairie Subsection.
Intercept |
4.734 |
|
Ln(nonsites/sites) |
0.58842078 |
|
Variable |
Regression Coefficient |
Probability |
Distance to aspen-birch |
0.007785225 |
100.0 |
Distance to edge of nearest perennial river or stream |
-0.02343110 |
100.0 |
Distance to glacial lake sediment |
0.009215752 |
100.0 |
Distance to nearest lake inlet/outlet |
-0.007510057 |
100.0 |
Distance to nearest lake, wetland, organic soils, or stream |
-0.03796946 |
100.0 |
Distance to nearest permanent lake inlet/outlet |
0.006266461 |
100.0 |
Distance to prairie |
-0.01190299 |
100.0 |
Distance to well-drained soils |
-0.005636454 |
100.0 |
Height above surroundings |
0.03783237 |
90.0 |
On alluvium |
0.6276675 |
100.0 |
On river terraces |
1.193525 |
100.0 |
Relative elevation |
0.03608134 |
76.8 |
Size of major watershed |
-0.001202343 |
100.0 |
Surface roughness |
-0.03565409 |
100.0 |
The model predicts 84.87 percent of all sites in high/medium survey potential areas, which make up 44.94 percent of the landscape (Table 8.23.8). This produces a weak gain statistic of 0.47048, which is acceptable for a survey probability model (Table 8.6.14).
This model was able to predict surveyed places with much less precision than the site probability model was able to predict sites, indicating that sites are confined to only a portion of the total area surveyed. However, the models predicted surveyed places better than by chance, indicating that the region has not been randomly surveyed. The low numbers of both sites (296) and negative survey points (755) in the large area of this region bear this out. This indicates a frequency of only 0.06 surveys per square km, with a frequency of only 0.02 known sites per square km. Both frequency values are much lower than the statewide averages.
Table 8.23.8. Evaluation of Survey Probability Model, Red River Prairie Subsection.
Region (30 meter cells) |
All random points |
All negative survey points |
All sites |
All sites and negative survey points |
||||||
# |
% |
# |
% |
# |
% |
# |
% |
% |
||
Low |
11221146 |
54.92 |
2188 |
56.19 |
128 |
16.95 |
31 |
10.47 |
159 |
15.13 |
Medium |
5101231 |
24.97 |
969 |
24.88 |
173 |
22.91 |
49 |
16.55 |
222 |
21.12 |
High |
4079522 |
19.97 |
733 |
18.82 |
454 |
60.13 |
216 |
72.90 |
670 |
63.75 |
Water |
30193 |
0.15 |
4 |
0.10 |
0 |
0 |
0 |
0 |
0 |
0 |
Steep Slopes |
730 |
0.004 |
0 |
0 |
0 |
0 |
0 |
0 |
0 |
0 |
Mines |
0 |
0 |
0 |
0 |
0 |
0 |
0 |
0 |
0 |
0 |
Total |
20432822 |
100 |
3894 |
100 |
755 |
100 |
296 |
100 |
1051 |
100 |
The database included 1051 surveyed places, which is below average for Phase 3 regions (Table 8.23.8). Two preliminary survey probability models had only 73 percent agreement. The Kappa statistic for these models was 0.53891 which is slightly lower than average (Table 8.6.14). The conditional Kappa statistics (Table 8.23.9) are lowest for the medium survey potential zone. It is assumed that increasing the number of surveyed places for modeling may improve model stability, as will distributing more surveys throughout the undersurveyed areas.
Table 8.23.9. Conditional Kappa Values for Survey Probability Model, Red River Prairie Subsection.
Class |
Ki |
Proportion Correct |
Low |
0.6534 |
0.8441 |
Medium |
0.2281 |
0.3825 |
High |
0.6529 |
0.7397 |
8.23.3.3 Interpretation
The survey probability model for the Red River Prairie is composed of 14 variables, 7 of which are also included in the site probability model. The correlation coefficients of the survey model are lower in value compared to the site model; there are only four variables with coefficients above 0.3 and none above 0.6 (Table 8.23.4). Surveys have been conducted nearer perennial rivers or streams (1625 vs. 3374 meters, Figure 8.23.11a) and lakes, wetlands, organic soils, or streams (172 vs. 301 meters, Figure 8.23.11c) compared to random points. Surveys are more likely to be situated on alluvium (Figure 8.23.14a) and on river terraces (Figure 8.23.14b) compared to random points.
Negative survey points are most like modeled sites in being somewhat farther from glacial lake sediment (Figure 8.23.13c), farther from permanent lake inlet/outlets (Figure 8.23.11d), and on smoother terrain (Figure 8.23.10c) than random points. They are strikingly similar to sites in low probability areas with respect to height above surroundings (Figure 8.23.9c), relative elevation (Figure 8.23.9d), size of major watershed (Figure 8.23.10a), and distance to prairie (Figure 8.23.12d).
These results indicate that the surveys in this subsection were conducted in a non-random fashion according to a series of environmental characteristics. The Mann-Whitney U tests indicate that all variables in this model are significant at the 0.05 level (Table 8.23.4).
8.23.4 Survey Implementation Model
The survey implementation model for the Red River Prairie indicates that 51.13 percent of the subsection is classified as unknown because of inadequate survey (Table 8.23.10 and Figure 8.23.8). These areas are located away primarily away from the Red River and its major tributaries. Only two (3.45 percent) of the test sites are from the unknown area.
Low and possibly low site potential zones occupy only 18.82 percent of the subsection. More surveys are needed away from water in this subsection to improve model performance and reduce the extent of the unknown area.
Table 8.23.10. Evaluation of Survey Implementation Model, Red River Prairie Subsection.
Region (30 meter cells) |
Random Points |
Negative Survey Points |
Single Artifacts |
Sites |
||||||
# |
% |
# |
% |
# |
% |
# |
% |
# |
% |
|
Unknown |
10447114 |
51.13 |
2030 |
52.13 |
110 |
14.57 |
5 |
19.23 |
23 |
8.52 |
Possibly Low |
2940093 |
14.39 |
562 |
14.43 |
93 |
12.32 |
1 |
3.85 |
13 |
4.81 |
Low |
904363 |
4.43 |
154 |
3.95 |
114 |
15.1 |
1 |
3.85 |
5 |
1.85 |
Suspected Medium |
739566 |
3.62 |
155 |
3.98 |
17 |
2.25 |
0 |
0 |
3 |
1.11 |
Possibly Medium |
1881441 |
9.21 |
359 |
9.22 |
61 |
8.08 |
4 |
15.38 |
22 |
8.15 |
Medium |
1451205 |
7.1 |
268 |
6.88 |
96 |
12.72 |
3 |
11.54 |
20 |
7.41 |
Suspected High |
34466 |
0.17 |
3 |
0.08 |
1 |
0.13 |
0 |
0 |
0 |
0 |
Possibly High |
279697 |
1.37 |
48 |
1.23 |
19 |
2.52 |
0 |
0 |
9 |
3.33 |
High |
1723954 |
8.44 |
311 |
7.99 |
244 |
32.32 |
12 |
46.15 |
175 |
64.81 |
Water |
30193 |
0.15 |
4 |
0.1 |
0 |
0 |
0 |
0 |
0 |
0 |
Steep Slopes |
730 |
0.004 |
0 |
0 |
0 |
0 |
0 |
0 |
0 |
0 |
Mines |
0 |
0 |
0 |
0 |
0 |
0 |
0 |
0 |
0 |
0 |
Total |
20432822 |
100 |
3894 |
100 |
755 |
100 |
26 |
100 |
270 |
100 |
The landscape suitability model for the Red River of the North covers the eastern edge of the Red River Prairie subsection from Breckenridge north (Section 12.7). This model extends about 13 km from the Red River at its widest point. The model indicates a moderate to high potential for buried sites in this valley. It should be consulted for both surface and subsurface site suitability whenever projects occur within its bounds.
8.24 Rochester Plateau
8.25 St. Croix Moraines and Outwash Plains (Twin Cities Highlands)
8.26 St. Louis Moraines/ Tamarack Lowlands
8.27 Conclusion
References
The Mn/Model Final Report (Phases 1-3) is available on CD-ROM. Copies may be requested by visiting the contact page.

Acknowledgements
MnModel was financed with Transportation Enhancement and State Planning and Research funds from the Federal Highway Administration and a Minnesota Department of Transportation match.
Copyright Notice
The MnModel process and the predictive models it produced are copyrighted by the Minnesota Department of Transportation (MnDOT), 2000. They may not be used without MnDOT's consent.