Quick Links
Chapters
- Management Summary
- Research Design & Time Line
- Environment & Native American Culture
- GIS Design
- Archaeological Database
- Archaeological & Environmental Variables
- Model Development & Evaluation
- Model Results & Interpretation
- Project Applications
- Model Enhancements
- Model Implementation
- Landscape Suitability Models
- Summary & Recommendations
Appendices
- Archaeological Predictive Modeling: An Overview
- GIS Standards & Procedures
- Archaeology Field Survey Standards, Procedures & Rationale
- Archaeology Field Survey Results
- Geomorphology Survey Profiles, Sections, & Lists
- Building a Macrophysical Climate Model for the State of Minnesota
- Correspondence of Support for Mn/Model
- Glossary
- List of Figures
- List of Tables
- Acknowledgments
8.21 OAK SAVANNA SUBSECTION OF MINNESOTA & NE IOWA MORAINAL SECTION
8.21.1 Environmental Context
8.21.2 Site Probability Model
8.21.3 Survey
Probability Model
8.21.4 Survey Implementation Model
8.21.5 Other Models
This regional model report is organized as described in Sections 8.2.1 through 8.4.1. Refer to these sections of the report for explanations of the tables, variables, and statistics.
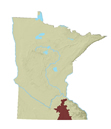
Oak Savanna is a subsection of the Minnesota and Northeast Iowa Moraine Section of the Eastern Broadleaf Forest Province (Figure 8.1) (Minnesota DNR 1998).
The western boundary is based on the interface between a series of ground moraines to the east and a complex of ground moraines, stagnation moraines, and end moraines (Figure 8.21.2.a) to the west. The southern half of this boundary coincides with the ecotone between prairie communities to the west and the oak openings and barrens/prairie complex to the east (Figure 8.21.1b). The northwestern boundary follows the transition from oak savanna to Big Woods communities. The eastern boundary is based on the interface between this oak savanna/prairie complex on the west and the oak/Big Woods/prairie complex to the east. The northern boundary is defined by the interface between the Superior or Des Moines Lobe outwash sediments and the pre-Wisconsin deposits of glacial drift (Figure 8.21.2.a).
Much of the subsection has not been affected by glacial activity, but is a loess plain over bedrock or till. Topography is gently rolling with steep slopes in the southwest (Figure 8.21.1.a). The subsection contains both well-drained and poorly-drained soils (Figure 8.21.2.b). In the 19th century the northern portion and approximately the eastern half of the subsection were primarily covered with prairie, with small scattered areas of brush prairie and oak savanna (Figure 8.21.1.b). Along the northwestern and western edges were areas of prairie mixed with areas of oak savanna. The central and southwest portions were primarily oak savanna with scattered areas of prairie and wet prairie. Small stands of Big Woods and aspen-oak woodland were present along the Straight River in Rice County, along the Cedar River in western Mower County, and at the far western tip of the subsection.
8.21.2.1 Description
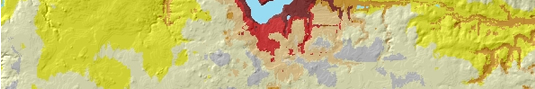
Areas of high and medium site potential in the site probability model (Figure 8.21.3) correspond to the margins of lakes, wetlands or areas of organic soil, and river valleys. That is, the zone of high site potential extends away from areas around the nearest water body in a pattern resembling that of the water feature. These zones correspond almost exclusively to locations containing concentrations of known archaeological sites.
Zones of high site potential are scattered along several watercourses. These include the Le Sueur River on the most western peninsula of the subsection; Dodge Center Creek and the Middle Branch Zumbro River in the center and east portion of the subsection; and the Cannon River and Prairie Creek in northwestern Goodhue county in the north of the subsection. In the southwest part of the subsection (central Freeborn County), areas of high site potential surround Albert Lea and Geneva lakes. Zones of medium site potential occur around the high site potential areas and along various creeks in the subsection, and an area connecting the two lakes. Areas of high and medium site potential that are farther out from the lakes are associated with the margins of wetlands or areas of organic soil.
The most extensive zone of high site potential is found in Freeborn County, in the southwest corner of the subsection, around Albert Lea and Fountain lakes, the Twin Lakes and Pickerel Lake (located just outside the subsection) and along Goose Creek. Other large zones of high site potential are found around Geneva Lake in Freeborn County and along the Cedar River and its tributaries in Mower County in the south central part of the subsection. Along the west central edge of the subsection are three zones of high site potential. They are associated with Clear, Rice, Watkins, and Goose Lakes in Waseca County, and the Cannon and lower Straight Rivers and Cannon Lake in Rice County. In the center of the subsection, in Steele County, there is a zone of high site potential around Rice Lake.
In the center of the subsection is an isolated narrow line of steep slopes oriented in an east-west direction. This line is an artifact of the edges of adjacent quad sheets of varying quality and scale and should not be considered as a predictive feature. In addition to this single feature, all of the 1:24,000 DEMs in the subsection exhibit banding. This is manifest in the model as small striations. These should not be interpreted as predictive features.
8.21.2.2 Evaluation
The combined site probability model developed for Oak Savanna and St. Croix Moraines & Outwash Plains subsection has been selected to represent the Oak Savanna subsection. This model performed very well. It is based on 11 variables (Table 8.21.1) representing topography, vegetation, soils, and hydrology.
Table 8.21.1. Site Probability Model, St. Croix Moraines & Outwash Plains and Oak Savanna Subsections.
Intercept |
7.249 |
|
ln(nonsites/sites) |
2.252574672 |
|
Variable |
Regression Coefficient |
Probability |
Distance to conifers |
0.01247892 |
99.7 |
Distance to edge of nearest large lake |
-0.02424894 |
100.0 |
Distance to nearest lake inlet/outlet |
-0.02197322 |
100.0 |
Distance to nearest lake permanent inlet/outlet |
0.01657206 |
100.0 |
Distance to nearest lake, wetland, organic soils, or stream |
-0.04962874 |
100.0 |
Distance to paper birch |
-0.01666098 |
99.7 |
Distance to permanent wetland inlet/outlet |
0.02382810 |
100.0 |
Distance to sugar maple |
-0.01969145 |
100.0 |
Elevation |
-0.01205143 |
99.7 |
Height above surroundings |
0.04598336 |
81.0 |
Vegetation diversity within 1 km |
0.3430567 |
51.5 |
When the model is applied to the Oak Savanna subsection, 91.73 percent of all sites, excluding single artifacts, are in the high and medium site potential areas, which constitute 20.55 percent of landscape. This produces a strong overall gain statistic of 0.77597 (Table 8.6.11), which is higher than the statewide average. The model did not test well, but the small size of the test database (12 sites) makes any conclusions from this test tenuous. Only 50 percent of the test sites were predicted, producing a gain statistic of 0.58900.
Table 8.21.2. Evaluation of the Oak Savanna Portion of the Site Probability Model, St. Croix Moraines & Outwash Plains and Oak Savanna Subsection.
Region (30 meter cells) |
Random Points |
Negative Survey Points |
Modeled Sites |
Test Sites |
||||||
# |
% |
# |
% |
# |
% |
# |
% |
# |
% |
|
Low |
6051990 |
79.29 |
1241 |
79.96 |
375 |
62.29 |
10 |
8.26 |
6 |
50.0 |
Medium |
994130 |
13.02 |
207 |
13.34 |
132 |
21.93 |
22 |
18.18 |
3 |
25.00 |
High |
574396 |
7.53 |
104 |
6.70 |
95 |
15.78 |
89 |
73.55 |
3 |
25.00 |
Water |
10460 |
0.14 |
0 |
0 |
0 |
0 |
0 |
0 |
0 |
0 |
Steep Slopes |
1801 |
0.02 |
0 |
0 |
0 |
0 |
0 |
0 |
0 |
0 |
Mines |
0 |
0 |
0 |
0 |
0 |
0 |
0 |
0 |
0 |
0 |
Total |
7632777 |
100 |
1552 |
100 |
602 |
100 |
121 |
100 |
12 |
100 |
The modeling database included 247 sites that were not single artifacts, 121 of these were in the Oak Savanna subsection. Two preliminary models, using different halves of the known sites, had 79 percent agreement within the Oak Savanna subsection (79 percent of the cells in the subsection were classified the same in both models). The Kappa statistic, which is adjusted for the amount of agreement expected by chance alone, was 0.51064 (Table 8.6.11), slightly below average. Two preliminary models based on only the 121 sites from the Oak Savanna subsection, had only 68 percent agreement and a Kappa of 0.22193. The conditional Kappa statistics (Table 8.21.3) are lowest for the high and medium site potential zones. This indicates that the majority of instability in the model is in determining whether cells are high or medium probability.
Increasing the number of sites available for modeling may improve confidence in the model and model stability.
Table 8.21.3. Conditional Kappa Values for the Oak Savanna Portion of the Site Probability Model, St. Croix Moraines & Outwash Plains and Oak Savanna Subsections.
Class |
Ki |
Proportion Correct |
Low |
0.5506 |
0.8634 |
Medium |
0.4427 |
0.5712 |
High |
0.5088 |
0.5448 |
8.21.2.3 Interpretation
The site probability model for Oak Savanna subsection is constructed from 11 variables, including two topographic, five hydrologic, and four vegetation variables (Table 8.21.1).
8.21.2.3.1 Differences between Modeled Sites and Random Points for Individual Model Variables
Five of the model variables have correlation coefficients with model sites above 0.3 (Table 8.21.4). Compared to random points, sites tend to be closer to the nearest large lake (10,804 vs. 19,460 meters, Figure 8.21.8c). There are few large lakes in the Oak Savanna. Rice Lake is in the center of the subsection and the remainder are along the western border (Figure 8.21.1a).
Sites are somewhat further, on average, from the nearest permanent wetland inlet/outlet (104,142 vs. 97,469 meters, Figure 8.21.10c) than are random points. Since this inlet/outlet is outside the subsection to the north, this variable simply indicates that sites are more likely to be in the southern part of the subsection, as does the variable distance from conifers(Figure 8.21.11a). Sites also tend to be situated away from paper birch (53,639 vs. 41,779 meters, Figure 8.21.11c), which is found only along the eastern border, but closer to sugar maple (4,586 vs. 11,151 meters, Figure 8.21.12b), which is found near water bodies.
Although the correlation between distance to nearest lake, wetland, organic soil, or stream and site potential is weak, the difference between site and random point means is significant (89 vs. 255 meters, Figure 8.21.9c). Sites also are at lower elevations (Figure 8.21.8a), but at greater heights above their surroundings (Figure 8.21.8b), than would be expected by chance. As is common elsewhere in the state, sites are in areas of high vegetation diversity (Figures 8.21.5.a and 8.21.12c).
The Mann-Whitney U tests (Table 8.21.4) indicate that the differences in values between sites and random points are significant at the 0.05 level for all except two variables, distance to nearest lake inlet/outlet (Figure 8.21.10a) and distance to nearest permanent lake inlet/outlet (Figure 8.21.10b). These results indicate that sites and random points are drawn from different populations.
Table 8.21.4. Model Variable Statistics.
Oak Savanna |
Modeled Sites |
Surveyed Areas |
Modeled Sites |
Sites in Low Prob. |
Neg. Survey Points |
Random Points |
||||||
Model Variable |
Coeff. |
Sign. |
Coeff. |
Sign. |
Mean |
S.D. |
Mean |
S.D. |
Mean |
S.D. |
Mean |
S.D. |
Elevation |
0.163 |
0 |
- |
- |
1172.14 |
127.08 |
1210.4 |
150.54 |
1167.15 |
79.93 |
1215.6 |
112.49 |
Height above surroundings |
0.226 |
0.001 |
- |
- |
9.69 |
7.52 |
11.1 |
5 |
7.68 |
5.09 |
7.29 |
5.82 |
Distance to edge of nearest large lake |
-0.411 |
0 |
-0.862 |
0 |
103.94 |
62.73 |
187.57 |
53.05 |
103.06 |
54.98 |
139.47 |
54.56 |
Distance to edge of nearest perennial river or stream |
- |
- |
0.718 |
0 |
37.3 |
30.37 |
25.89 |
28.87 |
59.67 |
35.77 |
44.96 |
24.38 |
Distance to nearest intermittent stream |
- |
- |
0.701 |
0 |
39.39 |
19.19 |
25.61 |
14.98 |
33.94 |
20.48 |
27.38 |
16.41 |
Distance to nearest confluence between perennial or intermittent streams and large rivers |
- |
- |
0.453 |
0.169 |
78.23 |
35 |
72.62 |
37.21 |
96.57 |
35.13 |
93.21 |
31.04 |
Distance to nearest lake, wetland, organic soil, or stream |
-0.085 |
0 |
0.073 |
0 |
9.44 |
7.02 |
13.55 |
7.47 |
14.86 |
9.12 |
15.97 |
9.36 |
Distance to edge of nearest large wetland |
- |
- |
-0.597 |
0 |
68.28 |
27.95 |
98.89 |
28.47 |
71.9 |
29.08 |
84.29 |
28.05 |
Distance to nearest lake inlet/outlet |
0.224 |
0.095 |
- |
- |
85.95 |
31.37 |
78.63 |
28.28 |
93.72 |
33.32 |
82.22 |
27.36 |
Distance to nearest permanent lake inlet/outlet |
0.05 |
0.799 |
- |
- |
94.48 |
26.81 |
96.07 |
22.39 |
100.59 |
29.57 |
95.08 |
26.15 |
Distance to nearest permanent wetland inlet/outlet |
0.308 |
0.022 |
-0.303 |
0 |
322.71 |
57.23 |
318.15 |
65.33 |
288.86 |
33.86 |
312.17 |
56.36 |
Vertical distance to permanent water |
- |
- |
-0.321 |
0 |
17.18 |
29.97 |
52.1 |
86.88 |
22.07 |
28.1 |
33.29 |
37.79 |
Distance to conifers |
0.525 |
0 |
- |
- |
388.42 |
49.86 |
371.75 |
57.17 |
361.83 |
25.91 |
374.95 |
46.69 |
Distance to oak woodland |
- |
- |
0.013 |
0.542 |
14.66 |
17.5 |
29.41 |
20.07 |
34.25 |
23.94 |
31.8 |
26.18 |
Distance to paper birch |
0.505 |
0 |
0.826 |
0 |
231.6 |
59.16 |
146.45 |
65.72 |
232.69 |
59.06 |
204.4 |
51.11 |
Distance to prairie |
- |
- |
0.093 |
0.902 |
32.94 |
24.41 |
4.67 |
10.43 |
9.91 |
15.01 |
15.43 |
22.79 |
Distance to river bottom forest |
- |
- |
0.82 |
0 |
157.77 |
65.61 |
120.9 |
57.64 |
196.72 |
64.36 |
151.17 |
54.61 |
Distance to sugar maple |
-0.668 |
0 |
-0.401 |
0 |
67.72 |
30.92 |
104.89 |
20.19 |
86.73 |
22.91 |
105.55 |
30.7 |
Vegetation diversity within 1 km |
0.12 |
0 |
- |
- |
2.49 |
0.79 |
2.2 |
0.63 |
2.15 |
0.94 |
1.75 |
0.76 |
Distance to bedrock used for tools |
- |
- |
0.305 |
0 |
152.34 |
86.19 |
93.08 |
57.18 |
90.74 |
48.4 |
110.6 |
71.68 |
Distance to edge of nearest area of organic soils |
- |
- |
-0.739 |
0 |
63.67 |
39.1 |
117.05 |
37.23 |
65.72 |
45.27 |
84.74 |
47 |
Distance to glacial lake sediment |
- |
- |
-0.847 |
0 |
221.31 |
48.37 |
260.88 |
60.82 |
191.32 |
64.99 |
238.99 |
46.6 |
Frequency counts |
121 |
733 |
121 |
10 |
602 |
1553 |
||||||
See Interpretation section for discussion of the statistics:
Coeff. = correlation coefficient
Sign. = significance of the Mann-Whitney U test
S.D. = standard deviation
Distances and areas are expressed in square roots of meters. Square the values in the table to get actual values.
8.21.2.3.2 Relationships between Variable Pairs
There is a moderate amount of data redundancy, as indicated by the eight pairs of variables with correlation coefficients greater than 0.5 (Table 8.21.5).
Distance to the nearest large lake is negatively correlated with distance to nearest lake inlet/outlet (-0.76) and distance to nearest permanent lake inlet/outlet (-0.55). Most lake inlets/outlets are on small lakes, dispersed throughout the subsection, while large lakes are only in the western half of the subsection. There is a moderate positive correlation coefficient (0.53) between the variables distance to permanent lake inlet/outlet and distance to nearest lake inlet/outlet. Although there are more lake inlet/outlets than permanent lake inlet/outlets, both lakes and permanent lakes are distributed in a similar spatial pattern across the subsection. Permanent wetland inlet/outlets tend to be at lower elevations, with a correlation coefficient of 0.57.
Distance to paper birch (Figure 8.21.5.b), which seems simply to be a measure of the east-west axis of the subsection, is correlated with three hydrologic variables, distance to nearest large lake (-0.76), distance to nearest lake inlet/outlet (0.68), and distance to nearest permanent lake inlet/outlet (0.5). This indicates that large lakes are in the western half of the subsection, while lake inlet/outlets and permanent lake inlet/outlets are weighted more towards the east.
Finally, the very strong correlation between conifers and permanent wetland inlets/outlets reflects the fact that both are located outside the subsection to the north.
Table 8.21.5. Variable Correlation Matrix.
Oak Savanna |
Elevation |
Height above surroundings |
Distance to edge of nearest large lake |
Distance to nearest lake, wetland, organic soil, or stream |
Distance to nearest lake inlet/outlet |
Distance to nearest permanent lake inlet/outlet |
Elevation |
1 |
|||||
Height above surroundings |
0.41 |
1 |
||||
Distance to edge of nearest large lake |
0.04 |
-0.11 |
1 |
|||
Distance to nearest lake, wetland, organic soil, or stream |
0.02 |
0.14 |
-0.06 |
1 |
||
Distance to nearest lake inlet/outlet |
-0.05 |
0.24 |
-0.76 |
0.14 |
1 |
|
Distance to nearest permanent lake inlet/outlet |
0.1 |
0.18 |
-0.55 |
0.02 |
0.53 |
1 |
Distance to nearest permanent wetland inlet/outlet |
0.57 |
0.15 |
0.38 |
0 |
-0.25 |
-0.18 |
Distance to conifers |
0.45 |
0.14 |
0.18 |
0.05 |
-0.12 |
-0.16 |
Distance to paper birch |
-0.04 |
0.26 |
-0.76 |
0.13 |
0.68 |
0.5 |
Distance to sugar maple |
0.01 |
-0.15 |
0.21 |
-0.19 |
-0.22 |
0.14 |
Vegetation diversity within 1 km |
0.1 |
0.02 |
-0.18 |
0.32 |
0.1 |
0.28 |
Distance to nearest permanent wetland inlet/outlet |
Distance to conifers |
Distance to paper birch |
Distance to sugar maple |
Vegetation diversity within 1 km |
||
Distance to nearest permanent wetland inlet/outlet |
1 |
|||||
Distance to conifers |
0.91 |
1 |
||||
Distance to paper birch |
0 |
0.26 |
1 |
|||
Distance to sugar maple |
-0.23 |
-0.43 |
-0.45 |
1 |
||
Vegetation diversity within 1 km |
0.03 |
0.06 |
0.15 |
-0.02 |
1 |
|
Refer to "Relationships between variable pairs" for interpretation of the table values.
8.21.2.3.3 Sites in Low Probability Areas
Comparison of sites situated in low potential areas with random points and all modeled sites provides some insights into the kinds of sites the model is unable to predict. These sites are clearly from a different population than are all modeled sites, to which they have similar means on only four variables (height above surroundings, distance to nearest confluence between perennial or intermittent streams and large rivers, distance to nearest permanent wetland inlet/outlet, and vegetation diversity within one km). Mean variable values for sites in low probability areas are similar to those for random point values on nine variables (Table 8.21.4) and more different from modeled sites than are random points on 12 more.
Sites in low site potential areas average 35,183 meters from the nearest large lake, while modeled sites and random points are much closer (10,804 and 19,460 meters). They are also farther north (nearer to paper birch) than modeled sites or random points. Compare to modeled sites and random points, sites in low probability areas are much closer to prairie and to river bottom forest, farther from large wetlands, closer to lake inlet/outlets, at a much greater vertical distance from water, closer to bedrock used for tools, and much farther from organic soils and glacial lake sediment.
Of the 10 sites in low probability areas, two are lithic workshops, two are mounds or earthworks, and six are lithic scatters. If all site types were predicted equally well by the model, 10 percent of each site type should be in the low probability areas. Mounds/earthworks and lithic scatters both meet this expectation, begin neither over nor under represented in the low probability areas. Lithic workshops are not well predicted by the model. The only lithic workshops known to be in the subsection are in low probability areas, explaining the low mean value for distance to bedrock used for tools in this population. With so few known sites of this type, their distinct environmental attributes have little to no effect on the model.
8.21.2.3.4 Relationships between Cultural Context, Descriptive, or Settlement Variables and Site Potential
There are enough sites in this subsection to permit an examination of the distribution of sites according to three cultural context variables: Archaic vs. not Archaic, aceramic vs. not aceramic, and single component vs. not single component (Table 8.21.6). Although the chi-square test indicates that none of these relationships is significant at the 0.05 level, Archaic and aceramic sites tend to be somewhat more common in the low and medium site potential zones compared to non-Archaic or non-aceramic sites. The percentage of single component sites, compared to sites with multiple occupations, is somewhat higher in the high site potential areas.
Table 8.21.6. Summary of Bivariate Relationships between Three Dichotomous Archaeological Variables and Three Areas of Site Potential, Oak Savanna (Site Probability Model).
Low Potential |
Medium Potential |
High Potential |
Total |
Chi-square Test |
|||||||
Dichotomous Variable |
N |
% |
N |
% |
N |
% |
N |
% |
value |
df |
p-value |
All Sites |
21 |
16.0 |
21 |
16.0 |
89 |
67.9 |
131 |
99.9 |
- |
- |
- |
Archaic |
2 |
12.5 |
3 |
18.8 |
11 |
68.8 |
16 |
100.1 |
1.89 |
2 |
0.39 |
Not Archaic |
3 |
9.7 |
2 |
6.5 |
26 |
83.9 |
31 |
100.1 |
|||
Aceramic |
2 |
11.1 |
3 |
16.7 |
13 |
72.2 |
18 |
100.0 |
1.16 |
2 |
0.56 |
Not Aceramic |
3 |
10.3 |
2 |
6.9 |
24 |
82.8 |
29 |
100.0 |
|||
Single Component |
3 |
9.1 |
3 |
9.1 |
27 |
81.8 |
33 |
100.0 |
0.63 |
2 |
0.73 |
Not Single Component |
2 |
14.3 |
2 |
14.3 |
10 |
71.4 |
14 |
100.0 |
|||
8.21.3 Survey Probability Model
8.21.3.1 Description
The survey probability model (Figure 8.21.6) for the Oak Savanna subsection indicates that the majority of the landscape has not been adequately surveyed. Instead, surveys have been concentrated in a band stretching from Waseca, through Steele and Dodge Counties, ending in western Olmsted County. Surveys have been conducted along US Highway 14, Interstate 35 and Minnesota 56 north of 14, and CSAH 74. These creates a distinct wedge of high and medium survey potential across the subsection's center. High probability, with no apparent relationship to water bodies, dominates the western portion of the wedge, where drainage is less organized. With the development of dendritic stream valleys in the central and eastern portion of the wedge, high survey probability shows a relationship to certain water bodies and medium probability dominates the landscape elsewhere. High and medium survey potential are much more extensive than high and medium site potential within this wedge.
Further north, linear surveys have been conducted along Minnesota 6, primarily in eastern Rice County. The extent of high and medium probability does not extent the full length of the corridor surveyed. A number of surveys are found in the vicinity of Chub Creek and the Cannon River above Lake Byllesby in Dakota County, creating with a small wedge of high and medium probability.
In the southern portion of the subsection, past surveys have been almost exclusively associated with water. This results in concentrations of high and medium survey potential in the vicinity of Albert Lea, Goose, Fountain, and Geneva lakes and along the Cedar River and Spring Valley Creek. The variable distance to sugar maple appears to play a role in determining which stream valleys are categorized as high survey potential.
8.21.3.2 Evaluation
The Oak Savanna survey probability model predicted surveyed places better than by chance alone. The model is based on 16 variables (Table 8.21.7), representing topography, vegetation, soils and hydrology.
Table 8.21.7. Survey Probability Model, Oak Savanna Subsection.
Intercept |
-1.982 |
|
ln(nonsites/sites) |
0.752728002 |
|
Variable |
Regression Coefficient |
Probability |
Distance to bedrock used for tools |
-0.007131275 |
81.0 |
Distance to edge of nearest organic soils |
0.009119455 |
100.0 |
Distance to edge of nearest perennial river or stream |
-0.009538946 |
67.8 |
Distance to glacial lake sediment |
-0.02711643 |
98.4 |
Distance to nearest intermittent stream |
0.01873960 |
35.9 |
Distance to nearest confluence between perennial or intermittent streams and large rivers |
-0.01378512 |
100.0 |
Distance to nearest lake, wetland, organic soil, or stream |
-0.03460607 |
100.0 |
Distance to edge of nearest large lake |
-0.01006891 |
69.5 |
Distance to nearest large wetland |
-0.01373224 |
100.0 |
Distance to nearest permanent wetland inlet/outlet |
0.01977750 |
99.5 |
Distance to oak woodland |
-0.008847343 |
100.0 |
Distance to paper birch |
-0.02218337 |
79.5 |
Distance to prairie |
-0.02320736 |
61.8 |
Distance to river bottom forest |
0.01136717 |
100.0 |
Distance to sugar maple |
-0.02299512 |
100.0 |
Vertical distance to permanent water |
-0.005833006 |
995 |
The model predicts 87.45 percent of all sites in high/medium survey potential areas, which make up 39.93 percent of the landscape (Table 8.21.8). This produces a gain statistic of 0.54340 (Table 8.6.14), indicating a moderate level of survey bias. The number of surveyed places (733) in the Oak Savanna is much lower than the statewide average. Although the survey frequency of 0.107 surveys per square km is only slightly lower than average, site frequency (0.018) is low.
Table 8.21.8. Evaluation of Survey Probability Model, Oak Savanna Subsection.
Region (30 meter cells) |
All random points |
All negative survey points |
All sites |
All sites and negative survey points |
||||||
# |
% |
# |
% |
# |
% |
# |
% |
# |
% |
|
Low |
4572688 |
59.91 |
944 |
60.67 |
71 |
11.79 |
21 |
16.03 |
92 |
12.55 |
Medium |
1524162 |
19.97 |
307 |
19.73 |
127 |
21.10 |
21 |
16.03 |
148 |
20.19 |
High |
1523727 |
19.96 |
302 |
19.41 |
404 |
67.11 |
89 |
67.94 |
493 |
67.26 |
Water |
10460 |
0.14 |
2 |
0.13 |
0 |
0 |
0 |
0 |
0 |
0 |
Steep Slopes |
1801 |
0.02 |
1 |
0.06 |
0 |
0 |
0 |
0 |
0 |
0 |
Mines |
0 |
0 |
0 |
0 |
0 |
0 |
0 |
0 |
0 |
0 |
Total |
7632838 |
100 |
1556 |
100 |
602 |
100 |
131 |
100 |
733 |
100 |
Two preliminary survey probability models had 73 percent agreement. The Kappa statistic for these models was lower than average at 0.49516 (Table 8.6.14). The conditional Kappa statistics (Table 8.21.9) are lowest for the medium site potential zone. There is considerable uncertainty in determining whether this zone is correctly coded. It is assumed that increasing the number of surveyed places may improve model stability, as will distributing more surveys throughout the undersurveyed areas.
Table 8.21.9. Conditional Kappa Values for Survey Probability Model, Oak Savanna Subsection.
Class |
Ki |
Proportion Correct |
Low |
0.6807 |
0.8883 |
Medium |
0.1692 |
0.2938 |
High |
0.5979 |
0.6783 |
8.21.3.3 Interpretation
The survey probability model is made up of 16 variables; only five of these are shared with the site probability model (Table 8.21.4). All variables except three (distance to nearest lake, wetland, organic soil, or stream; distance to oak woodland, and distance to prairie) have correlation coefficients in excess of 0.3. The coefficients for more than half of these are greater than 0.7.
Negative survey points' mean values for distance to nearest lake, wetland, organic soil, or stream (Figure 8.21.9c), distance to nearest confluence between perennial or intermittent streams and large rivers (Figure 8.21.9b) and distance to oak woodland (Figure 8.21.11b) are similar to means for random points, suggesting that surveys have been random with respect to these variables. However, negative point means are similar to modeled site means for distance to edge of nearest large lake (Figure 8.21.8c) and distance to edge of nearest area of organic soils (Figure 8.21.13a), indicating some of the measures by which their distributions are biased.
Negative survey points are distinct from both sites and random points in being farther from perennial rivers or streams (Figure 8.21.8d), permanent lake inlet/outlets (Figure 8.21.10b), and river bottom forests (Figure 8.21.12a) and closer to large wetlands (Figure 8.21.9d), glacial lake sediment (Figure 8.21.13b), prairie (Figure 8.21.11d), and bedrock used for tools (Figure 8.21.12d). The predominance of surveys in the northwestern quadrant of the subsection results in low mean values for negative survey points on distance to permanent wetland inlet/outlets (Figure 8.21.10c) and high mean values for distance to paper birch (Figure 8.21.11c).
For the variables distance to nearest intermittent stream (Figure 8.21.9a), vertical distance to permanent water (Figures 8.21.4.b and 8.21.10d), and distance to sugar maple (Figure 8.21.12b), negative survey points have mean values between those for modeled sites and random points.
The results of the Mann-Whitney U tests (Table 8.21.4) indicate that all except three variables are significant at the 0.05 level. This means that the surveyed places and random points are drawn from different populations.
8.21.4 Survey Implementation Model
The survey implementation model for the Oak Savanna indicates that 52.82 percent of the subsection is classified as unknown because of inadequate survey (Table 8.21.10 and Figure 8.21.7). These areas are located away from major rivers and lakes and away from the Highway 14 corridor. Five (41.67 percent) of the twelve test sites are from the unknown area.
Low and possibly low site probability zones occupy 26.47 percent of the subsection. Much of this area is in Waseca and Steele counties, where linear surveys have been most heavily concentrated. More surveys are needed in the southern, northern, and eastern portions of the subsection to improve model performance and reduce the extent of the unknown area.
Table 8.21.10. Evaluation of Survey Implementation Model, Oak Savanna Subsection.
Region (30 meter cells) |
Random Points |
Negative Survey Points |
Single Artifacts |
Sites |
||||||
# |
% |
# |
% |
# |
% |
# |
% |
# |
% |
|
Unknown |
4031429 |
52.82 |
840 |
53.98 |
64 |
10.63 |
3 |
30 |
6 |
4.96 |
Possibly Low |
1112311 |
14.57 |
220 |
14.14 |
88 |
14.62 |
0 |
0 |
3 |
2.48 |
Low |
908250 |
11.9 |
182 |
11.7 |
223 |
37.04 |
1 |
10 |
1 |
0.83 |
Suspected Medium |
397143 |
5.2 |
80 |
5.14 |
5 |
0.83 |
0 |
0 |
8 |
6.61 |
Possibly Medium |
292738 |
3.84 |
67 |
4.31 |
23 |
3.82 |
1 |
10 |
7 |
5.79 |
Medium |
304249 |
3.99 |
60 |
3.86 |
104 |
17.28 |
1 |
10 |
7 |
5.79 |
Suspected High |
144108 |
1.89 |
24 |
1.54 |
2 |
0.33 |
0 |
0 |
4 |
3.31 |
Possibly High |
119082 |
1.56 |
20 |
1.29 |
16 |
2.66 |
0 |
0 |
10 |
8.26 |
High |
311206 |
4.08 |
60 |
3.86 |
77 |
12.79 |
4 |
40 |
75 |
61.98 |
Water |
10460 |
0.14 |
2 |
0.13 |
0 |
0 |
0 |
0 |
0 |
0 |
Steep Slopes |
1801 |
0.02 |
0 |
0 |
0 |
0 |
0 |
0 |
0 |
0 |
Mines |
0 |
0 |
0 |
0 |
0 |
0 |
0 |
0 |
0 |
0 |
Total |
7632777 |
100 |
1555 |
100 |
602 |
100 |
10 |
100 |
121 |
100 |
River valleys in the Oak Savanna subsection have the potential to contain buried sites. However, a landscape suitability model has been constructed only for the Root River (Section 12.9) and only a small portion of this model is within the subsection.
8.22 Pine Moraines & Outwash Plains
8.23 Red River Prairie
8.24 Rochester Plateau
8.25 St. Croix Moraines and Outwash Plains (Twin Cities Highlands)
8.26 St. Louis Moraines/ Tamarack Lowlands
8.27 Conclusion
References
The Mn/Model Final Report (Phases 1-3) is available on CD-ROM. Copies may be requested by visiting the contact page.

Acknowledgements
MnModel was financed with Transportation Enhancement and State Planning and Research funds from the Federal Highway Administration and a Minnesota Department of Transportation match.
Copyright Notice
The MnModel process and the predictive models it produced are copyrighted by the Minnesota Department of Transportation (MnDOT), 2000. They may not be used without MnDOT's consent.