Quick Links
Chapters
- Management Summary
- Research Design & Time Line
- Environment & Native American Culture
- GIS Design
- Archaeological Database
- Archaeological & Environmental Variables
- Model Development & Evaluation
- Model Results & Interpretation
- Project Applications
- Model Enhancements
- Model Implementation
- Landscape Suitability Models
- Summary & Recommendations
Appendices
- Archaeological Predictive Modeling: An Overview
- GIS Standards & Procedures
- Archaeology Field Survey Standards, Procedures & Rationale
- Archaeology Field Survey Results
- Geomorphology Survey Profiles, Sections, & Lists
- Building a Macrophysical Climate Model for the State of Minnesota
- Correspondence of Support for Mn/Model
- Glossary
- List of Figures
- List of Tables
- Acknowledgments
8.12 BORDER LAKES SUBSECTION OF NORTHERN SUPERIOR UPLANDS SECTION
8.12.1 Environmental Context
8.12.2 Site Probability Model
8.12.3 Survey Probability Model
8.12.4 Survey Implementation Model
8.12.5 Other Models
This regional model report is organized as described in Sections Sections 8.2.1 through 8.4.1. Refer to these sections of the report for explanations of the tables, variables, and statistics.
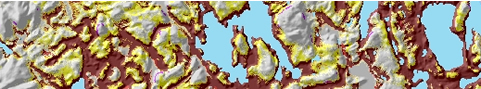
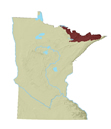
Border Lakes is a subsection of the Northern Superior Uplands section of the Laurentian Mixed Forest Province (Figure 8.1) (Minnesota DNR 1998). It is characterized by a large number of lakes and rocky ridges on glacially-eroded bedrock and poor soils. Much of this subsection is occupied by the Boundary Waters Canoe Area (BWCA).
The northern boundary of the subsection is the US-Canada border. The western border follows the transition from lake-laid mineral sediment and ground moraines on the west to a bedrock-dominated landscape to the east. This transition zone follows the Vermilion River north from Lake Vermilion to where the river turns east towards Crane Lake. From there it angles to the northwest along the south shore of Kabetogama Lake to the west end of Rainy Lake. The southern boundary is the interface between the Rainy Lobe moraine material to the north and the Superior Lobe moraine material to the south. The west part of the southern boundary also coincides with the change from a landform characterized by exposed bedrock to one covered by thicker sediments (Dan Hanson, personal communication, 1997).
This subsection consists of scoured bedrock uplands or shallow soils, with large numbers of lakes (Figure 8.12.1.a) occupying east-west oriented valleys left by glacial activity. The quaternary geology map (Figure 8.12.2.a) shows a very homogeneous landform occupied by ground moraine. Topography is mostly rolling, with irregular slopes and craggy outcrops. The highest point in Minnesota (2,301 feet) is located in the Border Lakes subsection. Well-drained soil conditions (Figure 8.12.2.b) dominate the subsection. Lakes cover about 13 percent of the subsection's surface. An extensive drainage network of streams and rivers is also present (Minnesota DNR 1998).
Historic vegetation (Figure 8.12.1.b) consisted of three major forest types: jack pine, white-red pine, and mixed hardwood and pine. Jack pine barrens were common in areas not occupied by small lakes. White and red pines dominated in the central area from Lake Vermilion northeast, along the northern border, and in the northwest. In each of these areas, aspen-birch forest was also present. Conifer bogs were interspersed with upland forests throughout the central, southern, and eastern portions of the subsection.
8.12.2.1 Description
Areas of high and medium site potential for archaeological sites in the Border Lakes subsection are concentrated around lakes and within river and stream corridors (Figure 8.12.3). Zones of high and medium site potential extend away from water features where there is level topography.
In northwestern portion of the subsection, large contiguous areas of high site potential are within and adjacent to Rainy and Kabetogama Lakes. The lakes were not mapped in the model because they are classified as artificial by National Wetlands Inventory. However, they are assigned the value zero for the vertical distance to water variables (Figure 8.12.6.a and 8.12.6.b). Consequently, much of this high probability area is actually under water. Still a considerable area of high site potential surrounds the lakes where elevations are low and the terrain relatively smooth. Areas of more rugged terrain are classified as low site potential.
Along the Canadian border in north central St. Louis County, zones of high site potential follow lakeshores and are interconnected around Namakan, Mukooda, Johnson and Franklin lakes, and Lac La Croix. Along the Canadian border, in the northwest corner of Cook County, areas of high site potential occur around lakes and in areas of lower elevation and level terrain extending away from lakes. When high site potential occurs farther from water, the vertical distance to water is small.
Areas of high site potential are less extensive and more scattered in the eastern portion of the subsection, where they are associated with the shores of a large number of lakes. There are also sparse, scattered occurrences of high site potential in a subtle dendritic pattern throughout the eastern portion of the subsection. However, they correspond only weakly with stream locations.
In addition to the lakes mentioned above, Namakan and Crane lakes are classed as artificial in the National Wetlands Inventory and therefore were not mapped on this model.
8.12.2.2 Evaluation
The site probability model for the Border Lakes subsection performed very well. It is based on 16 variables (Table 8.12.1) representing topography, vegetation, soils and hydrology.
Table 8.12.1. Site Probability Model, Border Lakes Subsection.
Intercept |
No intercept created |
|
ln (nonsites/sites) |
0.8123 |
|
Variable |
Regression Coefficient |
Probability |
Direction to nearest water or wetland (sine) |
-0.5349057 |
100.0 |
Distance to aspen-birch |
-0.01083211 |
100.0 |
Distance to brushlands |
0.01119945 |
100.0 |
Distance to edge of nearest large lake |
-0.03340145 |
100.0 |
Distance to edge of nearest large wetland |
0.02325344 |
100.0 |
Distance to edge of nearest swamp |
0.09398995 |
100.0 |
Distance to hardwoods |
-0.006608629 |
100.0 |
Distance to nearest lake inlet/outlet |
0.01244774 |
87.1 |
Distance to nearest lake, wetland, organic soil or stream |
-0.1489754 |
100.0 |
Distance to sugar maple |
0.01142411 |
100.0 |
Prevailing orientation |
-0.006505563 |
100.0 |
Size of major watershed |
-0.001142482 |
100.0 |
Slope |
0.1960455 |
100.0 |
Surface roughness |
-0.04115506 |
100.0 |
Vertical distance to permanent water |
-0.01973561 |
100.0 |
Vertical distance to water |
-0.02090257 |
100.0 |
In this model, 88.54 percent of all modeled sites are in high/medium site potential areas, which make up only 18.88 percent of landscape (Table 8.12.2). This produces a strong gain statistic of 0.78676 (Table 8.6.11). A very large test population was available for this region, and the model predicted 76.62 percent of the test sites. The test gain statistic was 0.75463.
Table 8.12.2. Evaluation of Site Probability Model, Border Lakes Subsection.
Region (30 meter cells) |
Random Points |
Negative Survey Points |
Modeled Sites |
Test Sites |
||||||
# |
% |
# |
% |
# |
% |
# |
% |
# |
% |
|
Low |
7842559 |
75.57 |
1630 |
75.36 |
452 |
39.65 |
106 |
11.04 |
34 |
22.08 |
Medium |
489941 |
4.72 |
98 |
4.53 |
138 |
12.11 |
70 |
7.29 |
14 |
9.09 |
High |
1469965 |
14.16 |
304 |
14.05 |
546 |
47.89 |
780 |
81.25 |
104 |
67.53 |
Water |
500694 |
4.82 |
120 |
5.55 |
0 |
0 |
3 |
0.31 |
1 |
0.65 |
Steep Slopes |
74523 |
0.72 |
11 |
0.51 |
4 |
0.35 |
1 |
0.10 |
1 |
0.65 |
Mines |
0 |
0 |
0 |
0 |
0 |
0 |
0 |
0 |
0 |
0 |
Total |
10377682 |
100 |
2163 |
100 |
1140 |
100 |
960 |
100 |
154 |
100 |
The database included 960 sites that were not single artifacts. This is the second highest number of sites in the subsections modeled and warrants a higher level of confidence in the model. Two preliminary models using different halves of the database had 89 percent agreement (89 percent of the cells in the subsection were classified the same in both models). The Kappa statistic, which is adjusted for the amount of agreement expected by chance alone, for this model was 0.67215 (Table 8.6.11), much higher than average and the third highest in the state. The conditional Kappa statistics (Table 8.12.3) are lowest for the medium size potential zone, but this is less than 5 percent of the subsection area. This stellar performance must, however, be interpreted in light of the degree of survey bias in this subsection (Section 8.12.3). Increasing the number of sites for modeling may improve confidence in the model and model stability, particularly if future surveys are extended away water bodies into undersurveyed areas.
Table 8.12.3. Conditional Kappa Values for Site Probability Model, Border Lakes Subsection.
Class |
Ki |
Proportion Correct |
Low |
0.7531 |
0.9506 |
Medium |
0.1921 |
0.2325 |
High |
0.7494 |
0.7870 |
8.12.2.3 Interpretation
The Border Lakes site probability model is made up of 16 variables. Half of the variables are hydrologic in nature while the remaining are linked to vegetation (Table 8.12.4).
Table 8.12.4. Model Variable Statistics.
Border Lakes |
Modeled Sites |
Surveyed Areas |
Modeled Sites |
Sites in Low Prob. |
Neg. Survey Points |
Random Points |
||||||
Model Variable |
Coeff. |
Sign. |
Coeff. |
Sign. |
Mean |
S.D. |
Mean |
S.D. |
Mean |
S.D. |
Mean |
S.D. |
Prevailing orientation |
-0.264 |
0 |
-0.19 |
0 |
88.41 |
61.21 |
110.61 |
52.71 |
100.93 |
59.64 |
102.85 |
60.27 |
Size of major watershed |
0.246 |
0.124 |
-0.411 |
0 |
2114.07 |
531.32 |
1939.67 |
540.14 |
1404.29 |
259.59 |
2150.8 |
475.37 |
Size of minor watershed |
- |
- |
0.426 |
0 |
12246.4 |
4543.32 |
10941.5 |
4194.32 |
14215.41 |
5238.58 |
9548.1 |
4399.1 |
Slope |
0.079 |
0.006 |
0.04 |
0.581 |
2.79 |
2.85 |
3.45 |
4.33 |
3.49 |
3.07 |
3.26 |
3.3 |
Surface roughness |
0.068 |
0 |
-0.434 |
0 |
225.78 |
36.6 |
231.82 |
48.88 |
197.74 |
25.02 |
245.22 |
40.35 |
Direction to nearest water or wetland (sine) |
-0.018 |
0 |
-0.113 |
0 |
0.18 |
0.74 |
0.07 |
0.76 |
0 |
0.75 |
0.31 |
0.76 |
Distance to edge of nearest large lake |
-0.433 |
0 |
0.23 |
0 |
21.45 |
35.82 |
41.87 |
39.53 |
71.91 |
33.94 |
36.07 |
24.43 |
Distance to edge of nearest large wetland |
0.363 |
0 |
0.241 |
0 |
55.95 |
21.81 |
44.3 |
23.45 |
49.75 |
25.47 |
39.41 |
22.91 |
Distance to edge of nearest swamp |
0.321 |
0 |
0.186 |
0 |
16.11 |
7.55 |
12.29 |
10.34 |
13.48 |
8.19 |
10.62 |
7.94 |
Distance to nearest lake inlet/outlet |
-0.025 |
0.451 |
0.31 |
0 |
38.06 |
23.17 |
39.33 |
27.98 |
58.87 |
29.66 |
36.04 |
17.37 |
Distance to nearest lake, wetland, organic soil, or stream |
-0.418 |
0 |
0.018 |
0.235 |
5.15 |
8.71 |
10.92 |
10.68 |
12.11 |
8.47 |
8.16 |
6.96 |
Vertical distance to permanent water |
-0.031 |
0 |
-0.197 |
0 |
1.84 |
16.68 |
10.26 |
39.61 |
14.46 |
31.11 |
32.57 |
47.75 |
Vertical distance to water |
-0.034 |
0 |
- |
- |
1.65 |
16.99 |
10.38 |
39.65 |
14.34 |
31.06 |
30.53 |
45.56 |
Distance to aspen-birch |
0.177 |
0 |
0.098 |
0 |
35.41 |
26.06 |
30.99 |
24.27 |
34.49 |
22.65 |
29.86 |
24.76 |
Distance to brushlands |
0.076 |
0 |
0.298 |
0 |
416.57 |
31.1 |
411.91 |
31.88 |
425.13 |
22.99 |
405.89 |
39.26 |
Distance to hardwoods |
-0.086 |
0.927 |
0.144 |
0 |
150.3 |
70.11 |
161.75 |
69.6 |
198.77 |
48.81 |
149.16 |
70.55 |
Distance to river bottom forest |
- |
- |
0.25 |
0 |
332.56 |
36.24 |
326.19 |
36.02 |
330.86 |
21.71 |
322.61 |
46.54 |
Distance to sugar maple |
0.209 |
0 |
- |
- |
97.93 |
31.41 |
89.64 |
32.81 |
78.66 |
22.98 |
88.69 |
32.04 |
Distance to well-drained soils |
- |
- |
-0.024 |
0.209 |
1.81 |
7.09 |
2.08 |
7.02 |
2.25 |
7.03 |
1.59 |
5.71 |
Frequency counts |
960 |
2230 |
960 |
106 |
1140 |
2163 |
||||||
See Interpretation section for discussion of the statistics:
Coeff. = correlation
coefficient
Sign. = significance of the Mann-Whitney U test
S.D. = standard deviation
Distances and areas are expressed in square
roots of meters. Square the values in the table to get actual values.
8.12.2.3.1 Differences between Modeled Sites and Random Points for Individual Model Variables
Four of the 16 model variables, all hydrologic, have coefficients of 0.3 and higher. Sites in the Border Lakes subsection tend to be located nearer large lakes (Figure 8.12.10c) or lakes, wetlands, organic soils, or streams (Figure 8.12.11c) than would be expected by chance. They are further from swamps (Figure 8.12.11a), and large wetlands (Figure 8.12.10b). Difference between sites and random points for vertical distance to permanent water (Figure 8.12.6.a and Figure 8.12.11d) and vertical distance to water (Figure 8.12.6.b and Figure 8.12.12a) are large, even though their correlation coefficients are quite small. Clearly, known sites in this region are at elevations only slightly above the nearest water body. Sites also tend towards a less northerly aspect (Figure 8.12.9a) and are situated more to the north of water bodies (Figure 8.12.10b) and on less steep slopes (Figure 8.12.9d) and less rugged terrain (Figure 8.12.10a). They are further from aspen-birch (Figure 8.12.12b), brushlands (Figure 8.12.12c), and sugar maple (Figure 8.12.13b). The largest concentration of sugar maple is in the southcentral portion of the subsection, northeastern St. Louis County, where few surveys have been recorded (Figure 8.12.5a). Brushlands are outside the subsection , but near the same area.
The Mann-Whitney U test (Table 8.12.4) indicates that there is a significant difference, at the 0.05 level, between sites and random points on these 13 variables to consider them as being drawn from different populations. The three model variables that are not significant are size of major watershed (Figure 8.12.9b), distance to nearest lake inlet/outlet (Figure 8.12.11b), and distance to hardwoods (Figure 8.12.12d) .
8.12.2.3.2 Relationships between Variable Pairs
Table 8.12.5 is a correlation matrix of the variables used in the site model. Sixteen of the variable-pairs have values of 0.5 or greater. One pair of variables are has nearly identical distributions. Vertical distance to permanent water and vertical distance to water have a correlation coefficient of 0.99. Another pair, distance to nearest large lake and distance to nearest lake, wetland, organic soil or stream are very highly correlated (0.87). Because the members of each of the two pairs are quite similar, they exhibit similar relationships to the other variables.
Distance to nearest large lake and distance to nearest lake, wetland, organic soil or stream are negatively associated with size of major watershed and surface roughness but positively related to distance to nearest lake inlet/outlet. This can be interpreted to mean that water bodies, particularly large lakes, occur in large watersheds with associated with high degrees of surface roughness and a greater number of lake inlet/outlets than would be expected by chance. Likewise, areas of high surface roughness tend to occur near lake inlet/outlets and in large watersheds. As surface roughness increases, distance to hardwoods decreases (-0.68) but distance to sugar maple (Figure 8.12.5.a) increases. The negative relationship between distance to hardwoods and distance to sugar maples may be the result of low resolution mapping of these variables. Steep slopes, as expected, occur in areas high above water or permanent water.
Table 8.12.5. Variable Correlation Matrix.
Border Lakes |
Prevailing orientation |
Size of major watershed |
Slope |
Surface roughness |
Direction to nearest water or wetland (sine) |
Distance to edge of nearest large lake |
Distance to edge of nearest large wetland |
Distance to edge of nearest swamp |
Prevailing orientation |
1 |
|||||||
Size of major watershed |
0.05 |
1 |
||||||
Slope |
-0.26 |
0.02 |
1 |
|||||
Surface roughness |
-0.06 |
0.5 |
0.34 |
1 |
||||
Direction to nearest water or wetland (sine) |
0.25 |
0.28 |
-0.18 |
0.1 |
1 |
|||
Distance to edge of nearest large lake |
-0.05 |
-0.72 |
0 |
-0.56 |
-0.3 |
1 |
||
Distance to edge of nearest large wetland |
0 |
-0.04 |
0.14 |
0 |
-0.09 |
0.05 |
1 |
|
Distance to edge of nearest swamp |
0.02 |
-0.17 |
-0.01 |
-0.22 |
-0.06 |
0.13 |
0.28 |
1 |
Distance to nearest lake inlet/outlet |
-0.03 |
-0.49 |
-0.07 |
-0.6 |
-0.16 |
0.53 |
0.16 |
0.27 |
Distance to nearest lake, wetland, organic soil, or stream |
-0.01 |
-0.72 |
-0.02 |
-0.57 |
-0.29 |
0.87 |
0.1 |
0.25 |
Vertical distance to permanent water |
-0.13 |
0.23 |
0.57 |
0.43 |
-0.15 |
-0.22 |
-0.01 |
-0.13 |
Vertical distance to water |
-0.11 |
0.23 |
0.57 |
0.43 |
-0.16 |
-0.22 |
-0.01 |
-0.14 |
Distance to aspen-birch |
-0.03 |
0.01 |
0.1 |
-0.21 |
0.02 |
0.03 |
0.36 |
0.19 |
Distance to brushlands |
0.02 |
-0.26 |
0.04 |
0.19 |
-0.06 |
0.17 |
0.33 |
0.1 |
Distance to hardwoods |
-0.05 |
-0.5 |
0.03 |
-0.68 |
-0.17 |
0.4 |
0.12 |
0.18 |
Distance to sugar maple |
0.01 |
0.3 |
-0.04 |
0.56 |
0.11 |
-0.31 |
0.1 |
-0.12 |
Distance to nearest lake inlet/outlet |
Distance to nearest lake, wetland, organic soil, or stream |
Vertical distance to permanent water |
Vertical distance to water |
Distance to aspen-birch |
Distance to brushlands |
Distance to hardwoods |
Distance to sugar maple |
|
Prevailing orientation |
||||||||
Size of major watershed |
||||||||
Slope |
||||||||
Surface roughness |
||||||||
Direction to nearest water or wetland (sine) |
||||||||
Distance to edge of nearest large lake |
||||||||
Distance to edge of nearest large wetland |
||||||||
Distance to edge of nearest swamp |
||||||||
Distance to nearest lake inlet/outlet |
1 |
|||||||
Distance to nearest lake, wetland, organic soil, or stream |
0.54 |
1 |
||||||
Vertical distance to permanent water |
-0.21 |
-0.23 |
1 |
|||||
Vertical distance to water |
-0.21 |
-0.23 |
0.99 |
1 |
||||
Distance to aspen-birch |
0.22 |
0.03 |
0.01 |
0.02 |
1 |
|||
Distance to brushlands |
0.05 |
0.13 |
-0.05 |
-0.05 |
0.19 |
1 |
||
Distance to hardwoods |
0.4 |
0.45 |
-0.17 |
-0.17 |
0.18 |
-0.23 |
1 |
|
Distance to sugar maple |
-0.27 |
-0.33 |
0.1 |
0.09 |
-0.02 |
0.39 |
-0.53 |
1 |
Refer to "Relationships between variable pairs" for interpretation of the table values.
8.12.2.3.3 Sites in Low Probability Areas
Sites in the low site probability areas are distinct in many ways from the total population of modeled sites (Table 8.12.4). They are similar in distribution to all modeled sites only for five variables: size of major watershed, direction to nearest water or wetland, distance to nearest lake inlet/outlet, vertical distance to water, and vertical distance to permanent water . Their mean values for four other variables are approximately midway between those for random points and all modeled sites. The remaining eight variables place the sites in low site potential areas nearest random points.
In five of these cases, the mean random point values fall between those of all modeled sites and sites in low potential areas. These variables best discriminate between the two groups of sites. Sites in low potential areas have a more northern exposure, are on steeper slopes, and are further from the nearest large lake and nearest lake, wetland, organic soil, or stream than all modeled sites. Such locations indicate they are more likely to be temporary use sites than long-term habitations.
Of the 106 sites in low site potential areas, one is a quarry, one an earthwork, three are rock art, 44 are artifact scatters, and 57 are lithic scatters. If the model predicted all site types equally well, 11.04 percent of each site type should be found in the low probability areas. Lithic scatters are slightly underrepresented in low site potential areas, where 9.66 percent of all lithic scatters are found. All other site types are somewhat overrepresented, with low probability areas containing 13.66 percent of artifact scatters, 25 percent of quarry sites, 14.28 percent of mounds/earthworks, and 20 percent of rock art. More surveys away from water may help clarify the environmental components of these site types.
8.12.2.3.4 Relationships between Cultural Context, Descriptive, or Settlement Variables and Site Potential
Table 8.12.6 presents the results of analyzing the distribution of sites in the three site potential classes by three archaeological variables. Unlike most other subsections, sites with Archaic occupations occur somewhat more commonly in high site potential areas compared to sites lacking these components. Similarly, sites lacking pottery are also more likely to be in high site potential areas than those containing ceramics. Finally, single component sites are less likely to occur in high site potential areas vis a vis multi-component sites. However, the Chi-square tests indicate that none of the relationships is significant at the 0.05 level.
Table 8.12.6. Summary of Bivariate Relationships between Three Dichotomous Archaeological Variables and Three Areas of Site Potential, Border Lakes (Site Probability Model).
Low Potential |
Medium Potential |
High Potential |
Total |
Chi-square Test |
|||||||
Dichotomous Variable |
N |
% |
N |
% |
N |
% |
N |
% |
value |
df |
p-value |
All Modeled Sites |
106 |
11.6 |
70 |
7.0 |
780 |
81.3 |
954 |
100.0 |
- |
- |
- |
Archaic |
2 |
16.7 |
0 |
0.0 |
10 |
83.3 |
12 |
100.0 |
1.78 |
2 |
0.41 |
Not Archaic |
25 |
14.1 |
23 |
13.0 |
129 |
72.9 |
177 |
100.0 |
|||
Aceramic |
2 |
15.4 |
0 |
0.0 |
11 |
84.6 |
13 |
100.0 |
1.94 |
2 |
0.38 |
Not Aceramic |
25 |
14.2 |
23 |
13.1 |
128 |
72.7 |
176 |
100.0 |
|||
Single Component |
24 |
16.3 |
19 |
12.9 |
104 |
70.7 |
147 |
100.0 |
2.94 |
2 |
0.23 |
Not Single Component |
3 |
7.1 |
4 |
9.5 |
35 |
83.3 |
42 |
100.0 |
|||
8.12.3 Survey Probability Model
8.12.3.1 Description
Zones of high survey potential are concentrated in the northwestern corner of the Border Lakes subsection, within the present-day Voyageurs National Park, and around Rainy Lake. They are on smooth terrain, whether they are near or far from water bodies (Figure 8.12.7). The concentration of surveys in the northwestern part of the subsection is attributable to federal agency activities. There are over 1000 negative survey points within the vicinity of the Voyageurs National Park. The eastern tip of Kabetogama peninsula alone has as many as 150 surveyed points within 37 sq. km, almost 4 surveyed points per square km. That surpasses survey frequency in the rest of the subsection by many times. This biased survey pattern undoubtedly prevented consideration of all types of environments in the development of the model. In the remainder of the subsection, small areas of high survey potential are found adjacent to lakes and on smooth terrain.
8.12.3.2 Evaluation
The survey probability model is based on 17 variables (Table 8.12.7) representing topography, vegetation, soils and hydrology. It predicted surveyed places very well, suggesting strong bias in the location of surveys in the subsection.
Table 8.12.7. Survey Probability Model, Border Lakes Subsection.
Intercept |
1.085 |
|
ln (nonsites/sites) |
-0.030505438 |
|
Variable |
Regression Coefficient |
Probability |
Direction to nearest water or wetland (sine) |
-0.3540385 |
100.0 |
Distance to aspen-birch |
-0.01133333 |
100.0 |
Distance to brushlands |
0.04027300 |
100.0 |
Distance to edge of nearest large lake |
-0.02052092 |
100.0 |
Distance to edge of nearest large wetland |
0.01912088 |
100.0 |
Distance to edge of nearest swamp |
0.07416973 |
100.0 |
Distance to hardwoods |
-0.00510560 |
100.0 |
Distance to nearest lake inlet/outlet |
0.01470742 |
100.0 |
Distance to nearest lake, wetland, organic soil or stream |
-0.1260467 |
100.0 |
Distance to river bottom forest |
-0.02172435 |
81.4 |
Distance to well-drained soils |
-0.03571622 |
100.0 |
Prevailing orientation |
-0.003849223 |
100.0 |
Size of major watershed |
-0.001457547 |
100.0 |
Size of minor watershed |
0.00004223934 |
100.0 |
Slope |
0.1525837 |
100.0 |
Surface roughness |
-0.03420938 |
100.0 |
Vertical distance to permanent water |
-0.008117256 |
100.0 |
In this model, 82.73 percent of all surveyed places are in high/medium survey potential areas, which make up 18.89 percent of the landscape (Table 8.12.8). This produces a strong gain statistic of 0.77167 (Table 8.6.14).
Table 8.12.8. Evaluation of Survey Probability Model, Border Lakes Subsection.
Region (30 meter cells) |
All random points |
All negative survey points |
All sites |
All sites and negative survey points |
||||||
# |
% |
# |
% |
# |
% |
# |
% |
# |
% |
|
Low |
7842144 |
75.57 |
1635 |
75.59 |
166 |
14.56 |
211 |
19.36 |
377 |
16.91 |
Medium |
490054 |
4.72 |
103 |
4.76 |
60 |
5.26 |
126 |
11.56 |
186 |
8.34 |
High |
1470267 |
14.17 |
294 |
13.59 |
910 |
79.82 |
749 |
68.72 |
1659 |
74.39 |
Water |
500694 |
4.82 |
120 |
5.55 |
0 |
0 |
3 |
0.28 |
3 |
0.13 |
Steep Slopes |
74523 |
0.72 |
11 |
0.51 |
4 |
0.35 |
1 |
0.09 |
5 |
0.22 |
Mines |
0 |
0 |
0 |
0 |
0 |
0 |
0 |
0 |
0 |
0 |
Total |
10377682 |
100 |
2163 |
100 |
1140 |
100 |
1090 |
100 |
2230 |
100 |
This region exhibits a very strong degree of survey bias. The survey probability model was able to predict surveyed places with almost the same precision than the site probability model was able to predict sites. Except for the northwest portion of this subsection, sites have been found throughout the limited area surveyed. The large numbers of sites (1090) and negative survey points (1140) in this region are quite closely confined to the margins of lakes and streams. It is likely that most surveys were conducted by canoe, as that is the main form of transportation through much of the area. Although Border Lakes has the fourth highest survey frequency (0.24 surveys per square kilometer) and second highest site frequency (0.12 known sites per square kilometer) in the state, these figures are clearly deceptive.
The database included a total of 2230 surveyed places. Two preliminary survey probability models had 89 percent agreement. The Kappa statistic for these models was 0.72217 (Table 8.6.14). This is most stable survey probability model in the state, confirming that the survey bias mapped is authentic. The conditional Kappa statistics (Table 8.12.9) are lowest for the medium site potential zone, but this is less than 5 percent of the subsection area.
Table 8.12.9. Conditional Kappa Values for Survey Probability Model, Border Lakes Subsection.
Class |
Ki |
Proportion Correct |
Low |
0.8114 |
0.9529 |
Medium |
0.4154 |
0.4739 |
High |
0.8074 |
0.8363 |
This subsection is an excellent example of how survey bias can result in deceptively good statistical results for a site probability model. High gain statistics and high model stability alone do not make a good model. It is critical that these results be evaluated with respect to the distribution of all the relevant data. This is the intent of the survey probability model.
8.12.3.3 Interpretation
The survey probability model for the Border Lakes subsection is composed of 17 variables (five topographic, seven hydrologic, three vegetative, and one soils). These include fourteen variables from the site probability model, as can be expected from models with such similar geographic patterns.
Four survey probability model variables have correlation coefficients of 0.3 and above (Table 8.12.4). These relationships indicate that surveys have been conducted largely in smaller major watersheds (Figure 8.12.9b) but larger minor watersheds (Figure 8.12.9c), in areas with less surface roughness (Figure 8.12.10a), and further from lake inlets/outlets (Figure 8.12.11b) than would be expected by chance. Other variables indicate that surveys have been farther from large lakes (Figure 8.12.10c), large wetlands (Figure 8.12.10d), river bottom forests (Figure 8.12.13a)and vertically closer to permanent water (Figure 8.12.11d) than random points.
The results of the Mann-Whitney U tests (Table 8.12.4) are significant at the 0.05 level for all variables except slope (Figure 8.12.9d), distance to nearest lake, wetland, organic, or stream (Figure 8.12.11c), and distance to well-drained soils (Figure 8.12.13c). Thus, surveys have been conducted in areas that are significantly different from random points on a large number of environmental variables. These differences are great enough that the surveyed and random points can be considered to have been drawn from separate populations.
8.12.4 Survey Implementation Model
The survey implementation model for Border Lakes (Figure 8.12.8) reflects the strong degree of survey bias in the subsection in that 70.77 percent of the total area is classified as unknown (Table 8.12.10). The low and possibly low site probability areas occupy only 4.8 percent of the landscape. This clearly illustrates the degree of survey bias discussed above, sites are likely to be found in nearly all of the kinds of environments surveyed.
Table 8.12.10. Evaluation of Survey Implementation Model, Border Lakes Subsection.
Region (30 meter cells) |
Random Points |
Negative Survey Points |
Single Artifacts |
Sites |
||||||
# |
% |
# |
% |
# |
% |
# |
% |
# |
% |
|
Unknown |
7344499 |
70.77 |
1528 |
70.64 |
163 |
14.3 |
10 |
7.69 |
73 |
7.6 |
Possibly Low |
185494 |
1.79 |
33 |
1.53 |
52 |
4.56 |
0 |
0 |
7 |
0.73 |
Low |
312566 |
3.01 |
69 |
3.19 |
237 |
20.79 |
2 |
1.54 |
26 |
2.71 |
Suspected Medium |
265691 |
2.56 |
58 |
2.68 |
1 |
0.09 |
13 |
10 |
34 |
3.54 |
Possibly Medium |
63589 |
0.61 |
10 |
0.46 |
3 |
0.26 |
1 |
0.77 |
2 |
0.21 |
Medium |
160661 |
1.55 |
30 |
1.39 |
134 |
11.75 |
4 |
3.08 |
34 |
3.54 |
Suspected High |
231954 |
2.24 |
49 |
2.27 |
2 |
0.18 |
8 |
6.15 |
73 |
7.6 |
Possibly High |
240971 |
2.32 |
60 |
2.77 |
5 |
0.44 |
13 |
10 |
103 |
10.73 |
High |
997040 |
9.61 |
195 |
9.02 |
539 |
47.28 |
79 |
60.77 |
604 |
62.92 |
Water |
500694 |
4.82 |
120 |
5.55 |
0 |
0 |
0 |
0 |
3 |
0.31 |
Steep Slopes |
74523 |
0.72 |
11 |
0.51 |
4 |
0.35 |
0 |
0 |
1 |
0.1 |
Mines |
0 |
0 |
0 |
0 |
0 |
0 |
0 |
0 |
0 |
0 |
Total |
10377682 |
100 |
2163 |
100 |
1140 |
100 |
130 |
100 |
960 |
100 |
No Landscape Suitability Models have been developed for this subsection. The Rainy River model (Section 12.5) is just to the west of the Border Lakes subsection. The potential for buried sites in Border Lakes should be considered where lacustrine or organic soils are present and in the lower reaches of stream valleys.
8.13 Chippewa Plains
8.14 Coteau Moraines / Inner Coteau
8.15 Glacial Lake Superior Plain/Northshore Highlands/ Nashwauk
Uplands
8.16 Hardwood Hills
8.17 Laurentian Highlands
8.18 Littlefork-Vermilion Uplands
8.19 Mille Lacs Uplands
8.20 Minnesota River Prairie
8.21 Oak Savanna
8.22 Pine Moraines & Outwash Plains
8.23 Red River Prairie
8.24 Rochester Plateau
8.25 St. Croix Moraines and Outwash Plains (Twin Cities Highlands)
8.26 St. Louis Moraines/ Tamarack Lowlands
8.27 Conclusion
References
The Mn/Model Final Report (Phases 1-3) is available on CD-ROM. Copies may be requested by visiting the contact page.

Acknowledgements
MnModel was financed with Transportation Enhancement and State Planning and Research funds from the Federal Highway Administration and a Minnesota Department of Transportation match.
Copyright Notice
The MnModel process and the predictive models it produced are copyrighted by the Minnesota Department of Transportation (MnDOT), 2000. They may not be used without MnDOT's consent.