
Quick Links
Chapters
- Management Summary
- Research Design & Time Line
- Environment & Native American Culture
- GIS Design
- Archaeological Database
- Archaeological & Environmental Variables
- Model Development & Evaluation
- Model Results & Interpretation
- Project Applications
- Model Enhancements
- Model Implementation
- Landscape Suitability Models
- Summary & Recommendations
Appendices
- Archaeological Predictive Modeling: An Overview
- GIS Standards & Procedures
- Archaeology Field Survey Standards, Procedures & Rationale
- Archaeology Field Survey Results
- Geomorphology Survey Profiles, Sections, & Lists
- Building a Macrophysical Climate Model for the State of Minnesota
- Correspondence of Support for Mn/Model
- Glossary
- List of Figures
- List of Tables
- Acknowledgments
Appendix B
MN/Model GIS Standards and Procedures
by Elizabeth Hobbs
Appendix B Table of Contents
B.1 Introduction
B.2 GIS Standards
B.3 System Considerations
B.4 Quality Control
B.5 Metadata
B.6 Data Sources
B.7 Data Conversion
B.8 Operationalizing Variables
B.9 Modeling Procedures
B.10 Known Errors
B.11 Phase 4 Methods
References
This Standards and Procedures manual documents the established standards and the procedures that were followed in creating, analyzing, and displaying geographic data used in Mn/Model. The standards set by the GIS industry and the GIS community in Minnesota state government were closely adhered to. Some standards had been previously established by MnDOT while others were specifically developed for this project.
GIS standards determine the quality of the data developed and how readily it can be used by others. Consistent GIS procedures are essential for ensuring that each database is compatible state-wide. The first five sections of this manual focuses primarily on standards and related issues. Sections B.6 through B.9 detail the procedures used in Phases 1 through 3 of Mn/Model.
Any archaeological predictive model must be informed by the history of the environment and culture being modeled. Even though an inductive research design is used in Mn/Model, expert knowledge and theory are incorporated into the models through the selection of the sites included in the archaeological database and the independent environmental variables used for modeling.
Maintaining established standards in the development of data, variables, and models will insure correct geographic registration, relationships between datasets, and maintenance of data quality. Without adherence to standards, the value of the data and models produced will be limited.
B.2.1 Software and Hardware
Most GIS processes and analyses were performed with ARC/INFO v. 7.1.2 and ARC/INFO GRID (from ESRI) running on Sun Sparcstation, Ultra, and Ultra2 UNIX workstations running Solaris 2.3, and on a Silicon Graphics Indigo workstation running IRIX. Many procedures have been automated by AMLs (scripts in Arc Macro Language).
ArcView software (both UNIX and Windows versions 2.1 and 3.0, 3.0a, also from ESRI) was used extensively for quality control, data display, and database manipulation. Some analyses were done in the Spatial Analyst extension of ArcView 3 running in Windows. These were principally done as an alternative to processes which that had been done in GRID, as a way of reducing pressure on the UNIX workstations.
EPPL7 was used to convert data received in EPPL7 format to ERDAS format, for subsequent conversion to ARC/INFO GRID. AutoCAD was used for digitizing. ArcCAD and PC Arc/Info were used for creating coverages from AutoCAD files.
S-Plus statistic software (UNIX version 3.4) was used to perform modeling (logistic regression), create variable histograms, perform univariate analyses, and provide summary statistics.
B.2.2 Geographic Coordinates
The Minnesota Department of Transportation (MnDOT) standard is UTM zone 15 (extended to include portions of the state in zones 14 or 16), NAD83, Spheroid GRS1980 with no shift. All data used in Mn/Model conform to this standard. The ARC/INFO PROJECT command using the NADCON options was used for conversion to the correct coordinates system. Standard projection files were created to support projection. GRID projection is time-consuming, with each statewide layer taking several hours to process.
B.2.3 Map Units
Horizontal units are meters. This is the MnDOT standard. Vertical units (elevation) are feet. Feet were selected so that data could be maintained in integer grids without unnecessary loss of precision.
B.2.4 Grid Resolution
A 30 meter resolution was selected to be consistent with the 7.5 minute DEMs and a source scale of 1:24,000. We recommend that this resolution not be altered in the future. Some will argue that grid cell size should be the same as in the source data. We had source data with grid cells varying from 5 meters to 100 meters. We tried combining grids of different resolution in the same analysis. Although it is possible, it was not as straightforward as it might seem. For instance, when using the SAMPLE function to determine the values of the grid layers at each parcel sampled, the parcel cells must be the same size of the cells in the layers being sampled. Otherwise parcels are dropped from the output if they do not coincide with the center of the larger cell in the environmental layer. Consequently, we determined that regridding all source data to the same cell size was necessary.
Thirty meters is appropriate for several reasons. This is a resolution that is appropriate for data mapped at a scale of 1:24,000. Much of the data used falls into that category. The 1:24,000 DEMs are mapped at an approximately 30 meter horizontal resolution. The MnDOT BaseMap is digitized from 1:24,000 quads. The National Wetlands Inventory is mapped on, then digitized from, 1:24,000 quads. More data at that scale will be available in the future.
Some may desire a smaller cell size for a higher resolution model. However, most data sources do not support the level of detail implied in a smaller cell size. For instance, the scale of the soil survey source map for Nicollet County is 1:15,840. It came to us with a 5 meter cell size. For this source scale, a cell size of no less than 16 meters would be appropriate. Even if data were available at that scale for some counties, the number of archaeological sites within one typical Minnesota county would not be adequate to support a strong statistical model. Moreover, storage and processing requirements will increase exponentially with a reduction in cell size.
B.2.5 Data Standards
A number of standards were established for the spatial databases used in developing the model. Some standards apply to a single database and are documented in the metadata. Others apply across databases. Not all data received from outside sources conformed to these standards. In these cases, only the attributes used for modeling were edited to conform.
B.2.5.1 Standardized File Names and Directory Structures
So that one set of instructions or AMLs could be easily applied to any part of the state, it was important that file names and directory structures be consistent throughout the project. Mn/Model working directories were organized by geographic region. For county level data, there was a top level 'Counties' directory. Below that were 87 individual county directories, named by county names. Each county directory contained three subdirectories:
- Covers: This subdirectory contained all of the coverages available for the county.
- Grids: This subdirectory contained all of the grids for the county. In some cases, coverages and their corresponding grids may have the same name, but are distinguished by their path.
- Shapes: This subdirectory contained shapefiles for the county.
There were similar directories for each region and subregion, with each individual region and subregion directory containing the same subdirectories and many of the same files as the county subdirectories. There was also a State directory with covers, grids, and shapes subdirectories. With this directory structure, we were able to use the same names for each GIS dataset, no matter what its geographic extent.
B.2.5.2 Common Field Definitions
These enable relates and joins between tables. In some GIS and database software, for two tables to be related or joined, they must contain a common field. Not only must the values be the same, but the name of the field, the type of data in the field, and the width (number of characters or digits in the field) must also match. For instance, the fields defined below would carry the same data, but could not be joined because they are differently defined:
| Name | Type | Width |
| TOWNSHIP | Character | 8 |
| TOWNSHIP | Integer | 6 |
| TOWNSHIP | Character | 6 |
| TOWNSHIP | Integer | 8 |
For this reason, it is important to verify field definitions in existing databases, from the metadata, before creating new databases.
Special rules were developed to represent Foth & VanDyke upland and river valley geomorphology attributes that came in Excel and Word Perfect spreadsheets. Table fields were redefined to remove special characters from field names and to fit column width. These rules are discussed in the Section B.7.5.5.
B.2.5.3 Consistent Methods of Recording Data
As much consistency as possible was maintained when recording data in fields. In recording a measurement, the same units (feet, meters, acres, hectares) were used throughout.
For categorical data within a database, or where the same information is contained in more than one database, a limited number of valid values were defined. This insured that the results of queries were complete and that tables joined properly. For instance, data recorded in one record as "historic building present", would not be recorded as "historic building" in another record. To the human mind these are equivalent statements, but to the computer they are completely different. Lists of the valid values for each field were developed and adhered to it. These values are contained in the metadata for each layer. When new values are added, they must not be redundant and must be added to the metadata list. Consistency greatly simplifies the process of combining databases for analysis. It also simplifies investigation for future researchers who will not have to keep track of so many different data coding and entry schemes. Because software may be case sensitive, character fields added as part of this project were standardized on all upper case.
In many cases numeric codes were used for finite ranges of data values. This saves typing and reduces typos. Also, numeric codes were required for converting data to grids. Numeric values can be converted to consistent text strings later as needed in a batch process. We recommend the following codes for some commonly occurring fields:
- COUNTY: Use the three digit county FIPS code from the list provided below. This code is established by the US government and is used by them nationwide. Many tables include the county FIPS code, so it is very useful as a join item. If this is a separate field, it should be defined as a character field (C3), called COUNTY. Leading zeros must be included. The three digit code can also be included as part of an integer field (for instance, as the first three digits of a unique parcel number used as a value in a VAT). You may also wish to have a separate field for the county name. FIPS codes for Minnesota counties are provided in Table B.1.
- TOWNSHIP: Three digit township number, with leading zeros if needed. If it is a separate field, it should be defined as a character field (C3), called TOWNSHIP. All townships in Minnesota are north of the survey base lines, so no directional indicator is needed.
- RANGE: Two digit range number, using leading zeros as needed. In a character field, the two digits should be followed by a character (E or W) indicating direction from the principal meridian. In an integer field, use the integer 1 to indicate east, 2 to indicate west. If it is a separate field, it should be defined as a character field (C3), called RANGE.
- QT_QT: Eight digit quarter quarter section (40 acres). If it is a separate field, it should be defined as a character field, called QT_QT. Code quarter quarter sections according to the example shown below. This is a standard used by the Minnesota State Planning Agency, Land Management Information Center.
22 21 12 11
23 24 13 14
32 31 42 41
33 34 43 44
In this system, the first digit is the quarter section, the second digit is the quarter of the quarter section. A field defined as QT_QT C8 could hold designators for up to four quarter quarter sections. If there is more than one quarter quarter represented in whole or in part within a study parcel, you could include all pertinent numbers. Example: 2221243134 would represent four quarter quarters in the shape of the digit seven.
B.2.5.4 Unique IDs
For most GIS purposes, each geographic feature in a vector database must have a unique ID number and be represented by a single record in the database. This is sometimes violated by data brought in from non-geographic database systems. It was an issue in the conversion of the archaeological database to GIS format.
Within the GIS, each archaeological site must have a single record in the primary database with an ID number. This ID must be unique within the state, as the project is statewide in scope. Existing site ID numbers were unique within a county, but not within the state. Unique IDs were achieved by adding the county FIPS code to the beginning of the site ID number.
Sometimes multiple records were kept by SHPO for a site or survey parcel because it covered more parts of a single section or more quarter quarter sections than could be recorded in the primary database. In such cases, the section and quarter quarters were recorded for the most important part of the site as determined by density, nature of artifacts, or other archaeological determinants. The other sections and/or quarter-quarter sections involved could be listed in a separate companion database, to be linked to the primary database via the site or survey area ID. This companion database could have multiple records with the same site or survey ID.
B.2.5.5 Grid Data Stored as Integers
Because Mn/Model is a statewide model, and because many data layers and variables were considered in its development, the GIS data were very demanding of system resources. Floating point grids were converted to integer grids to conserve disk space and speed up processing. For variables that have very high values and a large range of values (such as Euclidean distances) a simple conversion suffices. However, if variables have very low values and a narrow range of values, you may wish to consider whether to multiply them by a constant before converting to integer grids.
B.2.5.6 ASCII Format
Database files is in ASCII format were designed or edited to conform to the following specifications:
- The file must be comma delimited.
- There cannot be commas within a string in the file.
- No quotes around strings (character fields).
- Two consecutive commas denote a blank value.
- The first line of the file must contain a header line (names of the fields).
Conformance to this format allowed the data to be reliably imported into ArcView as a table.
B.2.5.7 Clipping Coverages and Grids
Consistent state, county, and regional boundaries must be established for clipping spatial data for the project. This avoids errors along borders when interpreting relationships between layers. For Mn/Model, several clipping coverages were established. These were:
BORDER: County boundary, provided by MnDOT. The source scale of this coverage was presumed to be 1:250,000. We received no metadata for this coverage. It predated the MnDOT BaseMap. We did not switch to county boundaries from the BaseMap coverage when that became available because we wanted newly developed layers to overlay exactly those previously created. However, this change will be made for Phase 4.
BUFF1000: County or region boundaries buffered by 1000 meters. The 1000 meter buffer was used to ensure that features such as lakes that were located across a boundary line, but within one kilometer, would be considered when computing distances to resources. Without the buffer, computations for cells near county boundaries might be misleading. The closest lake to a cell might actually be in the next county.
REGIONS: Archaeological regions (statewide coverage) for Minnesota as defined by Scott Anfinson, Minnesota State Historic Preservation Office. These were digitized from a very low resolution source and attributes were added. These regions were used to clip and organize data for modeling in Phases 1 and 2.
REG#_BUF (Phases 1 and 2): The REGIONS statewide coverage split into separate coverages and buffered 1000 meters. The # stands for the region number. As in BUFF1000, the buffer allows features with one kilometer of the region's boundary to be considered for modeling.
ECOREG (Phase 3): Statewide Ecological Classification System (ECS) regions provided by Mn/DNR. The attribute REG is the region number and SUBREG is the subsection number. This coverage replaced REGIONS. Data confidence and model stability information were added to ECOREG.PAT in Phase 3.
REGGRID: ECS region and subsection grids buffered with 30 meters around the border. The 30 meter buffer is intended to avoid gaps between grids of adjacent regions.
Q024: Statewide boundaries of 7.5 minute quadrangles. This coverage was obtained by MnDOT. It was used to create mask grids in the creation of elevation data (Section B.7.3) and to hold information about data availability and quality for layers distributed in quadrangle tiles.
No data were acquired for outside of Minnesota's boundaries. Where buffered coverages and grids extend into neighboring states, those portions of the spatial data will contain NODATA or, where necessary, extrapolated values (see Section B.2.5.7). The values of some derived variables along state borders may consequently be inaccurate.
Depending on how data sources are tiled, there may be gaps within grid data when tiles are assembled into county, regional, or state coverages. When grids are clipped by buffered border coverages, there are always gaps between the state border and the buffer boundary. A routine has been added to the AMLs that checks for gaps in grids, using the ISNULL function, and to repair them, using NIBBLE.
B.3.1 File Management
File management is important for processing as well as storage. GRID procedures require a large amount of free hard drive space for storing temporary files. At any given time approximately 32 to 52 GB of hard drive space were dedicated to this project during the first three phases. Of this, approximately 6.5 GB stored county data, from which regional data grids were assembled. Another 1-2 GB held statewide grids and coverages which were being processed or used for reference. About 40 GB held the regional grids, both data layers and the variables derived from these, keeping about 4 GB available for temporary files created during processing.
Nevertheless, it was necessary to manage their contents very carefully. Maintaining this free hard drive space required constant vigilance. The full assortment of derived variables could not be kept available for each region. When modeling of a region was complete, variables that were not selected as among the top 30 were removed to make room for modeling the next region. At times, these variables turned up in later models and had to be restored. Backing up and restoring data are important and time-consuming tasks that must be figured in to the modeling process.
File management becomes extremely important when deriving variables. Most of the derived variables generate floating point grids. These require a lot of disk space for storage. We converted these floating point grids to integer grids and removed the floating point versions immediately to conserve space.
Another way to conserve disk space is by the use of mask grids. Grids are rectangular, while the area of interest usually is not. Generally, there will be a number of NODATA cells surrounding the county or region. Unless a mask grid is used, grid functions will operate on all of the cells in the grid. With a mask grid, they will operate only on the cells covered by the mask. It is good practice to use a mask that contains all the cells in the area of interest, but none outside the area of interest. The ABL grid (Section B.7.3) is a suitable mask for most procedures. In Phase 3 ECS subsection modeling, REGGRID (Section B.2.5.7) was used as the mask grid.
Early in Phase 1, we were advised to derive variables while using ARCHDATA (Section B.7.2), a grid derived from a point coverage, as a mask grid. Theoretically, this should provide variable values only for locations where archaeological sites occur. The objective was to conserve disk space while still having the data we needed for modeling. If a variable proved to be significant in the analysis, we could later derive the variable for the entire county or region. Meanwhile, processing would be faster, and we would not be devoting hard drive space to large grids that might never be useful.
This proved to be false economy. The mask not only limits the cells on which calculations will be performed, but also the source cells GRID can see. Many grid functions, notably EUCDISTANCE, gave erroneous results when this mask was used. We stopped applying the ARCHDATA mask before deriving variables. To save disk space, however, we continued to apply it after the variable was derived, often before converting the variable grid from floating point to integer. We found that even this function, which should act on each cell independently and should not be affected by a mask, produced different results when the mask was applied. We discontinued this practice and do not recommend using any grid derived from point or line coverages as a mask for conserving disk space.
B.3.2 Data Backup and Archiving Procedures
Data backup and archiving are important components of project management and cost control. Lost data represent lost time and lost money. The data developed for this project represent a large investment by MnDOT in consultant hours. Electronic media are unstable, so the risk of data loss is great. The only way to prevent loss is to have formal and redundant backup procedures. Backup refers to making copies, on a regular basis, of data that are actively being worked on. Archiving refers to making copies of databases that are in a completed form and are not necessarily maintained on the hard drive. Either backups or archives may be used to restore data that are inadvertently deleted from the hard drive, inadvertently altered, corrupted, or lost due to hardware or software failure. Increasingly, CD-ROM is the preferred medium for archiving because restoring is much faster.
Initially, Mn/Model backups and archives were committed to tape, as CD-ROM writing capabilities were not available. Later, we continued to use tapes for backups because the process could be automated and because tapes could hold more data. However, archives were written to CD-ROM. Coverages and grids were backed up and archived in their native format. Arc Export files were considered, but required too much storage space. Separate tapes were kept for general backups and for backups of specific data types. When a database was complete for each county, a CD-ROM was cut with all of the data and models for that county. Data, models, and derived variables for regions and subregions were also archived to CD-ROM. Finally, an archive of statewide coverages and grids was committed to CD-ROM. All tapes and CD-ROMs were clearly labeled, with general contents and dates. Both back-up and archive tapes and CD-ROMs for the project were secured in a locked drawer.
In Phase 3, ECS regional data were backed up to CDs or tapes to free hard drive space for ECS subsection modeling. Also, variables not selected for the final models were archived to save space. Backing up and restoring data are important and time-consuming tasks that must be figured into the modeling process.
The Principal Investigator for GIS has primarily responsibility for establishing and regulating quality control procedures. This Standards and Procedures document is an important part of the quality control effort. It has been under development and in use throughout the course of the project to serve as both as a record of what has been done and a guide to proceeding consistently and deliberately towards completion. It includes detailed documentation of procedures for processing and converting GIS data, for defining model variables, and for data analysis. A separate User Manual serves as a guide to the AMLs and provides additional detail on interactive procedures. It will help continue the quality control effort established so that any new data layers, variables, and models will meet or exceed the same standards as the original products.
The following sections detail some of the quality control procedures used.
B.4.1 Standard Operating Procedures
Each GIS task on this project was described in detail in a written work order. This work order was assigned to a GIS technician, consultant, or associate. The Principal Investigator issued most, but not all, work orders. The person completing the work had several responsibilities:
- To follow the work order carefully.
- To notify the PI when procedures detailed in the work order did not work out for some reason.
- To make written corrections to the work order, if necessary, based on discussions with the PI.
- If appropriate, to incorporate the work order into an AML to assure consistent application of the process with subsequent data sets.
- Upon completion of the task, to return the work order, with corrections, to the PI.
- Upon receipt of completed work orders, the PI incorporated the details of the work order and any subsequent corrections made to it into either the Standards and Procedures Manual. The PI then determined whether any changes or corrections made in procedures for that work order had implications for work already done. If so, follow-up work orders are generated to make sure that the previous work was corrected immediately.
In addition, technicians and consultants took the initiative to design check-lists and tables to track complex processes. At the end of Phase 1 data conversion and the beginning of the Phase 2 conversion stage, an extensive quality control effort was undertaken. Data already converted were examined, errors identified, diagnosed, and corrected, and work orders updated with specific quality control procedures to be followed in Phase 2. Over the course of the project, procedures were tested and refined until the Standards and Procedures Manual became a reliable guide for continued work. Testing and refining procedures also enabled the automation of procedures so that they could be performed more efficiently, accurately, and consistently when applied to other data. Finally, data were visually examined before being written to CD-ROMs for delivery to MnDOT.
B.4.2 Quality Control for Specific Types of Data
B.4.2.1 Hard Copy Maps
These quality control procedures applied to hard copy maps that were digitized or scanned, whether they came from an outside source or were drafted internally.
- Record any information you will need for metadata: the map source, scale, date, projection, and so on. Use this information to establish the metadata for the product that will be made from the map.
- Determine map location. Identify registration points on map (i.e. points that can be identified by known coordinates or which can be located on an existing digital base map).
- Determine, if possible, map projection. Is it appropriate to be registered to the available digital base map? If not, can the base map be projected into the appropriate projection to match the paper map?
- Compare the map to any adjacent maps. Do lines meet at the map edges? Do polygons that cross map edges close? Are labels consistent across map edges? Is the same classification/labeling scheme used as on the other maps? Is it in all ways consistent with other maps in the set?
- Review the map for correct, interpretable information. Do all polygons close? Is it clear which lines are to be digitized and which (if any) are not? Are labels legible? Are all polygons labeled? If there are any questions about the maps (how to close a polygon, what a label value should be), copy the portion of the map in question and fax that to the source for correction. Retain a copy of your transmittal with the map and record the event in the metadata.
- If the map is to be scanned, is it clean? Is there any extraneous information that needs to be removed? Is there good separation between text and lines? Are lines solid and without gaps?
When digital data are received from an outside source, the following quality control procedures were used:
- Make a note of:
- Date data received
- Who it was received from (and how to contact them)
- Date data reviewed
- Who reviewed it
- Results of the review (accepted, rejected, reasons for rejection, returned to source for corrections, etc.)
- Verify that the data received are what we requested.
- Compare file sizes. Files we have should be the same size as the originals at the source. This is particularly important after ftp.
- Record the data format. Is it a coverage, GRID, TIN, shape file, image (processed or raw), AutoCAD DWG, Ultimap, EPPL7, MapInfo?
- Record the transmission format, if different from the data format. Is it ARC Export (.e00), DXF, zipped.?
- Import/convert the data into a usable format, if necessary.
- Record conversion or importing procedures and parameters used.
- If a work order is provided, follow the procedures given.
- Procedures used should become part of the metadata.
- Do a DESCRIBE (or DESCRIBELATTICE) and record the following:
- Primary features: polygons/arcs/nodes/points/routes, sections (subclass)/regions (subclass)/ annotation (subclass)
- Number of features of each type
- Whether topology is present.
- Whether there are edit masks
- Whether there are secondary features. If yes, what kind (tics/arc segments/polygon labels/links)?
- Whether there is annotation
- Projection, datum
- Zone
- Map extents (x-min, y-min, x-max, y-max)
- Units · X-shift or Y-shift
- What the features represent, e.g. streams, zoning, city streets.
- Determine if we received metadata with the data. In what format (paper or digital)? Document where the metadata can be found, including names of digital files or full citation of paper document.
- Check georeferencing and visual integrity:
- Identify the geographic area represented.
- Compare the data with a map of the same area. Are the two sources consistent, e.g. does a highway that should pass through the area actually show up in the coverage/grid?
- Are data missing from areas that should have data?
- Verify that it overlays correctly with other data by displaying it over a simple coverage (like a county or state boundary) in the same projection, coordinate system and map units. If the datasets do not overlay correctly, determine the problem and solution.
- Check the attribute table
- Verify that an attribute table is present. If it is not, BUILD or CLEAN a coverage, or BUILDVAT for a grid.
- Record the results of ITEMS. Verify that the items and their definitions are consistent with the metadata received.
- LIST the attribute table. Verify that the necessary items are populated for all records.
- Determine whether the attribute table is interpretable. If they use codes or classifications, are these explained in the metadata?
- For coverages, check node and label errors. Determine whether these are valid or need correcting. For example, node errors could be valid nodes in donut polygons, or they could be excessive nodes in arcs that need to be unsplit. Missing labels could indicate unlabeled polygons that should have labels or slivers that need to be eliminated. Label errors can cause serious display and analysis problems.
- If possible, make any necessary corrections and record:
- Date edited
- Name of editor
- Brief description of edits made
- If necessary, return the data to its source for correction, recording:
- Date returned
- Who sent it
- Who it was sent to
- What corrections were requested
B.4.2.3 Vector Data (coverages)
Procedures were developed for performing quality control on coverages (vector data) digitized from paper, converted from another digital format, or created by processing previously existing coverages. These included
- DESCRIBE the coverage.
- Does it have features (arcs, polygons, labels)?
- Are they the kinds and numbers of feature you would expect it to have?
- Has it been BUILT?
- Are the coordinates reasonable?
- Are the right type of features present? (Polygon, arc, point, node, annotation topology.)
- Are there any edit masks?
- Is the map extent logical?
- Is the projection defined and correct?
- Check the projection. Is it in UTM meters, NAD83, with no shift?
- Check for node errors
- For polygon coverages, display node errors in ArcEdit. Usually, you should have no dangle errors in a polygon coverage. If you find any (and there is no good reason to keep them), delete them. If you have no line attributes, but you have pseudonodes, select all of your arcs, CALC $ID = 1, and UNSPLIT.
- For line coverages that have no attributes, remove pseudonodes using the UNSPLIT command. Do not do this if the lines have attributes, as data can be lost.
- For polygon coverages, check LABELERRORS. There should be exactly one label error in any polygon coverage. If you have more or less than one label error, find and correct them.
- Use the ITEMS command to verify that the .pat and/or .aat files have the expected attributes
- Is there a table? If not, the coverage probably needs to be BUILT.
- Is the table populated?
- Compare item's definitions with the work order, metadata, or other coverages it must match. Does the table contain the correct items? Are they in the correct order? Are the items correctly defined (integer, floating point, character, width, etc.)?
- Are the table values valid? Consult the metadata or work order. If there is no metadata, establish it.
- Are the user IDs unique? Perform a FREQUENCY on the user ID item. Duplicate records with the same ID are valid only in rare cases.
- Use FREQUENCY to determine whether there are only valid codes or reasonable numeric values in the attribute table items. Also use the FREQUENCY table to determine whether any records are missing data. Use RESEL to identify these records.
- Examine the coverage in ArcView.
- Assign symbols to the attributes in the Legend Editor. If an error message is received, the coverage may be corrupt. Does it look logical? For instance, if you assign green to forests and blue to lakes, do you have the kind of pattern you would expect on the landscape? Is pine forest mapped in southeastern Minnesota? If the spatial patterns of the symbolized data do not seem logical, the coverage attribute table may need to be built or may have been scrambled in a previous process.
- View the records in the attribute table. Select several records and verify that the features in the View are also selected. Determine whether the selected features are correctly located.
- Verify that the coverage overlays other coverages/grids/shapefiles in the same geographic area.
- Check for missing data in the View.
- Verify that the coverage has metadata. If it does not, establish it.
- Verify that the coverage is consistent with the metadata (projection, units, attributes, etc.)
- Incorporate any changes made in the coverage into the metadata.
Procedures for performing quality control of grids (raster data) included verification of cell size, map extent, projection, value ranges, and data type. When attribute tables were present, their contents were checked. Grids were examined visually for missing data and registration.
These procedures are for grids made from coverages, from other digital sources, or from processing other grids:
- DESCRIBE the grid.
- Verify that the cell size is correct.
- Verify that the map extent is logical.
- Verify that the projection is correct.
- Determine whether it is in the expected grid format, either integer or floating point.
- Determine whether the values are within the specified or expected range. Verify that the mean value is reasonable.
- For integer grids, check the VAT.
- If no VAT is present, determine whether all values in the grid are NODATA. If this is the case, check, and correct the procedures used to create the id.
- If no VAT is present, but there are values in the grid, check the range of values. A VAT will not be built if the range of grid values is greater than 100,000 and the number of unique values is greater than 500. However, if the range of values is less than 100,000, then the number of unique values in a VAT can be up to 100,000. If GRID does not automatically build a VAT and one is required for subsequent processes, use BUILDVAT.
- Verify that the VAT contains the expected items and that they correctly defined and in the correct order. It is imperative that no items are inserted between the VALUE and COUNT items in a grid VAT.
- Use the LIST command to verify that the table is populated.
- Determine whether the relative numbers of cells for each of the different values are reasonable? For instance, there should be many more cells for uplands than for lakes.
- Make sure the grid has NODATA values (not zeros or another number) where there is no data.
- Verify that the grid values are valid. Consult the metadata in making this determination.
- If there is no metadata, establish it.
- Perform a visual check in ArcPlot or Spatial Analyst
- Check for missing data (NODATA values where there should be data).
- If the grid was made from a line or point coverage, zoom in close enough to verify that the data are present and that lines are continuous.
- Overlay the source coverage or other related vector data to verify correct registration.
- Determine whether the spatial pattern represented in the grid is logical. For instance, if a grid portrays distance from lakes, it should appear as concentric zones of increasing value around lakes. A grid of solar insolation should create a hillshade effect when viewed.
- Look for obvious flaws. For instance, visible quad boundaries in an elevation grid.
- Correct any problems that are correctable, and document others in the metadata.
- Carefully check the output of any procedure that takes more than an hour to process. Very long processing times may be the result of corrupt data or other errors.
B.4.2.5 Quality Control for Digitizing
Additional quality control procedures were implemented for data being converted by digitizing hard copy maps. Input maps were reviewed and ambiguities clarified before digitizing. Digitizing and edgematching were done in AutoCAD. Maps were registered to digital PLSS corners or quad frame corners. RMS values and other information were recorded on checklists. ArcCAD was used to create coverages with topology and perform quality control (see Section B.4.2.3). When errors were found, the map was plotted, with errors displayed. This plot was returned to the digitizer, who then made corrections in the digital drawing. Maps were also plotted for comparison with the hard copy source maps.
B.4.2.6 Quality Control for EPPL7 to GRID Conversion
Converting from EPPL7 to ARC/INFO GRID format requires going through ERDAS format as an intermediate step. It is important to visually examine the ERDAS images that are created with the EPPL7 software. They are sometimes distorted and need to be redone. Once grids are created from the ERDAS images, they should be checked over using standard quality control procedures for grids (Section B.4.2.4). If databases are joined to the grid VAT, the result of the join must also be checked.
Mn/Model adopted the Minnesota Geographic Metadata Guidelines, Version 1.2 (Minnesota Governor’s Council on Geographic Information 1998). This standard was developed by the Minnesota Governor's Council on Geographic Information, GIS Standards Committee. Initially released as version 1.0 in September, 1996, it was updated to version 1.2 in October, 1998. It is designed as a state version of the FGDC Content Standards for Geospatial Metadata.
The final metadata were created using DataLogr software (version 2.0m). DataLogr is an MS-Windows (and DOS) data documentation software created by the IMAGIN Data Sharing Network (IDSN), a group of Michigan based public agencies who have agreed to share digital data with each other. DataLogr helps data developers gather, manage, and distribute complete and consistent information about their data.
Datalogr is a part of a data management strategy for Minnesota to document data. In 1998, an agreement between the Minnesota Land Management Information Center (LMIC) and IMAGIN allowed LMIC to distribute Datalogr to public organizations in Minnesota. Datalogr version 2 is offered to all public and nonprofit organizations within Minnesota at no charge. Datalogr has three attributes which make its selection appropriate for Minnesota: it is flexible and can be formatted to comply with the state’s metadata guidelines; it can be used with a PC; and it can be selectively distributed without charge.
Metadata were developed only for the Mn/Model data that will be distributed on the MnDOT server. These metadata will reside on the same server as the data. Original metadata (paper files) for data received from outside sources have been archived at MnDOT, along with the original data received. The final report, particularly this appendix, serves as metadata for the intermediate GIS layers (such as the variables used as model input). These layers are used only for modeling and are not intended for distribution within MnDOT or to other agencies.
B.6.1 Regions
B.6.1.1 Archaeological Regions
Archaeological regions for Minnesota were defined by Scott Anfinson (1988, 1990), Minnesota State Historic Preservation Office. These regions and and their subregions were used to regionalize the Phase 1 and 2 models (Section 4.6). These were digitized from an 8.5 x 11 inch hard copy map of the state provided by Scott Anifinson at SHPO. The source scale and projection are not known.
B.6.1.2 Ecological Classification System
The boundaries of the ECS classes were developed by a team composed of representatives from the DNR, the U.S Forest Service, and University of Minnesota. Source data scales ranged from 1:250,000 to 1:500,000. The digital version was provided by LMIC. At the time, the classification for Minnesota had been developed only to the subsection level. These subsections were used for regionalizing the Phase 3 models. The classification has now been completed down to the land type association at a scale of 1:100,000. These higher resolution data may be used to supplement other geomorphic data in Phase 4.
B.6.2 Archaeological Data
B.6.2.1 Archaeological Sites
The State Historic Preservations Office (SHPO), housed at the Minnesota Historical Society, is the primary source of archaeological data within the state. Until recently, their archaeological database was in a dBASE format and included UTM coordinates for all known sites. These data from SHPO were supplemented by archaeological data from the U.S. Forest Service, Chippewa and Superior National Forests, and the U.S. Park Service. These federal data were maintained in a proprietary digital database format.
The archaeological data are of varying quality (see Appendix D). They include data from truly random surveys of Wright, Wabasha, and Cass counties by Mn/Model crews in 1996, stratified random surveys of Stearns, Nicollet, and Beltrami counties by the same crews in 1995, surveys conducted as part of the Statewide Archaeological Survey (1977-1980), surveys conducted as part of trunk highway and pipeline projects (CRM data), and other less systematic sources. Locational information is not always reliable. The SHPO database contains a field with an estimate of the reliability of the locational information reported. Sites for which this reliability was deemed to be low were excluded from use in this project. Data were further stratified according to defined standards (refer to Chapter 5 for more information).
Recently, SHPO has migrated their data into an MS Access database. The flat file used previously has been broken out into a number of related tables. This has eliminated the need for multiple records to describe a single site. Other changes are being made in the existing data and in procedures for recording new sites after consideration of problems detected during the development of Mn/Model. SHPO also had databases of historic structures and shipwrecks that were not utilized in this project. However, the historic structures database is available on the Mn/Model server to MnDOT's Cultural Resources staff. Updated archaeological site and historic structure databases are being provided to MnDOT on a regular basis. MnDOT, in turn, performs extensive spatial quality control on the data and provides SHPO with a shapefile and report of errors detected.
B.6.2.2 Negative Survey Locations
Negative data, random points located in areas that were surveyed but where no sites were found, were recorded from SHPO paper documents (see Chapter 5). A single random point was located within each 40 acre parcel surveyed. If a survey covered more than 40 acres, it was represented by more than one point. UTM coordinates from these points were read from topographic sheets and entered into a dBase file for inclusion in the archaeological database. These "nonsites" provided the necessary negative data (absence of site) for building the site probability models in Phase 2 and provide positive data (presence of survey) for the survey probability models in Phase 3.
B.6.2.3 Points versus Polygons
For Mn/Model Phases 1-3, points were used to represent sites and negative surveys. The primary reason for this decision was that the points could easily be generated from the UTM coordinates of the site centroids recorded in the available databases. Moreover, it was the opinion of some archaeologists associated with the project that site boundaries as recorded on paper maps were not accurate or did not reflect the full extent of sites, only the part surveyed. And although survey boundaries may have been mapped, often selected parcels within these boundaries were actually surveyed, and these are not identified. Consequently, the research team believed points were the best choice for representing the available data.
However, the advantages to digitizing site and survey boundaries are considerable. First, locations are almost certainly more accurately expressed by polygons, even if their extents are incomplete or uncertain. We found that many site centroids were actually located outside of the site itself. This occurs when the shape of the site polygon is a curved or irregular shape. It can also occur when a site is defined as including resources on opposite banks of a river, in which case the centroid may fall in the river. And although archaeologists may have mapped the known extent of a site in about the right location, they may have made large errors in recording UTM values. Sites digitized from quad maps have no chance of generating site locations outside of the correct quad sheet, county or state, whereas inaccurate UTMs can place a Minnesota site in South America. Second, by including the known extent of sites, individual sites may be represented by a number of cells in a grid. Each cell reflects some aspect of the environment containing the site, whereas the single-cell site centroid reflects only a small part of that environment. The additional cells provide much more information to the analysis and would help compensate for low site numbers. Moreover, some GIS software will allow multiple polygons to be defined as "regions", where each region has a single unique ID. This avoids the problem of determining which part of the site to record in the geographic database. However, digitizing polygons is a time-consuming, therefore expensive, method of converting archaeological locational data into GIS format.
The Minnesota SHPO is seeking funding to digitize their site and survey boundaries. When this project is completed, future phases of Mn/Model will use the polygon, rather than the point, data for modeling.
B.6.3.1 USGS 7.5 Minute Digital Elevation Models (DEMs)
Where available, USGS 7.5 minute Digital Elevation Models (DEMs) were used to derive terrain variables. The 7.5-minute DEM provides data an assumed 30 m resolution (30 m spacing between data points) in UTM projection. Each product provides the same geographic coverage as a 7.5-minute quadrangle. The reference datum may be NAD27 or NAD83. Elevations are either meters or feet. DEMs of low-relief terrain or generated from contour maps with intervals of 10 ft (3m) or less are generally recorded in feet. DEMs of moderate to high-relief terrain or generated from maps with terrain contour intervals greater than 10 ft are generally recorded in meters. Even though DEMs with elevation units in meters produce floating point grids, the units are still whole meters, not fractions of meters. Therefore, conversion to integer grids to reduce grid storage size will not result in any loss of data. Vertical accuracy standards for 7.5-minute DEMs are 7 m Root Mean Square Error (RMSE) (desired) and 15 m RMSE (tolerated).
At the time of the project, DEMs at this scale were available for only about 81% of the state. These DEMs were provided by DNR on tape in Arc/INFO format, UTM coordinates, NAD27, with elevation units converted to feet. In October, 1996, additional DEMs that had become available since the first delivery were provided in NAD83 coordinates.
Only Nicollet County DEMs were obtained directly from USGS, as they had just been published and were not yet available from MN DNR. These DEMs were tiled by quads and required conversion to ARC/INFO GRID format.
For areas lacking 7.5 minutes DEMs, 1:250,000 scale elevation data from MGC100 were substituted. These are clearly lower quality data. However, the quality of the 7.5-minute DEMs also varies. The 7.5-minute DEMs come in two types, Level 1 and Level 2. Level 1 DEMs were produced by a photogrammetric process, whereas Level 2 DEMs were produced from scanning USGS 7.5 minute topographic maps.
The Level 1 procedure was the original conversion method used. Several independent contractors working for the USGS used photogrammetric methods that achieved the designated standard, which specified the acceptable elevation difference between recorded points and actual ground levels (RMSE < 7 meters). Two different methods were adopted by different contractors (U.S. Geological Survey 1990). These methods produced systematic distortion, or artifacts, in the data that are visible when the elevation grids are viewed. One method produced apparent patches, while the other resulted in a banding or striping effect (Garbrecht and Starks 1995). The method for deriving Level 2 DEMs was adopted when problems were found with the Level 1’s. Level 2 DEMs, created by scanning, vectorizing, coding, and rasterizing the contour separates of 1:24,000 quadrangles do not exhibit problems.
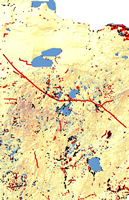
Significant data distortion problems, referred to as banding, were identified in 380 DEMs (Figure 4.2). These were all Level 1 DEMs. The nature of the distortions and the procedures used to evaluate and mitigate the problem are described in Section B.7.3.1. Other problems with DEM data arise from different contractors doing the work, so data are not always consistent from one quad to the next. This frequently results in elevation discontinuities at quad boundaries, giving the appearance of long, straight bluffs. Another frequently encountered problem with DEMs is gaps between quads. These were filled by interpolation (Section B.7.3.1).
The quality of the DEM data was recorded by adding a field (DEM) to the statewide quad frame coverage, Q024. Codes in this field distinguish between Level 2, Level 1 not banded, Level 1 banded, and MGC100 data. Level 2 DEMs have now been completed for almost all of the state. These will be used for Phase 4 modeling.
B.6.3.2 MGC100 Elevation Model
MGC100 is a statewide, raster GIS database in EPPL7 format that is distributed by the Minnesota Land Management Information Center (LMIC). The elevation layer was developed and distributed at a resolution of 100 meters. It was used in Mn/Model Phases 1-3 only for areas where 7.5 minute DEMs were not available. These elevation data will be replaced in Phase 4 now that 7.5 minute DEMs are available statewide.
B.6.4.1 MnDOT BaseMap
The MnDOT BaseMap Version 1.0 was provided by the Minnesota Department of Transportation Cartographic Division on CD-ROM. The MnDOT Cartographic Unit digitized the USGS 7.5 minute quadrangles between 1989 and 1994. The digitizing was done in CADD format and converted to ARC/INFO line coverages beginning in 1994. Version 1.0 of the BaseMap was released in 1996 and used for Phases 1 and 2. The BaseMap was updated and a new version was released in Feb. 1998. This provided new reference layers for Mn/Model. In the BaseMap Version 1.0, categories of information are contained in individual layers and distributed as statewide coverages. Some layers, primarily those directly related to transportation, have descriptive attributes; others do not. Contour lines were not digitized.
Only the hydrology layers were evaluated for inclusion in the model. These included lakes (including double-line rivers) and streams (perennial, intermittent, and drainage ditches). The lakes had not yet been built as polygons, and no label points were present. Too many digitizing errors (missing lines, therefore unclosed polygons) and coding errors (islands coded as lakes and vice versa) were found. Because of these errors, the lakes layer was rejected for inclusion in the model. Instead, lakes and double-line rivers were taken from the National Wetlands Inventory (NWI) digital data.
The representation of lakes differs between the two sources. The BaseMap lake boundaries, as digitized from the USGS quads, often include areas that are defined as wetland by NWI. This may be because different classification schemes or working definitions of lakes were used when the two sources were first mapped. It may also be a result of mapping air photos taken in different years, as areas that are wetlands in dry years may be lakes in wet years. The Minnesota Department of Natural Resources (DNR) has developed a new lakes coverage derived from both NWI and MnDOT lakes. They have corrected errors, attributed the lakes, and integrated the lakes with streams and rivers to provide connectivity. These data will be adopted for Phase 4 of Mn/Model.
Perennial and intermittent streams from the MnDOT BaseMap were combined into a single coverage for use in the model. Drainage ditches were rejected as not being relevant to past environments. In Phase 4 of Mn/Model, improved streams data from DNR will be used.
Roads and other modern features from the BaseMap are used for reference by the end user. These were updated in Phase 3 using the 1998 BaseMap. The hydrologic layers from the BaseMap were not updated by MnDOT between 1996 and 1998. BaseMap 2000 is now available.
B.6.4.2 National Wetlands Inventory
Wetlands, lakes, and double-line rivers were taken from the National Wetlands Inventory (NWI). NWI data were mapped by the U.S. Fish and Wildlife Service from National High Altitude Photography Program aerial photographs with scales ranging from 1:58,000 to 1:80,000 and source dates ranging from 1974 to 1984. Wetlands delineated on the photographs were transferred to USGS 1:24,000 quadrangles, from which they were digitized. NWI digital data were acquired from LMIC in ARC/INFO format, each coverage corresponding to a 7.5 minute USGS quadrangle. In Phase 3, gaps in several counties’ NWI coverages were discovered. These were fixed except for one gap in Stevens County, which could not be fixed due to missing data in the original coverage.
Wetlands and water bodies in the NWI are classified according to a hierarchical system developed by L.M. Cowardin (1977). The system is based on a number of ecological, biological, hydrological, and substrate characteristics. It contains additional modifiers to convey information about water regime, water chemistry, soil, and other attributes. At the highest level of the classification, features are classified as belonging to a marine, estuarine, palustrine, riverine, lacustrine, or upland system. Each of these systems is further subdivided in the subsequent levels of classification. For Minnesota, the best reference to this system is the User’s Guide prepared by Santos and Gauster (1993). For Mn/Model, additional fields were added to the attribute table to summarize various components of the classification scheme. These are explained in Section B.7.4.2 of this report.
Since these data were acquired for Mn/Model, some attribute data have been corrected by DNR. The updated version will be used in Phase 4.
B.6.4.3 PCA Streams
Statewide EPA streams data were received from the Minnesota Pollution Control Agency (MPCA) as a 1:100,000 statewide stream network library consisting of 80 line coverages tiled by Minnesota river basins. A separate database of 80 attribute tables has additional information on streams, including stream order. Additional data are stored in *.ds3 files that could be joined to Arc/INFO attribute tables using the field RF3RCHID. The quality of this database is superior to the earlier used MnDOT BaseMap streams in terms of stream network accuracy and connectivity, but not in terms of spatial accuracy and line work. The coverages were projected from Albers to UTM for evaluation, but they were not used in modeling.
B.6.5 Geomorphology and Geology
MGC100 is a statewide, raster GIS database in EPPL7 format that is distributed by the Minnesota Land Management Information Center (LMIC). It was originally published as MLMIS40 (Minnesota Land Management Information System, 40 acre resolution). Some layers were developed as early as the late 1960’s. MLMIS40 data were developed from data ranging in scale from 1:24,000 to 1:1,000,000. MLMIS40 was not geographically referenced. MGC100 (MLMIS Geo-Corrected, 100 meter resolution) is a regridded, georeferenced version of MLMIS40.
A number of layers related to geomorphology and geology were evaluated for inclusion in the model. The most useful have been geomorphic regions (GEOM), landforms (LANDFORM), quaternary geology (QUATGEO), and bedrock outcrops (Section B.6.5.3).
GEOM maps physiographic areas defined by topographic relief and soil parent material. These data were obtained from 1974-1979 1:125,000 preliminary Minnesota Soil Atlas sheets developed by the Department of Soil Science, University of Minnesota. Dominant geomorphic regions for each cell in a 40-acre grid were recorded, reducing the resolution of the data to slightly worse than 1:1,000,000. There are 79 regions in Minnesota. The data have a reliable resolution of 600 acres.
LANDFORM describes the type of geologic landform represented by a geomorphic region. It is based on an interpretation of GEOM and reduces the number of categories to 14.
Quaternary geology (QUATGEO) maps the geologic classification for the unconsolidated sedimentary glacial and fluvial deposits that cover the bedrock in most parts of Minnesota. It was developed from the Geologic Map of Minnesota (Hobbs and Goebel, 1982), at a scale of 1:500,000. The scanned map was converted to a 40-acre grid cell (approximately 402.3 meters on a side) EPPL6 file. Since the appropriate cell size for conveying data at 1:500,000 is 250 meters, information was lost in this conversion. The effective map scale for these digital data is slightly worse than 1:1,000,000.
Because of their initial resolution of 40 acres, MGC100 data are useful primarily for regionalization and stratification. Variables were derived from these layers only because there were no alternative data. Phase 4 models will use data from the 1:100,000 scale DNR geomorphology coverage.
B.6.5.2 Watersheds
Major and minor watersheds were delineated by DNR on mylar overlays on 1:24,000 scale topographic maps. These mylars were reduced to 1:100,000 and pieced together to form map sheets, which were then scanned and vectorized. This database was received as a statewide ARC/INFO coverage. They were incorporated into the models in Phase 3.
Outcrops of bedrock formations that are sources of chert or galena were considered to be an important variable in the Southeast Riverine Region (Phase 2) and Blufflands, Rochester Plateau, Oak Savanna, and Twin Cities Highlands (Phase 3). The bedrock geology sources available were quite variable (Balaban 1988; Balaban and Olsen 1984; Mossler 1995; Runkel 1995; Sloan and Austin 1966). Table B.2 summarizes the available bedrock data for this region. The bedrock groups or formations of interest to Mn/Model are listed in Table B.3.
Bedrock geology for all of the counties in question was mapped by the Minnesota Geological Survey (MGS) at different scales and in different formats. When digital data were not available for this project, the best available paper maps were digitized. Digital maps of Houston County bedrock geology at a scale of 1:100,000 were obtained, but not used, as the 1:250,000 map appeared to be more consistent with the surrounding counties (and more complete, as it included all of Houston County).
Bedrock exposures were mapped by MGS for only two of these counties. Where no digital data or hard copy data were available, bedrock outcrops were taken from the MGC100 database.
The Minnesota DNR provided the 1:100,000 scale statewide landforms coverage. This statewide coverage LANDFORMS replaced the North Minnesota landform coverage LANDFNE2, earlier available at Phase 2. The northern half of the state was mapped at the Department of Geology, University of Minnesota-Duluth. The rest of the state was mapped by the Minnesota Geological Survey (MGS) in St. Paul. The data describe a wide variety of conditions related to surficial geology within a hierarchical classification scheme that was devised for use within Minnesota.
The statewide data set contains information derived from NHAP air photos (1:80,000), USGS 1:100,000 and 1:24,000 scale topographic maps, and from a variety of source products related to surface geology. The Minnesota DNR was the principal party responsible for the development and maintenance of a standard database design and valid codes lists, and coordinating the boundary reconciliation between the two mapping efforts.
The DNR data were also used to evaluate landforms’ affect on site frequency in Ecological Classification System (ECS) Region 4. However, the DNR data were completed too late to be used in Phase 3 modeling. This coverage will replace MGC100 geomorphic data for deriving variables in Phase 4.
B.6.5.5 Landform Sediment Assemblages
Landform sediment assemblages were mapped for eight major river valleys and the Red Lake Bog in Phase 2. In Phase 3, 16 upland quads (some are parts of quads) were also mapped. Mapping was done on 7.5 minute paper quad sheets from NAPP color-infrared aerial photos. The photos are 1:40,000 scale. A classification scheme was developed for these landforms that is hierarchical and can be expanded as more regions of the state are mapped. Mapping procedures are described in Chapter 12. A manual for mapping landform sediment assemblages and assigning landscape suitability ratings is also available on the Mn/Model web site (www.dot.state.mn.us/mnmodel/index.html).
B.6.6 Soils
Soil landscape units (SOIL) from MGC100 were used to derive statewide soil variables. There are 64 different categories of soils statewide, generalized on the basis of sub-surface texture, surface texture, drainage characteristics, and surface color. The digital data have a reliable resolution of 600 acres. These data were derived from 1970-1976 preliminary Minnesota Soil Atlas sheets, mapped at a 1:250,000 scale by the University of Minnesota Department of Soil Science, in cooperation with the U.S. Soil Conservation Service.
Soil drainage class (DRAIN) is an interpretation of the natural drainage condition of the soil material within its respective geomorphic region. It is derived from the SOIL and GEOM (Section B.6.5.1) layers. The presence of artificial drainage is not considered.
Because of their resolution, these data have serious limitations. They were used because it was the only statewide soil data available in digital form.
B.6.6.2 County Soil Surveys
Digital versions of the county soil surveys are not available for the entire state. Where digital soils data are available, there is no standard format or resolution. Digital soils data were identified in 1995 by the Minnesota Governor’s Council on GIS as the highest priority GIS data needed by users. Consequently, efforts are underway to improve the status of digital soil data in the state. Up to date information about the status and quality of digital soils data can be obtained (Minnesota Governor’s Council on Geographic Information 1997) by contacting LMIC.
Most of the county surveys digitized to date were done at the University of Minnesota, Department of Soil, Water, and Climate, under the supervision of Dr. Pierre Robert. These county soil surveys were digitized in the University of Minnesota Soil Survey Information System (SSIS). Most of these counties data have been converted to either EPPL7 or vector format. EPPL7 soils data with 5 meter cell sizes. Data in EPPL7 format for two of these counties were obtained directly from Dr. Robert, and the remainder were obtained through LMIC. LMIC was performing quality control on these data, so not all counties were available to this project by the end of Phase 2. Counties with these high resolution soils data at the time of Phase 2 modeling are listed in Table B.4. These data were not used in Phase 3 because they were not statewide in extent.
A few Minnesota counties have digitized their own soil surveys, and the Metropolitan Council has digitized some metro area counties. These surveys were not available in time for Phases 2 or 3, but will be obtained directly from the counties or from the Metropolitan Council in the near future. In all, digital soils survey data for 48 Minnesota counties should become available for future model enhancements. DNR now provides these data for download from the Internet.
B.6.7 Vegetation
B.6.7.1 Marschner Map
In 1930, Francis J. Marschner produced a map of The Original Vegetation of Minnesota, Compiled from U.S. General Land Office Survey notes. At the time, Marschner was a Research Assistant for the U.S. Department of Agriculture. Marschner’s map was redrafted and published (Marschner 1974) by the North Central Forest Experiment Station of the U.S. Forest Service. In his text, which supplements the map, Heinselman (1974) indicates that little is known about Marschner’s methods. It is likely he relied primarily on bearing tree data from the surveys, more so than the line notes and surveyor’s plat maps.
Comparisons of Marschner’s map with the original surveyors plat maps indicates that his interpretations were not entirely accurate. Moreover, at the 1:500,000 scale the vegetation patterns are very generalized. His map is, however, the only source for distinguishing between different forest types, without referring to the original surveyor’s notes. For the locations of boundaries between grassland and forest, the Trygg maps (Section B.6.7.2) are superior.
The published Marschner map was digitized by the Minnesota DNR and delivered as an ArcView shape file. In the digital map, modern lake boundaries from another source have been added, so the map is not identical to the paper version. For this project, some minor corrections were made to the statewide coverage. These included removing sliver polygons and adding approximately 50 polygon labels that were missing. These were corrected by comparing the unlabeled polygons with the original paper map. Some errors remain. The new lake shorelines added by DNR obliterated or altered some polygons. Mistakes are most noticeable in the northwestern part of the state.
William Trygg reproduced the features from the Public Land Survey plat maps for the state at a scale of 1:250,000. These maps show roads, trails, hydrology, wetlands, some vegetation (prairie for instance), and some cultural features. These paper maps were digitized specifically for this project for 20 selected counties. Due to budgetary constraints the entire state could not be digitized. However, it was important to digitize a representative sample of these maps to evaluate whether they would contribute to the effectiveness of the model. These were used in Phase 2 only.
B.6.7.3 Tree Species Distributions
The very generalized distributions of three tree species (sugar maple, paper birch, and Kentucky coffee tree) and one shrub (highbush cranberry) were selected for modeling in Phases 1 and 2 because of their presumed importance to the economics of hunter/gatherers. These species' distributions were digitized in ARC/INFO format for a Minnesota DNR project and provided to us by LMIC. The data sources were very generalized maps on 8 1/2 x 11 pages. Some species distributions are mapped as points; others are mapped as polygons. They are considered to be suitable only for general reference on a statewide basis.
B.6.7.4 Bearing Trees
Digital maps of the distributions of bearing trees, from the records of the Public Land Survey, were later provided by the Minnesota DNR. Surveys were conducted from 1847 through 1908. This coverage was used in Phase 3 in place of the more generalized tree species distribution coverages. In these coverages, trees are in the correct direction from their survey corners, but not necessarily at the correct distance. Locations may be off by as much as 200 meters. Surveyors’ biases towards certain species and trees of prescribed sizes prevent this data source from being definitive. Species can be assumed to be present in many places where they were not recorded. However, this remains a tremendous database of known tree species distributions for the mid to late nineteenth century. Because these trees were mapped on a 1:24,000 scale base of PLSS survey corners, the resolution is assumed to be 1:24,000. However, the original data sampled trees at intervals of one quarter to one mile.
B.6.7.5 Original Vegetation Around Bearing Trees
In conjunction with mapping bearing trees from survey notes, the DNR mapped vegetation described in the vicinity of the bearing trees. These data were taken from the original land surveyor line notes. The vegetation types are associated with section and half section corners, rather than with the actual locations of the bearing trees. However, line note descriptions may also include vegetation observed all along the section line surveyed. Consequently, they may not accurately reflect the vegetation at the corner itself. Moreover, some surveyors were more diligent than others about recording vegetation descriptions. For this reason, the quality of the data will vary throughout the state.
B.6.8 Cultural Features
Cultural features were recorded on plat maps drawn by surveyors as part of the General Land Office Survey, which established the Public Land Survey System network of townships, ranges, and sections. Cultural features include settler’s cabins, Indian villages, fences, bridges, and other features of cultural origin. The data were digitized from paper copies of maps compiled by J.Wm. Trygg, which are copies of the original plats, but at a reduced scale (1:250,000). These paper maps were copyrighted in 1964.
The date of the General Land Office Survey varies by township, but all were conducted between 1837 and 1905. Southeastern Minnesota was surveyed first; northern Minnesota was surveyed last. Many surveyors were involved in mapping Minnesota. Their reports and maps varied in the level of detail recorded. Some were known to be in error, or even to have been fabricated.
Vocabulary used for describing features was inconsistent. For instance, map symbols representing houses or homesteads were variously described as house, cabin, boarding house, cabin and breaking, cabin and farm, house and clearing, house and hay meadow, house and cabin, Indian house, Indian chief’s house, Indian log house, and Indian house and clearing. Because surveyors walked along the section lines, features within sight of those lines are represented more reliably than features situated within sections. Undoubtedly, many features within sections were overlooked completely.
Paleoclimate data were produced with the Bryson Paleoclimate Model for the locations of each recording weather station in Minnesota (Appendix F). They were delivered as six individual text files containing comma delimited data. Each file contained data on one of the following variables: annual precipitation, mean annual temperature, summer precipitation, mean summer temperature, winter precipitation, mean winter temperature.
Each file contains location data, in the form of latitude and longitude coordinates, and data in 200 year time slices back to 12,100 B.P. All dates are in radiocarbon years. Latitude and longitude are decimal form. Elevation is in feet. Temperatures are in degrees C. Precipitation is in millimeters (mm). Temperature is expressed as an average for the time period (year or season). Precipitation is expressed as a sum over the time period. Each record corresponds to a weather station in Minnesota. Each column (to the right of ELEVATION) contains the data value for a time slice (measured in years before the present).
All of the files were delivered in the following format:
Site,Latitude,Longitude,Elevation,0,-100,-300,-500,-700,-900,-1100,
Ada,47.30,96.52,910,6.097222222,6.096546914,7.144691466,5.170225031,5.08041524,5.159048354,5.695777298
AgassizRefuge,48.30,95.98,1140,3.208333333,3.206685968,4.260531184,2.274305268,2.183618979,2.263022365,2.804010807
Aitkin,46.53,93.72,1200,4.458333333,4.457441286,5.44072844,3.588636751,3.504229606,3.577387572,4.08013264
Pollen data (North American Pollen Database) for the upper Midwest were obtained from the National Geophysical Data Center (www.ndgc.noaa.gov) in Boulder, Colorado. These data consisted of raw pollen counts (the number of pollen grains found at each depth) and a list of carbon-14 dated depths. These data were processed into pollen percentages, a much easier form to compare and analyze. The percentage data, irregular in time, were processed with the carbon-14 data through linear interpolation into 100 year time slices. The core locations are lakes or bogs, and they do not correspond to the weather stations for which the climate data were modeled.
The pollen database is merely a compilation of the percentage of pollen data in a specific core taken from a specific lake. Species represented are spruce, pine, birch, ragweed, sedge, sage and oak. The value is not the percentage of a given species at that point and at that time. Care must be taken to interpret the database appropriately.
The data were delivered in comma delimited ASCII files, with one file for each species in each 100 year time slice. Hence there were separate files for birch 100ka, birch 200ka, etc. This resulted in a very large number of text files that had to be processed into a useable format.
The original file format was:
| 58 | |||
| -93.75000 | 49.58333 | 391.0000 | 60.03897 |
| -90.35000 | 45.30000 | 470.0000 | 71.67542 |
| -90.35000 | 45.30000 | 470.0000 | 68.15539 |
| -93.70000 | 42.26000 | 317.0000 | 3.083916 |
| -93.11667 | 44.83333 | 254.0000 | 8.350400 |
| -92.62000 | 46.72000 | 386.0000 | 66.62424 |
| -89.90000 | 46.25000 | 488.0000 | 46.51469 |
| -91.11667 | 48.00000 | 462.0000 | 66.63404 |
| -92.82500 | 45.05000 | 258.0000 | 11.50420... |
The filename, for example MNPin0035, indicated the geographic region represented ( the Minnesota region, the species (pine), and the time slice (350 B.P.). The value in the first row (58) is the number of pollen cores in the time slice. The first column ( -93.75000) is the Longitude of the site, the second (49.58333) is the Latitude, the third ( 391.0000) is the elevation, and the last (60.03897) is the percentage of pollen of this species at this time slice.
B.6.10 Disturbance
Surface disturbance may affect whether cultural artifacts are likely to be removed, deposited, or buried by the action of humans, water or wind. Several MGC100 layers were evaluated to determine whether they could make useful contributions to Mn/Model. These data have a 40 acre resolution.
Mine pits and dumps can be extracted from the MGC100 quaternary geology grid (QUATGEO). Mines would have destroyed any surface or buried archaeological sites in the mined area. Dumps would bury sites, making them undetectable by surface survey.
Water erosion (WATREROS) maps high priority areas for water erosion. This raster dataset was derived at LMIC by applying the Universal Soil Loss Equation to MLMIS40 data. Input values were rainfall intensity (by county), Surface K_Factor from the soils atlas, land cover (from 1969 MLMIS40 Land use/cover), and a topographic factor computed from slope lengths from USDA and slope steepness from USGS 1:250,000 DEMs.
High priority areas for water erosion were defined as either shoreland with a potential soil loss between soil loss tolerance (T) and double the (T) value, or any land with a potential soil loss greater than double the (T) value. Shoreland was defined as any forty-acre parcel adjacent to a permanent or intermittent stream as shown on USGS 1:24,000 topographic maps. Soil loss tolerance values established by SCS range between 2 and 5 tons per acre per year. Factors for erosion potential were selected so that worst case conditions would be shown. Values are:
| 1 | Shoreland with estimated soil loss GE "T" value |
| 2 | Any land with estimated soil loss GE "T" value * 2 |
| 3 | Water |
| 4 | Other |
Wind erosion (WINDEROS) , part of MGC100, represents an evaluation of potential for soil loss, derived by LMIC, applying the Wind Erosion Equation to MLMIS40 data. The equation uses factors for soil erodibility from the Surface K-Factor in MLMIS40, soil ridge roughness assigned to counties by SWCDS based on crop types and tillage practices, climate for each county taken from SCS Technical Guide, unsheltered field distance for each soil landscape unit with the soil atlas series, and vegetative cover assumed to be zero (worst case).
High priority areas for wind erosion were defined as cultivated land with a potential soil loss of greater than double the (T) value. Soil loss tolerance values established by SCS range between 1 and 5 tons per acre per year. Factors for erosion were chosen to represent the worst case condition. All information needed for the model was not available for all counties, therefore some areas are classified as "non-inventoried counties." Values are:
| 1 | High priority areas - cultivated land with potential soil loss greater than or equal to double T value |
| 2 | Low priority areas - non-cultivated land or cultivated land with potential soil loss less than double T value |
| 3 | Non-inventoried counties |
Sedimentation (SED) maps high priority sedimentation areas in the state. These are defined as shoreland with estimated soil loss equal to or greater than 3 tons per acre per year. Values are:
| 1 | Priority sedimentation - shoreland with estimated soil loss greater than or equal to 3 tons/acre/year. |
| 2 | Water (100 percent coverage) |
| 3 | Low priority sedimentation |
Data conversion procedures for specific layers are described in this section, in the User Manual, and in the metadata. Conversion procedures were directed by project work orders, which have been archived. Separate documents reference the work order number to the work it directs. The work order numbering convention is based on the date it was first written. The first digit refers to the year (8 for 1998), the second and third digits to the month (01 for January), the fourth and fifth digits to the day, followed by an underscore and sequence number. The first work order of January 1, 1998 would be 80101_01, the second from the same day would be 80101_02, and so forth. Many work orders have been updated since they were first written, either to update procedures, to include more detail on procedures, or to document problems found with procedures or data.
In general, conversion procedures were made more efficient and consistent by automation. A number of AMLs (ARC/INFO macros) were developed to handle common conversion tasks: projecting, appending coverages, merging grids; and splitting statewide coverages and grids. However, not all conversion tasks could be completely automated. Some, for instance, required the use of more than one software package. Lengthy, multi-step conversion procedures were interrupted at certain points for quality control.
B.7.1.1 Archaeological Regions
Archaeological regions for Minnesota, as defined by Anfinson (1988, 1990), were digitized from an 8 1/2 x 11 inch paper source, and attributes were added. The name of the coverage is REGIONS. REGIONS was used to clip and organize data for modeling in Phases 2 and 3. Values in the PAT are summarized in Table B.5. Counties within each region are listed in Table B.6.
B.7.1.2 Ecological Classification System
The ECOREG coverage of ECS sections and subsections, as received from LMIC, needed no conversion. Counties within each Mn/Model variable region and ECS subsection are listed in Table B.7. After modeling, additional attribute fields were added to summarize numbers, types, and density of known sites, as well as other descriptions of the models for each subsection.
The archaeological database (ARCHDATA) was developed from the SHPO and federal digital databases (Chapter 5). This database includes Mn/Model field survey results, statewide survey results, CRM data, and other known sites. It contains sites identified in the surveys and "nonsites," random points selected within surveyed parcels with no site found.
All site data were represented in the GIS as points only (centroids). There was no attempt to represent site boundaries or approximate size. The "nonsites" provided the necessary negative data (absence of site) for building the Phase 1 models and positive data for modeling surveyed areas in Phase 3. Phase 2 and 3 modeling used truly random points (Section B.7.2.2) taken from the region at large as negative data because the locations of negative survey points were shown to be biased.
Only selected fields from the SHPO database were used, and new fields were added. Rules for determining whether a survey or site qualifies for inclusion in the GIS database, for selecting negative survey points, and standards for providing the data for input to the GIS are detailed in Chapter 5. Procedures for converting the digital database to GIS format are discussed below.
B.7.2.1 Preparation of Archaeological Databases for Input to GIS
Data were usually provided as one dBASE table per county, including both known sites (from probabilistic surveys, the SHPO database, and data from other sources, such as the USFS) and the negative survey points (random points taken from quarter-quarter sections surveyed in a probabilistic sample or qualified CRM survey, but with no sites found). More than one database per county was provided for counties with coordinates in more than one UTM zone or more than one datum.
Each database contained exactly one record per site. The SHPO dBASE files sometimes had more than one record for some large sites. These additional records were eliminated before conversion to GIS. All recent (post 1820) or questionable sites were excluded. Questionable sites included sites for which artifacts are possibly not of cultural origin and sites for which locations are very poorly documented. Files in UTM Zone 15 and in NAD27 were named ARFIPS.DBF, where FIPS is the three digit FIPS code for the county in question. Thus, Nicollet County’s file would be AR103.DBF and Winona County’s would be AR169.DBF. Variations were:
For NAD83 data, add 83, therefore ARFIPS83.DBF.
For UTM zone 14, add 14, thus ARFIPS14.DBF.
Attribute fields in the database are described in Table B.8. Most geographic coordinates for archaeological sites and surveyed points were originally recorded from USGS quads in UTM NAD27. The points generated from these coordinates were projected to UTM NAD83 zone 15 extended. However, the coordinate values in the database are still NAD27, as in the SHPO database. Separate databases were provided for sites with coordinates in NAD83. Points generated from coordinates in zones 14 and 16 were projected to zone 15. However, the coordinates in the database will still be zone 14 or 16 coordinates, as in the SHPO database. Separate databases were provided for sites with coordinates in zones 14 and 16. The DENSITY and DIVERSITY fields were coded only in the earliest stage of data collection and contain values only in a few counties. There was insufficient information in the SHPO database to make reliable estimates of these indices for most sites. Other fields were added after modeling (Section B.9.7.1).
B.7.2.2 Conversion of Archaeological Database to GIS Format
To bring the archaeological database into the GIS, points were generated from the UTM eastings and northings. Since most of the coordinates in the SHPO files were taken from USGS quads in the NAD27 datum, the archaeological database GIS layer was then projected from NAD27 to NAD83. Along the western edge of the state, points were in UTM Zone 14 instead of Zone 15. In the northeastern corner, some points were in Zone 16. These were projected to Zone 15 and appended to the files that were in Zone 15 originally. The archaeological data base coverage is in NAD83, UTM Zone 15. However, the UTM northings and eastings in its attribute table are mostly in NAD27 and sometimes also in Zone 14 or 16. These attribute values were not changed by the projection of the map.
After creating a point coverage for each county, an attribute (ID) was added to the database to serve as a unique identifier for each point. The coverage was converted to a grid, with the unique identifier as the grid value. That value was then used as a joinitem to join the remaining attributes from the coverage attribute table to the grid attribute table.
ARCHDATA: This is a coverage of point locations for known sites and negative survey points, created from the archaeological database files described above. The coverage is converted to a grid (also ARCHDATA) for modeling. When both the coverage and grid need to be in the same directory, the coverage is renamed to ARCHCOV. Coverage records include both known archaeological sites from the SHPO files and random points from negative survey areas, with the fields of the archaeological database as described in Section B.7.2.1. Grid values are only the unique Ids for the sites and negative survey points.
B.7.2.3 Random Points Coverage and Grid
The random point coverage RANDCOV and grid RANDPTS were originally generated in Phase 2 for all nine archaeological regions. These replaced negative survey points as "non-sites" in Phase 2 and 3 modeling. These points are truly random within an area, as opposed to negative survey points, which under-represent certain components of the landscape (i.e. water bodies, steep slopes, areas away from water).
The RAND function in Arc/Info Grid created an integer random number grid (with values between 1 and 10,000,000) for each cell of each Phase 2 archaeological region. Then only the cells matching 1000 or 2000 random numbers (between 1 and 10,000,000) generated by a random number generator (ABSTAT statistical software) were selected for inclusion in RANDPTS and RANDCOV. This resulted in about 2000 to 4000 randomly placed points (for coverage RANDCOV) or 30-meter cells (for grid RANDPTS) for each region.
In Phase 3, RANDCOV was given the same attribute items as the archaeological database ARCHDATA. A unique ID value was calculated for each random point. To create the database for Phase 3 modeling, in each ECS region, the random point (RANDPTS) and archaeological database (ARCHDATA) grids were merged to generate a sample grid (SAMPGRID) containing information on all sites, negative survey places and random points.
B.7.3.1 USGS 7.5 Minute Digital Elevation Models (DEMs)
Digital elevation data should be the first data converted, as they will be used to register all subsequent grids created for the project. USGS 7.5 minute DEMs at an assumed resolution of 30m were selected as the standard for elevation data for the project.
DEMs for Nicollet County were obtained directly from USGS. These data were tiled by USGS quads. DEM conversion involved the following steps:
- Delimiters were added as described in the ReadMe file that accompanies the DEMs.·
- Using the DEMs with delimiters as the <in_dems>, the DEMs were read with the ARC/INFO DEMREAD command, adding the file extension .r to the <out_dem>.
- The <out_dem> files were converted to ARC/INFOR GRID format using the DEMLATTICE command. ·
- All grids were checked to determine their projection datum. When necessary, they were project from NAD27 to NAD83.
- The floating point grids were converted to integer grids.
- Z units were checked. The DEM z units may be either meters or feet. Although the elevation values are stored as floating point numbers, they are actually integer data (there are no fractions of feet or meters given). For this project, we standardized z units to be feet (allowing us to use integer grids without losing accuracy from the DEMs that came with feet as z units). If DEM units are meters, the conversion can be made as part of the INT function expression.
- The resulting grids were then mosaicked, using LATICEMERGE, and clipped to create a county grid.
An additional set of 7.5 minute elevation data, derived from DEMs, became available in October, 1995. These were obtained in ARC/INFO GRID format from the Minnesota DNR and projected from UTM NAD27 to UTM NAD83. The remaining 7.5 minute DEMs were received from DNR a year later. These were already projected to NAD83, so no projection was required.
Each DEM grid received covered one USGS 7.5 minute quadrangle. These were merged, using GRID MERGE, to form region-wide grids. Values were interpolated to fill any gaps between quads. Finally, the region-wide grids were mosaicked using GRID MOSAIC to form a statewide grid. The statewide grid was clipped by the county BUFF1000 coverages (Section B.2.5.7) to create county DEM grids. Each county grid was overlaid by the statewide Q024 coverage and checked for banding) and missing data. Information about banding and missing data was entered into the Q024 attribute table.
DEM data had a cell size of 30.002 - 30.006 meters, not the 30 meters claimed in the metadata. Such grids did not exactly snap to other digital layers (vegetation, wetlands, soils etc.). Unequal cell sizes caused different cell counts for different variable grids in the same region. Also, tiny gaps appeared at the border and sometimes within grids. All elevation grids had to be resampled to the 30 m cell size using the BILINEAR option of the RESAMPLE function. They were simultaneously snapped to a standard regional grid. From that point on, the statewide elevation grid (ABL) was used as a snap grid for the creation of all other grids. This is why a statewide elevation grid with a true 30 meter cell size should be created before any other grid data. This grid should be used as a snap grid for the creation of each subsequent grid data set. Regional and county elevation grids should be clipped from, and snapped to, the statewide grid.
Evaluating Level 1 DEMs for Banding
Distortions found in Level 1 DEMs were a product of the method used to produce the digital data and are best described as "banding" (Figure B.1). Simply described, a banded or striped pattern is apparent when viewing the DEM. When contours are generated from the distorted data, they are stretched in a north-south or east-west direction. A total of 380 DEMs in Minnesota exhibited this problem (Figure 4.2). Because of the banding problems, several methods for "smoothing" the data were tested and followed by a systematic comparison of the original data, the smoothed data, elevation data from our only other digital source, the MGC100 database, and paper quads. These are documented in this section.
Banding problems were identified initially in Nicollet County, which was used as the pilot for the project. All DEMs for Nicollet County are based on Level 1 data. An evaluation of elevation data for Stearns County was added to the pilot because Stearns County had both Level 1 and Level 2 DEMs. None of the Level 1 DEMS in Stearns county exhibited banding. Thus, it cannot be assumed that all Level 1 DEM data are problematic. Each quad must be examined individually.
Filtering Techniques
To mitigate the banding problem, a variety of filters (generalizations) of the Nicollet County data were tested using the GRID function FOCALMEAN. Variations were:
- FOCALMEAN(<ingrid>, RECTANGLE, 3, 3)
- FOCALMEAN(<ingrid>, RECTANGLE, 5, 5)
- FOCALMEAN(<ingrid>, ANNULUS, 3, 9)
- FOCALMEAN(<ingrid>, ANNULUS, 3, 12)
- FOCALSUM(<ingrid>, WEIGHT, FILTER3.TXT
- FOCALSUM(<ingrid>, WEIGHT, FILTER5.TXT)
filter3.txt defines the 3x3 focal neighborhood as follows:
3 3
0.22 -0.11 0.22
-0.11 0.56 -0.11
0.22 -0.11 0.22
filter5.txt defines the 5x5 focal neighborhood as follows:
5 5
0.08 0.08 -0.12 0.08 0.08
0.08 0.08 -0.12 0.08 0.08
-0.12 -0.12 0.68 -0.12 -0.12
0.08 0.08 -0.12 0.08 0.08
0.08 0.08 -0.12 0.08 0.08
FOCALMEAN was applied only to the banded portions of the data. The filtered data were then used to update the ABL grid using GRIDINSERT, resulting in a somewhat smoothed grid.
Visual Appearance of Contours
One measure of success was the visual appearance of the contour lines generated from the resultant grid. The best results, by this measure, were obtained by FOCALMEAN(<ingrid>, ANNULUS, 3, 12) (Figure B.2). This function assigns to the source cell the mean value of the cells within a radius of 12 cells, but excluding values of cells within a radius of 3 cells. Essentially, the function disregards microvariation in relief (the elevation closest to the source cell) and averages local values in an annular shaped zone from 3 to 12 cells (90 to 360 meters) around the source cell. This function removed most traces of banding from contours generated from the grid.
Differences Between Digital Data and Paper Quads
Visual comparison involved plotting 10 foot contours generated from various versions of digital data at a scale of 1:24,000 and overlaying these on a paper 7.5 minute quad. For Nicollet County, the digital data mapped included unfiltered Level 1 DEM data, two versions of the same data filtered (annular filter, version 4 above, and weighted filter, version 6 above), and the 1:250,000 scale MGC100 elevation data. A portion of the New Ulm, Minnesota, quad was used for this comparison. The area analyzed included both the relatively flat uplands and the bluffs and floodplains along the Minnesota River. For Stearns County, contours generated from unfiltered Level 1 DEMs, Level 2 DEMs, and 1:250,000 data were plotted. The areas plotted were from portions of the Freeport Quad (Level 1 and 1:250,000 MGC100) and the Melrose Quad (Level 2).
A quantitative comparison of elevation differences between digital data and paper quads was accomplished for Nicollet County only. A sample of 53 data points was plotted on a BaseMap at 1:24,000 and overlaid on the paper USGS quad. Elevations at the sample points were recorded and entered into the GIS. These values were compared to the elevations of the same points as represented in four versions of the digital elevation data. The results are represented in Table B.9.
Results of the unfiltered 1:24,000 DEM data (Figure B.1): Although the contours generated from these data for Nicollet County are somewhat contorted, the elevation errors measured are quite small (usually only about 10 feet). Bluff edges are correctly located. Slope appears to be accurately represented. Aspect may be locally distorted, but this seems to be more apparent on flat slopes where aspect is not relevant. The aspect of the majority of the bluff faces appears to be correctly represented.
Results of the filter FOCALMEAN(<ingrid>, ANNULUS, 3, 12) (Figure B.2): The contours generated from 1:24,000 DEM data filtered by this function are quite generalized and do not show a strong correspondence to the contour lines on the paper quads. However, they are much closer to the paper quad contours than are the contours generated from the 1:250,000 elevation data. Filtered data were also much superior at representing the locations and orientations of major features, such as bluffs, than were the 1:250,000 data. They represented more microtopographic features, such as isolated hills and rises, than did the 1:250,000 data. However, spot elevations were off by as much as 60 feet in places. The greatest errors observed were along the edges (both top and bottom) of bluffs. This is because the bluffs have been smoothed considerably. The range of elevation that should be concentrated along the bluff face is stretched out over a larger area, displacing both the top and bottom of the bluff, and the slope is consequently less steep than it should be.
Results of the filter FOCALSUM(<ingrid>, WEIGHT, FILTER5.TXT) (Figure B.3): This filter generalizes the data less than the FOCALMEAN filter by giving more weight to the elevation recorded at the point in question. It also selectively filters out values directly north, south, east, and west of the point (the directions of banding). It improves the appearance of the contours, but does not completely remove all traces of banding. It also smoothes bluffs somewhat, displacing their tops and bottoms, but not the extent of the FOCALMEAN filter.
Based on this comparison, the decision was made to use unfiltered Level 1 DEMs for measures of elevation, slope, and relief.
Differences in Aspect between Filtered and Unfiltered DEMs with Banding
Visual inspection of the contour lines generated from unfiltered DEMs with banding clearly shows strong distortion of aspect (Figure B.1). The filtered DEMs appear much more "normal" in comparison with the paper 7.5 minute quads (Figure B.2 and B.3).
The quantitative results of the comparison of aspect derived from filtered and unfiltered DEMs indicated that individual cells could be as much as 180 degrees different. This is consistent with the banding pattern exhibited where, for instance, a south facing slope could be distorted into an east facing slope.
| Minimum | Maximum | Mean | Std. Dev. | |
| Difference in aspect | -180.99 | 180.00 | 7.126 | 38.946 |
Based on this evaluation, the filtered DEMs were selected for the derivation of aspect. The weighted filter (FOCALSUM) was used (Figure B.3). The resultant grid was named FILT5.
Differences between 1:24,000 and 1:250,000 DEMs
Unfiltered and filtered 1:24,000 DEMs were also compared with the 1:250,000 DEMs from the MGC100 data for the same quads to determine how different 1:250,000 data would be from a higher resolution data source. These comparisons are in Table B.10.
Assuming (based on the analysis presented above) that the unfiltered DEMs are the best digital representation of elevation, it is apparent that there may be considerable local error in the 1:250,000 data (Figures B.4 and B.5 ). However, the mean error is not great. The largest errors (about 200 feet) are most likely found in places of high relief. It is clear from the visual inspection of the contours generated from 1:250,000 data that the level of generalization has the effect of spreading contours of bluffs over a wider area (thus making bluffs less steep and displacing both the foot and top of the bluff outward). However, it does seem clear that the differences between the 1:250,000 data and elevation from paper quads are not as great for Nicollet County as a whole (perhaps on the average 10 feet lower than true elevations) as they are for the area sampled for comparison with the paper quad sheets (on the average 27 feet lower than true elevations). This is probably because points were deliberately sampled along bluffs to get an assessment of the situation where the worst problems existed.
The primary shortcoming of these procedures was the insufficient time available to evaluate DEMs or test different filters on a variety of terrain types. Consequently, the best results for the relatively flat pilot county may not be the best for a more rugged part of the state. Users should keep this in mind when evaluating the level of reliability of the models derived from elevation data.
B.7.3.2 Elevation Data from MGC100
For areas where no 1:24,000 DEMs were available, 1:250,000 elevation data from MGC100 (Section B.6.3.2) were substituted. The MGC100 ELEVATION layer measures mean elevation above sea level in meters. The source is Defense Mapping Agency scanned USGS 1:250,000 topographic maps.
MGC100 is distributed in EPPL7 format. EPPL7 is a DOS-based software and Arc/INFO 7.x does not recognize its data format. Using the PC Arc/INFO GRIDCONV command, the data can be converted, but their geographic coordinates are lost. The EPPL7 header format has been changed since PC Arc/INFO was written, and PC Arc/INFO cannot read the coordinate information from the new header. Consequently, EPPL7 software is necessary to perform the conversions.
Within EPPL7, files are converted to ERDAS format. An additional DOS program was required to fix these ERDAS files so that they could be read by Arc/INFO. This utility, FIXERDAS.EXE, was provided separately by LMIC. Finally, the repaired ERDAS files were converted to GRID format within Arc/INFO. Vertical (z) units were converted from meters to feet to be consistent with the standard for the DEM-derived elevation data. The appropriate formula is Elevation in Feet = Elevation in meters * 3.2808. The floating point grid of elevation in feet was then converted to an integer grid using the GRID function ELEV = INT(ELEV_FT + 0.5). This grid was then regridded to a 30 meter cell size using bilinear interpolation to create the grid ELEV30.
Data for gaps in the 1:24,000 scale elevation grid were extracted from ELEV30 by using Q024 to make a mask grid of the missing quad sheets. The extracted data were merged, using GRID MERGE, with the 1:24,000 data, creating a complete county grid of raw elevation values in feet. Gaps between quads within the county elevation grid were filled using the FOCALMEAN function, with a 4 x 4 cell rectangle as the neighborhood. This function was performed only on the cells that had a null value in the elevation grid.
After the statewide grid was created, buffered county boundaries were used to clip new county grids. This prevented gaps between adjacent counties when displayed. The resulting grid was ABL.
B.7.3.3 Data Layers Derived from Elevation Sources
ABL: Absolute elevation. This is the 30 meter resolution elevation grid created from 1:24,000 and 1:250,000 DEMs. The lower resolution data were used to fill in areas where 1:24,000 DEMs were not available. ABL is used to derive elevation variables, to depict elevation, and as a snap grid in the creation of all other grids.
ELEV30: MGC100 elevation data. From 1:250,000 source data at a true 100 meter resolution, regridded to 30 meter cells. ELEV30 was used to fill gaps in ABL where 1:24,000 scale DEMs were not present.
BANDED: This grid indicates which DEMs exhibited banding (cell values of 1) and which did not (cell values of NODATA). It was used in the procedure for filtering elevation data from banded quads. It was derived from the BANDED item in the Q024 attribute table.
FILT5: This grid of smoothed elevation data was used for deriving aspect and solar insolation. The filter was applied only to the parts of the county or region where Level 1 DEMs exhibited banding. The remainder of the region was left unfiltered. Thus, the grid has raw DEM data wherever the DEMs are not banded and filtered DEM data wherever the DEMs were banded. Refer to B.7.3.1 for more information about banding and filtering.
B.7.4.1 MnDOT BaseMap
The lakes layer of the MnDOT BaseMap was built as a line coverage. There were no polygon labels or attributes. One line attribute (IGDS_COLOR), according to the accompanying metadata, should have allowed us to distinguish between lakes, two-line rivers, and islands. However, we found that there were no lines with the code for two-line rivers and many islands were miscoded as lakes (some lakes were also coded as islands). There were also no lines between lakes and two-line rivers. Where these features meet they are digitized as one polygon. We also found that there were digitizing errors (the most serious being missing lines, for instance a 6-miles stretch of the west bank of the Mississippi River). We determined that it would be too costly to attempt to fix these problems. For making display maps, we coded polygon attributes for a few counties for which we had not yet received the NWI coverages and needed correct lakes and islands codes.
STREAMS (coverage): Perennial and intermittent streams from MnDOT BaseMap version 1.0 were in two separate coverages. The attribute H2O was added to the attribute tables and coded to have a value of 3001 in the perennial streams coverage and 4001 in the intermittent streams coverage. The two were then appended into one coverage.
STREAMS (grid): The streams grid combines double line rivers from National Wetlands Inventory (Section B.7.4.2) with single line perennial streams and intermittent streams from the MnDOT BaseMap. These are classified by seasonality. Seasonal rivers are typically channels of large permanent rivers that are dry for part of the year. Artificial rivers or rivers created by the actions of beavers were assigned NODATA values. Grid values are:
2001 PERMANENT RIVER
2002 SEASONAL RIVER
3001 PERENNIAL STREAM
4001 INTERMITTENT STREAM
B.7.4.2 National Wetlands Inventory
NWI polygon data were received from LMIC in ARC/INFO format, in the correct projection and units, with one coverage for each USGS 1:24,000 quad and the coverages residing in directories referenced to the 1:100,000 quads. All coverages within a county were joined together, the quad boundaries dissolved, and the resulting coverage clipped by the county BUFF1000 coverage (Section B.2.5.7). This coverage was called NWI_BUFF.
The NWI_BUFF coverage attribute table, after dissolving on the attribute NWI_CODE to remove quad boundaries, contained a single descriptive attribute, a numeric code. An accompanying INFO file (the statewide NWI legend file, LEGNWI) contained this same code and an additional character wetland code. The wetland code could be deciphered only by reference to Santos and Gauster (1993) or Cowardin (1977). NWI_BUFF was later renamed MWI (Mn/Model Wetlands Inventory) for distribution because of the changes made in the attribute tables.
The following fields were added to the NWI legend file:
System 10 10 C
Subsys 20 20 C
Class 40 40 C
Subclass 30 30 C
Regime 45 45 C
Chemistry 22 22 C
Other 20 20 C
Gen_reg 16 16 C
VEGTYPE 16 16 C
H2O_TYPE 16 16 C
H2O_REG 16 16 C
VEG_CODE 4 4 I
Each wetland category field was interactively selected and their values coded. This file was then joined to each NWI_BUFF coverage attribute table. Items in the NWI_BUFF.PAT attribute table are:
1. SYSTEM: Possible values are
- RIVERINE: Contained in natural or artificial channels periodically or continuously containing flowing water.
- LACUSTRINE: Wetlands and deepwater habitats that are:
- Situated in a topographic depression or dammed river channel and
- Lacking trees, shrubs, persistent emergents, emergent mosses, or lichens with > 30% areal coverage, and
- Total area exceeds eight hectares (20 acres). Basins and catchments smaller than eight hectares are included if:
- A wave formed or bedrock feature forms all or part of the shoreline, or
- Depth at low water is deeper than two meters in the deepest part of the basin.
- PALUSTRINE: All non-tidal wetlands dominated by trees, shrubs, persistent emergents, emergent mosses or lichens. Wetlands lacking such vegetation are also included if:
- Less than eight hectares (20 acres) and
- Do not have an active wave-formed or bedrock shoreline feature, and
- Depth at low water is less than two meters in the deepest part of the basin.
- UPLAND: Not otherwise classified.
- NONE: Unknown.
2. SUBSYS (Subsystem): Only riverine and lacustrine systems have subsystems in the NWI classification hierarchy.
- Possible values for LACUSTRINE systems are:
- LIMNETIC: Deepwater habitats, extending outward from LITTORAL boundary
- LITTORAL: Extends from shoreline to two meters below annual low water or to the maximum extent of non-persistent emergents, if these grow at greater than two meters.
- Possible values for RIVERINE systems are:
- LOWER PERENNIAL: Low gradient and slow water velocity. Some water flows throughout the year. Substrate mainly sand and mud. Floodplain well-developed. Oxygen deficits may occur.
- UPPER PERENNIAL: High gradient and fast water velocity. Some water flows throughout the year. Substrate consists of rock, cobbles, or gravel, with occasional patches of sand. Very little floodplain development.
- INTERMITTENT: Channels that contain water only part of the year, but may contain isolated permanent pools when the flow stops.
- UNKNOWN PERENNIAL: Distinction between lower and upper perennial cannot be made from aerial photography, and no collateral data are available.
3. CLASS: Describes the general appearance of the habitat in terms of either the dominant life form of the vegetation or the physiography and composition of the substrate. Possible values are:
- AQUATIC BED
- BEACH BAR
- EMERGENT
- FLAT
- FORESTED
- NONE
- OPENWATER
- ROCK BOTTOM
- ROCKY SHORE
- SCRUB/SHRUB
- STREAMBED
- UNCON BOTT (unconsolidated bottom)
- UNCON SHORE (unconsolidated shore)
4. SUBCLASS: Each class has its own set of subclasses. For ROCK BOTTOM, UNCONSOLIDATED BOTTOM, UNCONSOLIDATED SHOR, and ROCKY SHORE classes, subclass provides additional information about substrate (bedrock, rubble, sand, etc.) For all other classes, subclass provides information on vegetation (persistent, non-persistent, broad-leaved deciduous, etc.)
5. REGIME: The NWI water regime modifier describes the duration and timing of surface inundation. Possible values are listed in Table B.11.
6. CHEMISTRY: These modifiers refer to the salinity and acidity of soils. They are used only where detailed collateral data are available The only modifier used in Minnesota is ACID.
7. OTHER: These are NWI special modifiers used to indicate habitats modified by humans or beavers. Possible values are:
- Artificial
- Beaver
- Beaver-Diked/Impound
- Diked/Impound
- Esc-Part Drain/Ditch
- Excavated
- Farmed
- Farmed-Beaver
- None
- Organic
- Organic-Diked/Impoun
- Organic-Part Drain/D
- Part Drain/Ditch
- Part Drain/Ditch-Dik
- Part Drain/Ditch-Org
- Spoil
8. GEN_REG: General water regime. This field was added for Mn/Model and is a generalization of REGIME and OTHER. Possible values are: UPLAND, SEASONAL, PERMANENT, ARTIFICIAL, BEAVER, UNKNOWN. Values for this field were determined by combinations of SYSTEM, SUBSYSTEM, REGIME, and OTHER, as defined in Table B.11.
9. VEGTYPE: Wetland vegetation type. In the classification of vegetation types, only palustrine systems were included. This variable is a generalization of CLASS for wetlands (Table B.12). In the case of mixed vegetation types, the type with the highest level vegetation structure took precedence (forest took precedence over shrubs, shrubs over herbs, herbs over open water).
10. H2O_TYPE: Type of water body. A classification of water body types that considers palustrine ecosystems characterized by open water or floating vegetation to be ponds. Criteria are in Table B.13.
11. H2O_REG: Regime of water body. A combination of general regime and type of water body (Table B.14).
12. VEG_CODE: A numeric code corresponding to VEG_TYPE. Codes are presented in Tables B.12 and B.15.
13. H2O: A numeric code based on H2O_REG and the size of water features. This code is used to create grids LAKE1, WET1, and STREAMS. Values for H2O are found in Tables B.16 and B.17, and in the description of the STREAMS grid (below).
Data layers derived from NWI
LAKE1: This is a grid of lakes made from the NWI_BUFF coverage. Lakes are classified by size and seasonality, as expressed by the attribute H2O (Table B.14). The minimum size of a very large lake corresponds to 1920 acres. Large lakes are between 120 -1920 acres, and medium sized lakes are between 40 and 120 acres (Cowardin, 1977). Uplands, artificial lakes, and lakes created by beaver activity are assigned NODATA values. Values in LAKE1 are detailed in Table B.16.
NWI_WET: A grid of National Wetlands Inventory wetland vegetation types made from the NWI_BUFF coverage. Wetlands are classified by type according to the attribute VEG_CODE (Table B.15). All uplands, artificial lakes or wetlands, and wetlands created by beaver are assigned NODATA values in the NWI_WET grid.
WET1: A grid of wetlands derived from NWI_BUFF, classified by size and seasonality as coded in the attribute H2O. Wetlands that are artificial or created by the actions of beavers are excluded. The classification for WET1 is presented in Table B.17.
STREAMS: A grid of streams derived from merging permanent and seasonal rivers from NWI_BUFF and perennial and intermittent streams the MnDOT BaseMap, version 1.0. Values in the STREAMS grid are based on the attribute H2O, found in both source coverages.
2001 Permanent River 2002 Seasonal River 3001 Perennial Stream 4001 Intermittent Stream
Reservoir Lakes
Reservoir lakes presented a challenge for the modeling effort. Lakeshores of modern reservoirs would not have been lakeshores in the precontact period. Because such lakes are coded as ‘artificial' in the National Wetlands Inventory, they were excluded from the LAKE1 grid. However, in some cases these lakes are simply larger versions of precontact lakes or occupy the valley of a precontact stream. It was not feasible to investigate the status of every artificial lake in the state. However, compensation was made for some of the major reservoirs, as designated for this project by Dr. Scott Anfinson, State Historic Preservation Office. These lakes are listed in Table B.18.
Where these reservoirs were created by damming streams, the lake was removed from the LAKE1 grid (if present) and replaced by adding the original stream course to the STREAMS grid, using the best source available. Topographic maps that predated damming were rare. The best source for former stream courses was, in one case, a county boundary coverage. In other cases, the stream course was digitized as depicted on the Trygg maps. Where pre-existing lakes were enlarged by damming, the former lake extent was digitized from the best source available, the Trygg maps, and inserted into the LAKE1 grid. The NWI_BUFF and STREAMS coverages were not edited.
Other dammed lakes were examined and found to be not much different now than they were in the past. These were Pokegama Lake (in Itasca county), Whitefish Lake (in Crow Wing county), Big Sandy Lake (in Aitkin county), and Gull Lake (in Crow Wing county). Where reservoir lakes were created by mining, it was verified that they were not included in the LAKE1 grid. If there was no pre-existing lake or stream, no further action was required.
In Phase 3, portions of the Mississippi and Minnesota River, coded in NWI as artificial lakes, were recoded to H2O_REG = 'PRIVER', so that they were included in the updated STREAMS grid. However, many artificial lakes were not examined. Consequently, neither their present nor their pre-contact extents are included in LAKE1 or STREAMS.
B.7.5 Geomorphology and Geology
MGC100 data were received as statewide layers in EPPL7 format, gridded at a 100 meter resolution. The process for converting these EPPL7 files to ARC/INFO format involved several steps. First, in EPPL7, the *.epp file is converted to an ERDAS 8-bit format using the EXPORT command. To make the ERDAS file readable in ARC/INFO, a DOS program was run to retain the file's project coordinates. This utility was provided separately by LMIC, after discovering that the file coordinates were lost in the conversion (Section B.7.3.2). The file was then FTP'd from the Windows workstation to the UNIX workstation using binary mode and was converted to a grid using the ARC/INFO IMAGEGRID command. Default settings were used. Each statewide grid was then projected to NAD27, regridded to 30 meter resolution, and clipped by the buffered county boundaries. EPPL7 legend files were joined to the VATs. When resampling from 100 meter resolution to 30 meter resolution, the NEAREST option of the RESAMPLE function was used. The following geomorphology and geology grids were obtained from MGC100:
DEPTH30: Depth to bedrock outcrops, derived from DEPTHCRP: This layer was important for identifying bedrock outcrops in the Southeast Riverine counties for which we did not have outcrop maps. Values are provided in Table B.19. It should be noted that the data are very generalized. Moreover, when compared to Minnesota Geological Survey outcrop maps for the same area, they do not show the same outcrops.
GEOM30: Geomorphic regions, from the MGC100 layer GEOM (Section B.6.5.1). Values are listed in Table B.20.
LFORM30: Landforms from the MGC100 layer LANDFORM. Values are listed in Table B.21.
QUAT30: Quaternary geology (surficial deposits) from the MGC100 layer QUATGEO. Values are defined in Table B.22.
B.7.5.2 Watersheds
The DNR's file of major and minor watershed boundaries was received from LMIC in ARC/INFO export format. The file was imported to create the coverage WSHED23.
B.7.5.3 Bedrock Geology
Coverages of outcrops of bedrock formations that are sources of chert or galena were developed from a wide range of sources (Table B.2). Bedrock geology coverages for Fillmore (Mossler 1995) and Rice (Hobbs 1995) counties were obtained in digital format (ARC/INFO coverages) from the Minnesota Geological Survey. The source scale was 1:100,000. These coverages were in UTM meters, zone 15, NAD27, single precision with a y-shift of -4700000. They were projected to NAD83 and the y-shift was removed.
Winona (Balaban and Olsen 1984), Olmsted (Balaban 1988), and Dakota (Balaban and Hobbs 1990) counties were digitized from the Bedrock Geology sheets of their respective county geologic atlases (both 1:100,000 scale). Dodge, Goodhue, Mower, Wabasha, and Houston counties were digitized from the Geologic Map of Minnesota, St. Paul Sheet (Sloan and Austin 1966), at a scale of 1:250,000. Road layers from the MnDOT BaseMap were used to locate registration points when digitizing the paper maps. Bedrock was mapped at the Group level; formations were not mapped. When bedrock geology was digitized from paper maps for this project, only bedrock units of interest to this model were digitized. These units are listed in Table B.3. All other areas were coded as NA.
Bedrock exposures were digitized from the geologic atlases of Winona (Balaban and Olsen 1994), Fillmore (Mossler 1995), Dakota (Balaban and Hobbs 1990), Rice (Hobbs 1995), and Olmsted (Balaban 1988) counties. Bedrock exposures, among other features, are mapped on a Data BaseMap Sheet in those atlases. Only the exposures were digitized. Bedrock exposure maps were not available for the other counties. Data for these counties were taken from DEPTH30 (Section B.7.5.1).
Phase 2 data layers derived from bedrock data were:
BROCK100 or BROCK250: County bedrock geology (both coverage and grid) from 1:100,000 scale or 1:250,000 scale source maps. These data were converted only for counties in the Southeast Riverine Region (Phase 2). The values in the coverage attribute tables are detailed in Table B.23.
BEDROCK: The regional grid created from merging the county BROCK100 and BROCK250 grids. In converting these coverages to grids, GRP_CODE (Table B.23) was used as the VALUE item and the value 0 was set to NODATA.
EXPOSE: A coverage and a grid of bedrock exposures digitized from geologic atlases. Values in the EXPOSE grid are 1 for exposures and NODATA for all other cells.
EXPOSE30: Bedrock exposures taken from the MGC100 database DEPTHCRP layer.
BED_EXP: A regional grid created by merging EXPOSE (for counties for which it was available) with EXPOSE30 (where EXPOSE was not available).
ROCK_SRC: A regional grid of exposures of only bedrock sources that were of interest. This was an overlay of BEDROCK and BED_EXP. For Phase 3, procedures were changed:
- The EXPOSE grid was not used. Instead, potential outcrops of bedrock used for tools were assumed to occur where GALENA and PRAIRIE DU CHIEN formations intersected with steep slopes and deeply cut river valleys.
- The BEDROCK coverage was updated to include all areas within the Blufflands and Paleozoic Plateau subregions, including new data digitized for Fillmore, Olmsted and Winona counties. This added the Stewartville Galena and Oneota Dolomite from the Prairie Du Chien group to the bedrock formations of interest.
- These formations were reviewed by a project archaeologist and several were discarded from Phase 3 analysis (Table B.23).
BROCKFOR: Bedrock formation grid, created in Phase 3.Grid codes were assigned according to formation codes (FRM_CODE, Table B.23). BROCKFOR was used to calculate distances to bedrock outcrops of Galena and Prairie Du Chien formations. Outcrops were assumed to occur on steep slopes and in deeply cut river valleys.
B.7.5.4 DNR Landforms
The statewide DNR LANDFORM coverage was received in ArcInfo format. The original attribute table contained the following items:
- GEOMORPH: This is the full landform code, which is a combination of Glacial Association, Association Phase, Topographic Expression, Sedimentary Association and any qualifiers.
- GEO_ASSOC: A one-character code representing geomorphic association
- PHASE: A two-character code representing glacial phase, ice margin association or age.
- TOPO: A single digit code indicating general topographic expression
- SED_ASSOC: One character representing sedimentary association / rock type.
- QUAL: Additional Information or Qualifiers.
- SOURCE: Field that store information on the party responsible for delineating and/or assigning attributes to the feature.
To facilitate possible use of LANDFORM in conjunction with LSA coverage in the future, the LANDFORM attribute table was expanded to include 33 landform sediment assemblage coverage attribute items (Table 12.1). The project geomorphologist then compared the 1:100,000 DNR landform data to the 1:24,000 scale landform sediment assemblage coverages and LANDFORM item values were populated if possible. Further research will be required to populate the remaining items.
B.7.5.5 Landform Sediment Assemblages
Landform sediment assemblages were digitized from the paper maps produced from the geomorphologic investigations carried out as part of this project. Mapping methods and the landform classification are presented in Chapter 12.
Prior to digitizing, the following quality control procedures were conducted on the hard-copy maps:
- Determine the location of each quad received within the river valley and the appropriate background data that will be used to register each quad.
- Compare the map to adjoining quads. Make sure we have the adjoining materials. Check polygons along the edge to make sure they close and that coding is consistent across the map edges.
- Review for correct information. Verify that all polygons are closed and labeled. Questions about the interpretation of the map were directed to the map's originator by fax.
These maps were digitized in AutoCAD. They were registered to section lines, county borders, and roads, all taken from the MnDOT BaseMap, which had been y-shifted to preserve precision.
Digitizers were instructed to digitize only the pencil lines drawn on the quads and not to digitize any features from the quads. Existing river edges were used when necessary to close the penciled polygons. Thus, in a river valley, the river is its own polygon and all landforms are tied to the river. The outside boundaries of the study areas were closed and anything outside of the area was ignored.
The two- to six-letter codes used to label polygons on the paper map were entered as text in each polygon. These were used to make label points in the conversion to Arc/Info coverages. Where labels were missing, the text string "NA" was used as a temporary place holder until corrections were received from the project geomorphologists. The digitized work was then checked in ArcCAD for label and node errors. If errors were found, they were plotted and returned to the digitizer for correction.
When the digitized work was determined to be complete and error-free, the drawings were edgematched and converted to a single precision (y-shifted) coverage in ArcCAD. Text labels were included in the PAT item MAPCODE. Using MAPCODE as the common field, the PAT was joined with a dBASE table, provided by the geomorphologist, containing attributes for all possible codes in the study area's landform sediment assemblage classification.
The coverage was then Exported to the workstation as an ARC Export file and imported as a single precision coverage. We completed each study area (river valley or upland) in segments that included five to six quadrangles, then appended them into a single coverage. This single precision coverage was transformed to double precision, removing the y-shift in the process.
Phase 3 procedures included attribute code updates and combined interpretation of landform and archaeological data layers. Phase 1 and 2 coverages were updated with new codes.
B.7.6 Soils
The MGC100 EPPL7 file SOIL was converted using the same procedures as for the geomorphic data from the same source (Section B.7.5.1). The following grids were created:
SOIL30: Soil landscape units from MGC100 layer SOIL (Section B.6.6.1). Each soil landscape unit is coded with a four-letter designation that symbolizes the following factors:
- Texture of the soil material below 5 feet of the surface:
S = sandy
L = loamy or silty
C = clayey
X = mixed sandy and loamy
Y = mixed silty and clayey
R = bedrock
- Texture of the material in the first 5 feet below the surface, or a significant part of it:
S = sandy
L = loamy
C = clayey
- Drainage of the unit
W = well-drained (water table commonly below the rooting zone)
P = poorly drained (water table within the rooting zone)
- Color of the surface horizon:
D = dark-colored (associated with higher organic matter content)
L = light colored
SOIL_CAT: A grid of soil categories reclassified from SOIL30 for this project. Soil_cat recategorized SOIL30 from 64 down to 9 categories. Six categories of the 64 were unique: water, mines, marsh, steep and stony, alluvial, and rock. Using the drainage category listed above in SOIL30, all other soils categories were reclassed to either well-drained or poorly drained, based on the drainage code. Values are:
| 1 | Well-drained |
| 2 | Rock |
| 3 | Steep, stony, rocky land |
| 4 | Mines and/or dumps |
| 5 | Poorly-drained soils |
| 6 | Peat/bogs |
| 7 | Marsh |
| 8 | Alluvial soils |
| 9 | Water |
DRAIN30: A grid of soil drainage categories, created from the EPPL7 DRAIN file. Grid values are listed in Table B.24.
B.7.6.2 County Soil Surveys
Converting GIS Data
Soils data for 24 counties (Table B.4) were converted to ARC/INFO GRID format from EPPL7 format and projected from UTM NAD27, y-shift -4,700,000 to UTM NAD83, no y-shift. The procedure is the same as was used for the MGC100 database (Section B.7.5.1). Each EPPL7 file represented a township; these were merged to make up the counties. Soils grids had resolutions as small as 5 meters. This required aggregating cells by resampling to make 30 meter resolution grids. The resampling was preceded by running the FOCALMAJORITY function to create a grid containing the most frequently encountered soil value within a 15 meter radius (30 meter diameter circle) of each cell. The RESAMPLE function with the nearest neighbor was run on this grid. The functions used in these two steps were:
SOILS1 = FOCALMAJORITY(SOILS5M, CIRCLE, 15, NODATA)
SOILS = RESAMPLE(SOILS1, 30, NEAREST)
The resulting SOILS grid represents the most frequently encountered soil type within the 30 meter diameter circle centered on each cell, rather than the value of the soil type found at the cell centroid. In the final step, the legend file distributed with the EPPL7 database was then joined to the grid’s attribute table.
Soil surveys for three additional counties (Jackson, Martin, and Olmsted) were obtained in ARC Export format, tiled by township. These coverages were not edgematched. Both overlaps and gaps between coverages were present. To make them consistent with the EPPL7 files, they were converted to grids with a five meter resolution, merged, and then resampled to 30 meter resolution using the methods described above.
In addition, hydric soils only were digitized from hard copy county soil surveys for Nobles County.
Adding Attribute Data
The statewide 3SD digital database was obtained in ASCII format from the Natural Resources Conservation Service (NRCS). To make these files useable, they were edited to remove commas and, in some cases, blank spaces that were embedded in the items. This was done by searching for ", " (comma blank space) and replacing that with ";" (semi-colon). The files also had to be renamed to have a ".txt" extension.
One factor considered important in the prediction of archaeological site locations is the presence or absence of hydric soils. A statewide database in INFO format, SOILDAT, was created by joining the files MUCOACRE.TXT, HYDCOMP.TXT, and MAPUNIT.TXT in ArcView. The following items were exported to a new INFO file, STATEDAT:
- MUSYM:C: NRCS map units symbol. This identifier is unique only within each county.
- MUNAME:C: The soil type’s description, including other data such as erodibility or slope.
- HYDCRIT:C: A value (assigned by NRCS) denoting the criteria by which a soil qualifies to be classified as 'hydric' .
- MUID:C: The map unit ID, which is a concatenation of the county FIPS code and the map unit code. It is a unique identifier for the map unit within the state.
- CNTYCOD:C: County FIPS code.
A numeric item, HYDRIC, was added. This is a numeric value (1001) assigned to soil types considered to be hydric for this project. Criteria included all soils classified as hydric by NRCS except those classified only according to hydric criterion 2B3. Soils in qualifying soil orders that are poorly drained or very poorly drained and have a frequently occurring water tables at less than 1.5 feet from the surface for a significant period (usually more than 2 weeks) during the growing season if permeability is less than 6.0 in/h in any layer within 20 inches.
By using CNTYCOD:C to select all records for a county, a county SOILDAT INFO file was exported. In the county SOILDAT file, the item MUSYM:C (map unit symbol) is the same as the item SOILCODE in SOILS.VAT (derived from the EPPL7 legend file), so it can be used to create a join item. A character item, SOILCODE, was added to SOILDAT, and the value from MUSYM:C was moved to SOILCODE. SOILDAT was joined to the SOILS grid VAT using SOILCODE as the join item.
Other soil attributes were taken from the 3SD table LAYER.TXT, a statewide database of the characteristics of each layer of each soil map unit in Minnesota.
LAYER.TXT contains records for each soil layer within each soil map unit in Minnesota. Because there is more than one soil layer in each map unit, there is more than one record for each soil polygon. Moreover, there may be more than one sequence (seqnum = 1, seqnum = 2, or seqnum = 3). for each layer. For this project, only the surface layer (layernum = 1) was of interest, therefore surface layer data had to be extracted from LAYER.TXT.
In LAYER.TXT there were 9,085 records of surface layer data, but only 7,723 of these were unique soil map units. When the first sequence of the surface layer was selected, there were 7,663 records, each of them a unique soil map unit. With the second sequence of the surface layer selected, there were 1,272 records. Of these records, 1,212 were for soil map units, which also were in the first selection set. Sixty records were for soil map units that were not in the first selection set. By combining the two selection sets, all unique soil map units were assigned some surface soil data. In addition, there were 150 records with a third sequence for the surface layer. These records also had values for the first or first and second sequences as well.
To transfer data to the soil map, it was necessary to reduce the complexity of this table so that there was only one record for each unique soil map unit. Records for the first sequence of the surface layers of each soil map unit were selected and written to a new table. Then the second sequences of the surface layers of each soil map unit were selected and written to a separate table, which was then appended to the first. Finally, the third sequence of the surface layers of the soil map units were selected, written to a new table, then appended to the previously combined table. This combined table was exported to a new table, TOPSOIL.DBF.
TOPSOIL.DBF was joined to STATEDAT (the statewide INFO table containing variables for classification of hydric soils) to pick up the variables MUSYM_C, MUNAME_C and CNTYCODE_C.
The following new items were added to TOPSOIL.DBF:
- AVDEPTH: Mean depth to the lower boundary of the surface layer, expressed in inches
- TEXTURE: Soil texture class, code for the USDA texture for the surface layer.
- AVCLAY: Mean value for clay content of the surface layer, expressed as a percentage of the material less than 2 mm in size.
- AVAWC: Mean value for the available water capacity for the surface layer, expressed as inches/inch.
- AVOM: Mean value for organic matter content of the surface layer expressed in percent by weight.
- AVPH: Mean soil reaction (pH) for the surface layer, expressed as pH units.
- AVPERM: Mean permeability rate of the surface layer, expressed as inches per hour.
- SITESUIT: Suitability of soils for archaeological sites, based on textural class.
Values of these fields were based on the following decision rules:
- When only one sequence was present for the soil map unit, Mean
- Depth was assigned the value for that sequence.
- Where more than one sequence was present, Mean Depth was assigned the mean of the values for the sequences.
Textural class abbreviations and full names for each class are reported in Table B.25. Texture was assigned based on the value reported for sequence 1. If no value was reported for sequence 1, the value reported for sequence 2 was assigned. If no value was assigned for sequence 2, the value for sequence 3 was assigned. If none of the sequences reported a value for soil texture, a value was assigned based on interpretation of the map unit name. These map unit names and the textural classes assigned to them are listed in Table B.26.
The texture class VAR was used for a variety of map unit types. On the basis of the map unit names, these records were reassigned values of other classes. These are reported in Table B.27.
Clay content, available water holding capacity, organic matter content, pH, and permeability are all reported as ranges of values in LAYER.TXT. In other words, there are two variables for each of these measures, consisting of the minimum value of the range and the maximum value of the range. To reduce the number of variables, mean values were calculated by adding the minimum and maximum of each variable and dividing by two (if only one sequence is present) or by four or six where more than one sequence was present.
Suitability of soil texture classes for archaeological sites was classified by a project archaeologist (Table B.28).
Selected variables from TOPSOIL.DBF were then exported to the INFO file TOPSOIL, which has the following structure:
MUSYM_C (7 7 C)
MUID_C (8 8 C)
CNTYCODE_C (10 10 C)
AVDEPTH (4 4 I)
TEXTURE (10 10 C)
AVCLAY (4 4 I)
AVAWC (6 6 N 2)
AVOM (5 5 N 1))
AVPH (5 5 N 1)
AVPERM (6 6 N 2)
SITESUIT (4 4 I)
Replacing missing data
TOPSOIL had 311 records that contained no data for AVDEPTH, AVCLAY, AVAWC, AVOM, AVPH, and AVPERM. S-Plus (the statistical analysis software) will not accept NODATA values for any record. If a site or random point falls on a soil map unit for which there is no value for a variable, either the record or the variable would have to be removed from the analysis. To avoid this problem, values were assigned using the following decision rules:
- If there were other records for the same textural class, the mean of the values in these records was assigned to the records with missing data. For some of these classes, the means were based on several hundred records. For others, only a single record was available. These values are reported in Table B.29.
- The textural category DUMP was assigned the average values of the category FILL.
- The textural category BR (rough, broken land) was assigned the average of the numeric values for FL_L, FL_SIL, FL_SL, BY_L, BY_LCOS, and BY_SCL (various categories of steep, flaggy, and bouldery soil).
- The textural category DUNE was assigned soil depth of 60 (based on FILL) and all other numeric values based on average values of S (sand).
- BS (sand beaches) and B (beaches) were assigned values based on S (sand)
- BL (loamy beaches) was assigned all values based on L (loam).
- AQ (wet or ponded soils) with missing values were assigned values for AWC, organic matter, and pH based on ALL (alluvium). Values for clay were the average of the two AQ records with clay reported.
- WAT (water) and UWB (outcrop/quarry) records received zeros across the board.
An additional 355 records had no data for AVCLAY. Of these, 217 were classified as MUCK. Average values for other records with the same textural class were assigned to these records (see Table B.30). Several textural classes had no records reporting average clay. They were considered to be redundant with other textural classes and were assigned average values for those classes. FB was assigned the value of PEAT, HM was assigned the value of MUCK, and ST-MUCK was assigned the value of MUCK.
53 records had no data for AvAWC. They were assigned the average values of their textural classes (Table B.31).
53 records had no data for AvOM. They were assigned the average values of their textural classes (Table B.32).
25 records had no data for AvPh. They were assigned the average values of their textural classes (Table B.33). GR-S (gravelly sand) had no other records, so was assigned the average value of S (sand).
2 records had no data for AvPerm. They were assigned the averages values of their textural classes, which were UL = 479 and ALL = 425.
Data Layers Created from County Soil Surveys
SOILS: Soils grid from county soil surveys. Attributes are defined in Table B.34.
HYDRIC: Grid of hydric soils derived from the HYDRIC item in the SOILS grid. In the case of Nobles County, for which no digital soils data were available, hydric soils only were digitized from hard copy soil survey maps and converted to HYDRIC grids. Other counties in the prairie regions were modeled with the full component of soil variables, and variables derived from hydric soils did not figure into any new models. Based on this experience, it was determined that the chance of developing an improved model from this layer for Nobles County was small. Given time constraints, no soil enhanced model was attempted for Nobles County.
B.7.7 Vegetation
B.7.7.1 Marschner Map
The Marschner map of vegetation at the time of the Public Land Survey (1:500,000 scale) was digitized for the entire state by the DNR. We received a preliminary version of this data in ArcView shape file format. In this version, modern water bodies were inserted in place of Marschner's. These lakes altered or obliterated many adjacent polygons.
We converted the shape file to a single precision coverage, cleaned it with a fuzzy tolerance of .000001, converted the regions from subclass M to polygons, then created labels for the new coverage. After determining that the minimum mapping unit was greater than 10 acres, we eliminated polygons smaller than this (AREA < 4046.9) to remove slivers. We found six unlabeled polygons, gave them labels, and coded them by referring to a hard copy map. We then projected the coverage from NAD27 to NAD83, added a new item (CLASS 2 2 I) to the PAT, calculated CLASS to equal CLASS_BIN, and dropped a number of items from the PAT (CLASS_BIN, POLY#, POLY_ID, RINGS_OK, RINGS_NOK, MNOV4, MNOV4_ID, KEY, LPOLY#, RPOLY#, SUBCLASS#). We added a new item to the PAT (TYPE 40 40 C) and entered a description of the vegetation classes in that item. The attribute values in the PAT are listed in Table B.35. After making these changes, we clipped the statewide coverage by buffered county boundaries and converted the county coverages to grids. The coverage is named M_VEG.
B.7.7.2 Trygg Maps
Vegetation boundaries from Trygg maps , at a scale of 1:250,000, were digitized for comparison to Marschner 1:500,000 scale data. Conversion methods are documented in Section B.7.8. Sites of beaver dams were also digitized. Coverages are:
T_VEG: Vegetation types, lakes, fields, towns, and other polygon land cover features from Trygg maps. A complete list can be found in Table B.36. Breakings, clearings, and claims were all mapped as fields. When a county border or a river served as the boundary between polygons, the necessary lines were copied from a pre-existing layer, rather than digitizing these lines over again. To ensure that the vegetation layer was registered to other data layers, modern rivers, not those found on Trygg maps, were used to close polygons.
T_BEAV: Beaver dams from Trygg maps, digitized as points. There are no attributes. These features were not present in every county.
B.7.7.3 Tree Species Distributions
These extremely generalized data were provided by MN DNR as ARC/INFO coverages. The source scale is unknown, but probably worse than 1:1,000,000. Some were point coverages and others were line coverages. State boundaries (arcs) were removed from the point coverages, and all coverages were projected to NAD83. The coverages were then converted to grids. These data were used only in Phase 2.
CRAN_BER: Distribution of highbush cranberries. This species was selected as a potential food source. This is a point coverage and a grid.
KEN_COFF: Distribution of Kentucky Coffee Trees. This species was selected because its distribution in Minnesota suggests a pattern of dispersal by humans. This is a polygon coverage and a grid.
P_BIRCH: Distribution of Paper Birch. This species was used to make a number of important cultural items, including canoes and containers. This is a polygon coverage and grid.
SU_MAPLE: Distribution of sugar maple. This species was selected because it was an important food source associated with seasonal camps. This is a point coverage and a grid.
These data were used only in Phases 1 and 2. They were replaced by bearing tree data in Phase 3.
B.7.7.4 Bearing Trees
BTREEPT3 is a point coverage of bearing trees used as references or landmarks during the original Minnesota Public Land Survey (PLS). Surveyors collected a variety of information about bearing trees that aid in their use as indicators of vegetation conditions present at the time of the survey. This includes diameter, direction and distance from monument, township, range, and sub-township reference. BTREEPT3 was used to create two grids: the locations of paper birch and of sugar maple. These were used in Phase 3 in place of the P_BIRCH and SU_MAPLE grids derived from tree species distribution data.
BTVEGPT3 is a point coverage of vegetation type as recorded by surveyors. Categories roughly correspond to a combination of vegetation community and landscape position. This coverage was not used for modeling.
The collection of information on tree species and vegetation community typing was an ancillary activity for surveyors, and the accuracy of species identification is known to suffer as a result.
Trygg maps were digitized in AutoCAD from paper maps, published at a scale of 1:250,000. These were registered to section lines and county boundaries from the MnDOT BaseMap, which had been y-shifted to preserve precision. Digitizers followed black lines on the Trygg maps. In some cases, in the printing process, colored lines or shading corresponding to features drawn with black lines were not in alignment. In these cases, the colored lines and shades were used only for distinguishing between different types of features. In digitizing, each polygon was given a text label that became its label point and attribute.
Several separate layers were digitized, each representing features that may have been relevant to population distributions and cultural activities in the precontact and early contact periods. Several layers that were digitized were never converted to coverages because the data were inconsistent and incomplete. These included boundaries of Indian reservations, townships coded by date of survey, and miscellaneous features that did not fit in other categories. The latter category included such features as "good river for driving logs" and hills labeled with Native American names. The AutoCAD drawings of these digitized features were archived.
After digitizing, node and label errors of polygon layers were checked in ArcCAD. Plots of these were returned to the digitizers so that errors could be corrected. When all such errors were corrected, a color plot of all features was produced for comparison to the original paper maps to check for content errors.
When all digitizing errors were corrected, drawings were converted to coverages in PC Arc/INFO or ArcCAD. Text entities were captured as label points in point and polygon coverages. AutoCAD layer names were captured as attributes in line coverages. These captured attributes were used to join the tables to the complete attribute tables which were maintained separately. These separate attribute tables were updated when necessary to include new feature types that were encountered in digitizing. These single precision coverages were then converted to ARC Export files and imported into Arc/INFO, where they were transformed to double precision coverages with the y-shift removed. Coverages were later converted to grids for modeling.
Coverages were created for the following digitized features:
T_CULT: Cultural features at the time of the General Land Survey, represented as points. These features were represented on the source maps by a variety of symbols and were usually labeled with identifying text. They include Native American sites (villages, sugar camps) as well as sites of Euro-american origin (houses, cabins, ferries, mills, bridges, churches, fences and more). A complete list of features can be found in Table B.37.
T_RDS: Roads and trails, represented as lines. Because town streets were considered to be schematics, they were not included in this coverage. Towns were instead digitized as polygons in the vegetation layer. Road types are listed in Table B.38.
T_RICE: Wild rice sites from Trygg maps, digitized as points. Wild rice sites are designated only by text on the Trygg maps. In some cases, there was an arrow pointing to the wild rice site. If so, we digitized the point at the end of the arrow, just inside the edge of the marsh or slough it pointed to (since wild rice grows along the edges in the shallower water). In some cases, though, there is no arrow. Usually these are smaller marshes or sloughs, so the point was placed in the middle of the feature. There are no attributes. This layer is not present in every county.
T_CLAIM: Settlers claims from Trygg maps, digitized as polygons. These are identified by text labels on the source maps. They were not present in every county. Town sites were also included in this layer. Attribute values are listed in Table B.39.
B.7.9 Paleoclimate
B.7.9.1 Paleoclimate model
Text files, as received (Section B.6.9.1) were taken into an electronic spreadsheet. Longitudes were changed to negative numbers to indicate they are west of the prime meridian. Temperature and precipitation values were reformatted as integers. The text files were loaded into ArcView as tables. An event theme was generated using the latitude and longitude coordinates. This event theme was then saved as a shape file. The shape file was converted to an ARC/INFO coverage, which was projected from decimal degrees to UTM, zone 15 extended, NAD83. In the course of these procedures, the column headings were changed from having a leading "-" to having a leading "z", in other words "-100" became "z100".
The six climate variables are in six ARC/INFO coverages:
ANN_PPTN
ANN_TEMP
WIN_PPTN
WIN_TEMP
SUM_PPTN
SUM_TEMP
These are all statewide point coverages of weather stations with annual, winter, and summer precipitation and temperature data. Each attribute field is the modeled value for one time slice (Z is the present, Z100 is 100 B.P., Z12100 is 12,100 B.P.). The value for the present is derived from the last 30 years of climate records for that station. The other values are the results of applying Reid Bryson’s paleoclimate model to the same 30 years of recorded data. From these points, surfaces (grids) were created representing:
7000 B.C. (Z9000)
6000 .BC. (Z8000)
4000 B.C. (Z6000)
A.D. 1000 (Z1000)
A.D. 1400 (Z600)
The Present (Z)
A new item was added to each grid for each of the above time slices. Because the climate model was run for 200 year time slices, some of the dates of interest were not represented in the database (i.e. 500 B.P. and 700 B.P. are represented, but not 600 B.P.) To get values for these dates, values for dates around them were averaged.
Statewide grids (100 m cell size) were created from the point coverages by interpolating surfaces between sample points. After experimenting with several functions, SPLINE was selected for this task (see the discussion in Chapter 6).
The naming convention for the new grids was:
Var_Time where:
VAR refers to the climate variable modeled, according to the following list:
| Original GRID | New Grid Prefix |
| ANN_PPTN | AP |
| ANN_TEMP | AT |
| WIN_PPTN | WP |
| WIN_TEMP | WT |
| SUM_PPTN | SP |
| SUM_TEMP | ST |
TIME refers to the time slice, according to the following list:
| Original variable | New grid suffix |
| BP9000 | 9000 |
| BP8000 | 8000 |
| BP6000 | 6000 |
| BP1000 | 1000 |
| BP600 | 600 |
| Z | 00 |
B.7.9.2 Pollen Data
For the pollen data files (Section B.6.9.2) to be made useful, they were renamed to the standard 8.3 DOS convention, which was required for most Windows environments at the time. The first row, containing the number of records, was replaced by a header indicating the variable names. Finally, any empty rows or special characters at the end of the file were deleted.
Statewide point coverages were created for the data of interest. This was accomplished by creating event themes in ArcView, then converting these to shape files. The shape files were then converted to ARC/INFO point coverages. Coverages were projected from lat/long to UTM zone 15 NAD83. Integer grids were made from the point files with pollen percentage as the VALUE. Grids for five 100-year time slices were merged to obtain as much data as possible for each of the time periods selected for analysis. A point coverage was made from each merged grid and surfaces interpolated from this coverage using TREND. Refer to Chapter 6 for a discussion of the selection of an interpolation technique. The naming convention for these pollen time slice surfaces was an abbreviation of the species name, followed by the number of years before present represented.
B.7.9.3 Difference grids
For both climate and pollen data, grids were constructed to illustrate the difference between values at each time slice and present values. These grids were used for analysis and illustration (Chapter 6). For pollen data, the "present" was represented by data for 100 B.P. Grids representing the present were subtracted from paleoclimate and pollen grids for each time slice. These difference grids were given the same name as the variable grid, with D added at the end. For pollen grids, only the first three letters of the species name were used to keep the earlier time periods from having nine character grid names. For example:
| DIFFERENCE GRID | VAR_TIME GRID | VAR_PRESENT GRID |
| AT600D | AT600 | AT00 |
| AT9000D | AT9000 | AT00 |
| BIR600D | BIRC600 | BIRC100 |
| BIR9000D | BIRC9000 | BIRC100 |
B.7.10 Disturbance
Surface disturbance data came from MGC100. The conversion methods for these grids are discussed in Section B.7.5.1.
MINES: This grid, depicting mine pits and dumps, is derived from the resampled quaternary geology grid (QUAT30). Cells coded as mines (QUAT30 = 1) are assigned a value of 1, while all other cells in the region are given a NODATA value (Section B.6.10.1).
WATRER30: A grid derived by converting the MGC100 EPPL7 layer WATREROS to Arc GRID format and resampling to 30 meter resolution. We hoped to incorporate this into the model to determine where archaeological sites, if they exist, are likely to be disturbed. It could not be used for Mn/Model because it contained NODATA values in some areas (Section B.6.10.2).
WINDER30: A grid derived by converting the MGC100 EPPL7 layer WINDEROS to Arc GRID format and resampling to 30 meter resolution. We hoped to use this grid to identify where wind ablation may have uncovered artifacts near the surface. However, could not be used because there were NODATA values in some areas. Values are the same as WINDEROS (Section B.6.10.3).
SED30: A grid derived by converting the MGC100 EPPL7 layer SED to Arc GRID format and resampling to 30 meter resolution. We hoped to use this grid to identify where archaeological sites might have been buried below recent sediment. However, LSA data (Chapter 12) provide much higher resolution information. Values are the same as SED (Section B.6.10.4).
B.8 OPERATIONALIZING VARIABLES
Variables are identified in this report by descriptive names (in italics). In this section, these names are followed by the name of the GRID (all caps, in parentheses) used in modeling.
Table B.40 lists all the variables used in each phase of Mn/Model.
B.8.1 Regions
B.8.1.1 Archaeological Regions
In Phases 1 and 2, data were converted by county and counties were assembled into Archaeological regions (Section B.6.1.1 and Table B.6) before deriving variables. When all grids of one type were completed for all counties in a region, they were merged. The merge was followed by clipping out (SELECTPOLYGON) the region using the REG#_BUF coverage. This resulted in grids that included a 1000 meter buffer around the region. The buffer is used so that all key resources within a reasonable proximity are considered when distance to resources or variability grids are calculated. The order of the grids in the merge function should not matter. Because of the buffer around each county, the grids should overlap and the first grid in the list will take precedence. Since the grids were all created from the same base data, they should have the same values in the overlapping areas.
B.8.1.2 Ecological Classification System
In Phases 3, Ecological Classification System subsections (Section B.6.1.2) were the basis for regionalization of the models. The subsections were classified into nine modeling regions of similar size (Table B.7) . Phase 2 county data were assembled into these nine larger regions to facilitate variable derivation. The merge was followed by clipping out (SELECTPOLYGON) the region using the modeling region's BUFF10K coverage. This resulted in grids that included a 10,000 meter buffer around the modeling region.
B.8.2 Archaeological Sites and Surveys
Archaeological site variables consisted of simply the presence or absence of archaeological sites. Because of low site numbers and incomplete site data, no attempt was made to model sites by type of site, age of site, or any other factor that could distinguish between sites. In all phases, single artifacts were excluded from the category "site present." In Phase 2, additional models were built excluding both single artifacts and lithic scatters from "site present." Site absence was represented in Phase 1 by negative survey locations. In Phases 2 and 3, site absence was represented by the locations of random points.
Because archaeological site presence or absence is the dependent variable in the model, it is encoded in a sampling grid, with values of one for site presence and zero for site absence. All other cells in the grid contain NODATA. This sampling grid is used in the SAMPLE function that precedes each linear regression. The following sampling grids were used to model archaeological site potential:
SAMPLE21: A grid assigning a value of one to all sites that were part of probabilistic, qualified CRM, or Phase III surveys (significant sites), except single artifacts, and zero to all negative survey points. This grid was used in building the Phase 1 models. To create this grid, we first added an item to ARCHDATA.VAT (SITE 4 4 N 0). The variable SITE is then coded to be 0 for negative survey points, 1 for archaeological sites except single artifacts, 2 for single artifacts, and 3 for sites not from probabilistic, qualified CRM, or Phase III surveys (significant sites). A new grid is created from ARCHDATA, using the SITE value. All cells with the value "3" (other sites) are set to NODATA.
SAMPLE22: Like SAMPLE21, except that this grid contains all sites that were part of probabilistic, qualified CRM, or Phase III surveys (significant sites), except single artifacts and lithic scatters, and all negative survey points. Create the grid in the same way, but also code lithic scatters as "3". This grid was used in Phase 1 to test options for Phase 2 methods.
RAND21: A grid containing all sites that were part of probabilistic, qualified CRM, or Phase III surveys (significant sites), except single artifacts, and all random points from RANDPTS. This grid was used in building the Phase 2 models excluding single artifacts. To create this grid, code the variable SITE to be 3 for negative survey points, 1 for archaeological sites except single artifacts, 3 for single artifacts, and 3 for sites not from probabilistic, qualified CRM, Phase III surveys (significant sites). Make a new grid from ARCHDATA, using the SITE value. Set all cells with the value "3" (other sites) to NODATA. Merge this grid with the RANDPTS grid, then set the values from the RANDPTS grid ("99") to "0".
RAND22: A grid containing all sites that were part of probabilistic, qualified CRM, or Phase III surveys (significant sites), except single artifacts and lithic scatters, and all random points from RANDPTS. Create the grid in the same way, but also code lithic scatters as "3"when you code the SITE field in ARCHDATA. This grid was used in building the Phase 2 models excluding both single artifacts and lithic scatters.
HALF1: A grid of the first randomly selected half of all known archaeological sites except single artifacts (coded "1") and the first randomly selected half of all random points (coded "0"). This grid was used to build the first HALF site probability models in Phase 3.
HALF2: A grid of the second randomly selected half all known archaeological sites except single artifacts (coded "1") and the second randomly selected half of all random points (coded "0"). This grid was used to build the second HALF site probability models in Phase 3.
ALLSITE: A grid of all known archaeological sites except single artifacts (coded "1") and all random points (coded "0"). This grid was used to build the final Phase 3 site probability models.
SAMPGRID: A master grid of all sample points created by merging ARCHDATA and RANDPTS, using unique id's as the grid value. This grid was used in Phase 3 for creating a master database of environmental variables and model values for statistical analysis and model evaluation.
B.8.2.2 Negative Survey Locations
Negative survey locations were used in Phase 1 to represent the variable "site absence" (Section B.8.2.1). After realizing that their distribution was similar to that of known archaeological sites, they were replaced in this function by random points in Phase 2. In Phase 3, negative survey locations and locations of all known archaeological sites were used to represent the variable "survey present" for construction of the survey probability models. "Survey absent" was represented by random points. The sampling grids created for use in developing the Phase 3 survey probability models were:
SURVEY1: A grid of the first randomly selected half of surveyed places (negative survey locations and known sites of all kinds, coded "1") and the first randomly selected half of all random points. This grid was used to build the first HALF survey probability models in Phase 3.
SURVEY2: A grid of the second randomly selected half of surveyed places (negative survey locations and known sites of all kinds, coded "1") and the second randomly selected half of all random points. This grid was used to build the second HALF survey probability models in Phase 3.
ALLSURV: A grid of all surveyed places (negative survey locations and known sites of all kinds, coded "1") and all random points. This grid was used to build the final survey probability models in Phase 3.
Variables derived from elevation data include:
Absolute elevation (ABL) was used as a variable as well as a data source for deriving other variables. The derivation of ABL is discussed in Section B.7.3.
Prevailing orientation (BLG) is a function of aspect. Aspect is defined as the down-slope direction of the maximum rate of change in value from each cell to its neighbors. The algorithm used in GRID to calculate aspect is: tan(aspect) = -( z / y) / ( z / x). Values of aspect are compass direction (0 = north-facing, 180 = south-facing). BLG measures the orientation towards south (180 degrees). The lower the value, the less the deviation from south. Therefore, BLG is the absolute value of the difference between ASPECT and 180. For digital elevation models that exhibit banding, aspect is derived from a filtered version of the elevation data (FILT5, Section B.7.3).
Height above surroundings: (HT90) is measured as the difference in feet between a cell’s elevation and that of the lowest cell within 90 meters (a three cell radius). Positive values indicate cells that are higher than their surroundings. Negative values indicate cells that are lower than their surroundings.
Solar Insolation (INSOL) was derived from elevation for the situation at noon on the shortest day of the year (December 21 or winter solstice), using the HILLSHADE function. On the shortest day of the year the azimuth is 180 degrees (south), the solar altitude in Minnesota between 18.5 and 22.5 degrees (depending on latitude, Table B.41), and the value of INSOL is a function of both incident light and the effects of shadowing. The z-factor (0.3048) converts the elevation units (feet) to meters to be consistent with horizontal units. Output values can range from 0 (no insolation) to 255 (full insolation, with the sun orthogonal to the surface).
Relative elevation within 90 meters (REL90A) is the absolute value of the maximum vertical elevation change within a 90 meter radius. This is calculated as the difference between the elevation of the cell and the elevation of the highest or lowest cell within 90 meters, whichever is largest. There are no negative values.
Surface roughness (RGH90), derived from absolute elevation, slope, and relative elevation, using weights and constants derived by Hammer (1993). It is calculated by the formula: RGH90 = ((ABL * 0.3048) + (SLP * 6) + (REL90A * 0.6096)) / 2
Slope (SLP) identifies the maximum rate of change in values between each cell and its neighbors. It is measured in degrees. The algorithm used by grid to calculate slope is: tan(slope) = [( z / x)2 + ( z / y)2]1/2. The z-factor, 0.3048, is used to convert the elevation units (feet) to meters so that they are consistent with the distance units.
B.8.4 Hydrology
B.8.4.1 Edge Detection
A number of the variables we derived are distances from the edges of key resources. First, this requires setting the values of the key resource cells to some number and setting the values of all other cells in the county or region (including any that may have NODATA values) to another number. The resulting grid should have two values. The only NODATA cells will be outside the county or region of interest. Detect the edges of these features using the FOCALVARIETY function. Edges will be cells with more than one value within a three by three cell neighborhood. Therefore, any cells with values of 1 are not edges and should be set to NODATA. Assign the remaining edge cells a value of 1. Use the EUCDISTANCE function to calculate the distances from every cell in the grid to the edge cells.
In some cases detecting edges of one feature (such as wetlands) involved excluding the edges that were shared with certain other features (such as lakes). This was done because edges between lakes and wetlands are accounted for in the "distance to edge of lakes" variable. Including them again in the "distance to edge of wetlands" variable would be redundant. To exclude specific feature edges, first detect the edges of the first feature of interest (e.g. marshes). Assign them a value of 1. Then detect the edges of the other features of interest (e.g. lakes and rivers) and assign them a different value, such as 2. Merge the two grids, giving precedence to the grid with edges you wish to exclude. Thus the value 2 will overwrite the value 1 wherever they occur in the same location. Finally, set all cells in the combined grid with a value of 2 to NODATA. The only cells remaining contain data indicating the marsh edges that adjoin uplands.
B.8.4.2 Detecting Confluences
This is very much like edge detection. First, make grids of the features that intersect, assigning each feature a different value. For instance, to detect confluences of lakes and streams, make a grid where all lakes have the value 1 and another where all streams have the value 2. All other cell values should be NODATA. Merge these two grids, then use FOCALVARIETY to determine where cells with values of 1 are adjacent to cells with values of 2. Their FOCALVARIETY value will be 2. These are these are the confluences.
When detecting confluences of streams with wetlands, it is important to merge the stream and wetlands grids with the wetlands taking precedence. This will overwrite any streams that flow through wetlands. The confluence will then be detected where the streams enter and leave the wetlands, and not along the entire stream course as it flows through the wetland.
B.8.4.3 Distances to Surface Hydrology Features
All distance values are calculated as Euclidean distance in meters. The following variables were derived:
Distance to the edge of the nearest large lake (DED_BLK1). These include permanent large to very large lakes.
Distance to the edge of the nearest large wetland (DEDBWET1). Large wetlands are defined as large to very large permanent wetlands from the WET1 grid. Edges of wetlands that were adjacent to lakes or rivers were eliminated, restricting analysis to edges between wetlands and dry land.
Distance to edge of nearest lake, wetland, or area of organic soil (DED_COR). This measures distance to the nearest water body, where water is a composite of lakes and wetlands from NWI and organic soils from MGC100.
Distance to edge of nearest lake, wetland, area of organic soil, or stream (DED_CORS). This measures distances from the nearest water body, where water is a composite of lakes, wetlands and rivers from NWI, organic soils from MGC100, and streams from the MnDOT BaseMap.
Distance to edge of nearest lake (DED_LK1). This includes lakes of all sizes, as well as both permanent and seasonal lakes.
Distance to edge of nearest marsh (DED_MRSH). Marshes extracted from NWI, with lake and river edges excluded for this analysis.
Distance to edge of nearest river (DED_NWIR). These are the major rivers in the state, including both permanent and seasonal rivers. They are large enough to be represented as polygons on 1:24,000 scale maps, so are taken from the National Wetlands Inventory.
Distance to edge of nearest permanent lake (DED_PLK1). These include permanent lakes of any size.
Distance to edges of nearest perennial river (DED_PRIV). Perennial rivers are defined as permanent rivers from NWI and perennial streams from the MnDOT BaseMap.
Distance to edge of nearest river or stream (DED_RIV). This includes both perennial and intermittent streams from the MnDOT BaseMap and double line rivers from NWI.
Distance to edge of nearest swamp (DED_SWM). These include both shrub and tree swamps from NWI.
Distance to edge of nearest wetland (DED_WET1). These include permanent and seasonal wetlands, both marshes and swamps. Edges shared with lakes and rivers are excluded for this analysis.
Distance to nearest intermittent stream (DINT). Intermittent streams are from the MnDOT BaseMap.
Distance to nearest perennial streams (DPER). These include only perennial streams from the MnDOT BaseMap.
Distance to nearest lake or wetland inlet/outlet (INOUT). These are places where rivers, perennial streams, or intermittent streams flow into or out of lakes or wetlands.
Distance to nearest lake inlet/outlet (LK_INOUT). These are places where rivers, perennial streams, or intermittent streams flow into or out of lakes.
Distance to permanent lake inlet/outlet (LKPINOUT). These are junctions of permanent lakes with perennial streams or rivers.
Distance to confluences between perennial streams and double line rivers (PER_CONF). These are places at which perennial streams and double line rivers connect.
Distance to confluences between perennial and intermittent streams and double line rivers (RIV_CONF). These include confluences between double line rivers and other river classifications (perennial and intermittent).
Distance to confluences between streams of different classes (STR_CONF). Distances include confluences between double line rivers and smaller streams, as well as confluences between perennial streams and intermittent streams.
Distance to wetland inlet/outlets (WT_INOUT). These are locations where perennial or intermittent streams enter or leave wetlands. Double line rivers are excluded.
Distance to permanent wetland inlet/outlets (WTPINOUT). These are places where perennial streams feed or drain permanent wetlands.
B.8.4.4 Direction to Surface Hydrology Features
For all direction variables, values are measured in degrees ranging from 0 to 360, with 0 = north, 90 = east, 180 = south, and 270 = west. Variables are:
Direction to nearest permanent water (DIR_PWAT). Water bodies include permanent double line rivers, perennial streams, and permanent lakes.
Direction to nearest water (DIR_WAT). Water bodies include all lakes and streams, including seasonal and intermittent ones.
Direction to nearest water or wetland (DIR_WW). These include all lakes and streams, including seasonal and intermittent ones, and wetlands.
B.8.4.5 Size of Surface Hydrology Features
For size variables, values are measured in square meters.
Size of nearest lake (LK1_SIZE). These include all lakes, both permanent and seasonal.
Size of nearest permanent lake (PLK1SIZE). These include all permanent lakes.
B.8.4.6 Vertical Distance to Surface Hydrology Features
Vertical distance to water grids are derived from both hydrology and elevation data. Distances are measured in feet. These grids measure the difference between the elevation of each cell and that of the nearest water body. The number may be negative, if the cell is lower than the nearest water.
Vertical distance to nearest water (VAW1). These water bodies include all lakes, streams, and rivers.
Vertical distance to nearest permanent water (VPW1). Permanent water bodies include only permanent lakes, permanent double line rivers, and perennial streams.
B.8.5 Geomorphology and Geology
B.8.5.1 MGC100
The following variables were derived from MGC100 geomorphic data:
On alluvium (ALLUV). Holocene alluvium was derived from the MGC100 quaternary geology grid, QUAT30. Cells are either on alluvium (VALUE = 1) or not (VALUE = 0)
On colluvium (COLL). Holocene to Pleistocene colluvium was derived from the MGC100 quaternary geology grid (QUAT30). Cells are either on colluvium (VALUE = 1) or not (VALUE = 0).
On lake sediment (LK_SED). Areas of glacial lake sediment and lake modified till were derived from MGC100 quaternary geology (QUAT30). Cells are either on lake sediment (VALUE = 1) or not (VALUE = 0).
Distance to glacial lake sediment (DIS_LKSED) was measured to the nearest area of lake sediments (LK_SED).
On peat (PEAT). Holocene peat from the MGC100 quaternary geology grid (QUAT30). Cells are either on peta (VALUE = 1) or not (VALUE = 0).
On terraces (TERR). Holocene to Pleistocene terraces derived from the MGC100 quaternary geology grid (QUAT30). Cells are either on terraces (VALUE = 1) or not (VALUE = 0).
River valley mask (RIV_VAL1). This river valley mask grid was made to separate uplands from river valleys so that they could be modeled separately in the Phase 1 pilot project. The source is the MGC100 landforms (LFORM30). In this grid, cells in river valleys have a value of 1. All other cells have a value of NODATA.
Uplands mask (UPLANDS1). The uplands mask grid is a counterpart to the river valley mask. Uplands have a value of 1. All other cells contain NODATA.
B.8.5.2. Watersheds
The following variables were derived from the state watersheds coverage (WSHED23):
Distance to nearest major ridge or divide (DIS_MAJ). Major ridges define the boundaries of the upper level watersheds in the classification system.
Distance to nearest minor ridge or divide (DIS_MIN). Minor ridges define the boundaries of smaller watersheds that are subdivisions of the major watersheds.
Size of major watershed (MAJ_AREA). Area, in square meters, of the major watersheds.
Size of minor watershed (MIN_AREA). Area, in square meters, of the minor watersheds.
B.8.5.3 Bedrock Geology
The following variables were derived from bedrock geology and outcrop data:
Distance to bedrock exposures (DIS_ROCK) of rock formations used as sources of tools. This variable was used only in the Southeast Riverine and Southwest Riverine Regions in Phase 2. In Phase 3, this variable was used only in ECS subsections The Blufflands, Rochester Plateau (Paleozoic Plateau), Oak Savanna, Twin Cities Highlands.
Depth to bedrock (DEPTH30) describes the depth to bedrock and the areas of significant outcrops.
Calculated distances to bedrock, used for tools in southeastern Minnesota, give a misleading impression of large distances at the north of the subsection where no data for Washington County were available. Distances were actually calculated to bedrock formations in Dakota County. The Blufflands subsection models are affected - they show higher site potential further away from bedrock used for tools. Now the Washington County bedrock map is available from MPCA FTP site ftp://kono.pca.state.mn.us as part of the Metro database.
B.8.5.4 DNR Landforms
The DNR LANDFORM coverage was received too late to be used in Phase 3 modeling. In Phase 4, it will replace MGC100 for deriving geomorphic variables.
B.8.5.5 Landform Sediment Assemblages
Landform Sediment Assemblages (Chapter 12 and Section B.6.5.5) were used for modeling only in the Nicollet County pilot. They were used to derive the same variables as were derived from MGC100, but at a higher resolution. The Minnesota River Valley within Nicollet County was modeled separate using these variables. This experiment did not prove fruitful, and separate modeling of river valleys was discontinued.
The final classification table, coverage attributes, and Landscape Suitability Rankings (LSRs) were not available soon enough for these data to be incorporated into Phase 3 modeling. In Phase 4 of Mn/Model, the surface LSRs will be incorporated into the final models. These data will indicate where, at the surface, archaeological sites are not likely to have been left in situ. All other areas will be coded by archaeological site potential classes.
B.8.6 Soils
For soil variables, distances are measured as Euclidean distance in meters.
B.8.6.1 MGC100
Soil variables derived from MGC100 data include:
Distance from well-drained soils (D_DRA30). The well-drained soil classification is created from low resolution (MGC100) soils data. It is derived from SOIL_CAT.
Distance to edge of nearest large area of organic soils (DED_BO30). Organic soils include marsh and peat bog soils derived from the SOIL_CAT grid. These are defined as organic soils with an areal extent greater than 120 acres or 485,640 square meters. Edges of organic soil polygons that were adjacent to wetlands, lakes or rivers were eliminated, restricting analysis to edges between organic soils and dry land.
Distance to edge of nearest area of organic soils (DED_OR30). These are all organic soils derived from the SOIL_CAT grid.
Soil drainage (DRAIN30). Values are a continuous classification of soil drainage categories, derived from an interpretation of GEOM30 and SOIL30. Because this dataset contained NODATA values in some counties, it could not be used to build models in all regions. Values are listed in Table B.24.
B.8.6.2 County Soil Surveys
The following variables derived from soil survey data were used only in Phase 2 soils-enhanced models:
Distance to edge of nearest hydric soils (DED_HYD). Hydric soils are defined by the HYDRIC item in the high resolution soils grid (SOILS).
Distance to edge of nearest large area of hydric soils (DED_BHYD). Hydric soils are derived from high resolution soils data (SOILS). Large areas of hydric soils are defined as 120 acres or more.
Distance to edge of nearest lakes, wetlands, or hydric soils (DED_CHY). Distances are measured to the edge of hydric soils, derived from high resolution county soil surveys (SOILS), or to the edge of the nearest lake or wetland, whichever is closer.
Distance to edge of nearest lakes, wetlands, hydric soils, or streams (DED_CHYS). These include hydric soils, lakes, wetlands, and streams. The hydric soil class was extracted from high resolution soils (SOILS).
Soil depth (SOILDEP). Values are from the AVDEPTH item in the high resolution (SOILS) grid.
Clay content (CLAY). Values are derived from the AVCLAY item in the high resolution soils (SOILS) grid.
Available water holding capacity (AWC). Values are derived from the AVAWC item in the high resolution soils (SOILS) grid.
Organic matter content (ORGMAT). Values are derived from the AVOM item in the high resolution soils ( SOILS) grid.
Soil pH (SOIL_PH). Values are derived from the AVPH item in the high resolution soils (SOILS) grid.
Soil permeability (PERMEABL). Values are derived from the AVPERM item in the high resolution soils (SOILS) grid.
Soil suitability for archaeological sites (SITESUIT). Values are derived from the SITESUIT item in the high resolution soils (SOILS) grid.
The following additional variables from county soil survey data were used in Phase 1 Nicollet County Pilot:
Soil diversity within 510 meters (SLDIV510): The number of soil classes within 510 meters of each cell.
Soil diversity within 90 meters (SLDIV90): The number of soil classes within 90 meters of each cell.
Soil diversity within 990 meters (SLDIV990): The number of soil classes within 990 meters of each cell.
B.8.7 Vegetation
B.8.7.1 Marschner
The following variables were derived from the marschner map (M_VEG):
Distance to aspen woodland (DIS_AS). Distance to aspen woodland types.
Distance to woods (DIS_WOOD). Distance to woodland vegetation types, not including swamps.
Distance to Big Woods (DIS_BW). Big Woods, in Minnesota, refers to mesic hardwood forest dominated by maple, basswood, and elm.
Distance to oak woodland (DIS_OK). Oak woodland includes oak openings and oak barrens.
Distance to river bottom forest (DIS_RB). Theses are riverine hardwood forests dominated by cottonwood, soft maple, and ash.
Distance to prairie (DIS_PR). Tall grass prairie predominated in Minnesota.
Distance to brushland (DIS_BR). Brushlands may have been the result of burning woodlands.
Distance to aspen-birch (DIS_ASBI). This includes both categories (hardwood and conifer) of aspen-birch.
Distance to mixed hardwood and pine (DIS_MIX). These are forests containing substantial components of both hardwoods and conifers.
Distance to pine forest (DIS_PINE). Distance to white pine and white and Norway pine forest.
Distance to pine barrens, openings, and flats (DIS_PIBF). Distance to jack pine barrens and openings, and pine flats.
Distance to conifers (DIS_CON). Distance to mixed hardwood and pine, white pine, white and Norway pine, Jack pine barrens and openings, pine flats, and aspen-birch (conifer).
Distance to hardwood forest (DIS_HDW). Distance to Big Woods, River Bottom Forest, and Aspen-Birch (hardwoods).
Vegetation diversity within 1/2 km (MRDIV510), defined as the number of vegetation types within 510 meters. This variable was used in Phase 2 only.
Vegetation diversity within 1 km (MRDIV990), defined as the number of vegetation types within 990 meters.
B.8.7.2 Trygg
The following variables were used only in Phase 2 models enhanced by data from Trygg maps:
Distance to beaver sites (DIS_BEAV).
Distance to grassland (DIS_GRS), either prairie or meadow.
Distance to wild rice site (DIS_RICE).
Distance to woodland (DIS_WDS). This included any wooded land, except swamp, from Trygg maps.
Vegetation diversity within 1/2 km (TRDIV510), defined as the number of different vegetation types within 510 meters, from Trygg maps.
Vegetation diversity within 1 km (TRDIV990), defined as the number of vegetation types within 990 meters, from Trygg maps.
B.8.7.3 Tree Species Distributions
The following variables were derived from forest tree species data (Section B.6.7.3) and were used for Phase 2 modeling:
Distance to Kentucky coffee tree (DIS_KEN). Kentucky coffee trees exhibit an unusual distribution pattern within the state. Indians may have deliberately planted some in the presettlement era.
Distance to paper birch (DIS_BIR). Paper birch was an important resource in the economy of Native Americans.
Distance to sugar maple (DIS_MAPL). Seasonal camps may be associated with sugar maple.
Distance to cranberry (DIS_CRAN). Cranberry was another significant seasonal food source.
B.8.7.4 Bearing Trees
The following variables were from state bearing tree coverage. They were used in Phase 3.
Distance to paper birch (DIS_PAP). Replaces DIS_BIR.
Distance to sugar maple (DIS_SUG). Replaces DIS_MAPL.
B.8.8 Historic Cultural Features
The following variables were derived from Trygg maps and use only in Phase 2 Trygg-enhanced models
Distance to Native American cultural features (DIS_IND). Cultural features included Indian villages, Indian sugar camps, or other features noted on the Trygg maps as being associated with Indians.
Distance to historic roads and trails (DIS_RTS).
Distance to junctures of roads and water (RD_WAT). Places where roads and trails, from Trygg maps, intercept water and wetland resources, from NWI and the MnDOT BaseMap.
B.8.9 Paleoclimate
After an evaluation of the paleoclimate data, we determined that they were inappropriate to provide variables for modeling at this scale. Refer to Chapter 6 of this report for more information.
B.8.10 Disturbance Variables
B.8.10.1 Mines
Mine pits and dumps (MINES). This grid is derived from the MGC100 quaternary geology grid, QUAT30 (Section B.7.10.1). It was used as a variable in Phase 2, with the hypothesis that archaeological sites would not be located in mining areas. In Phase 3, mines were used as a category in the probability models, masking out model values in places where surface survey would not be expected to find sites. For Phase 4, locations of mines and dumps will be drawn from the DNR landforms coverage (Section B.6.5.4).
B.8.10.2 Water Erosion
Susceptibility to erosion by water (WAT_ERO). This variable is extracted from the WATRER30 grid (Section B.7.10.2). Cells with high susceptibility to water erosion (WATRER30 < 3) were assigned a value of one. All other cells were given a value of zero. This variable was used only in Phase 2.
B.8.10.3 Wind Erosion
Susceptibility to wind erosion (WND_ERO). This variable was derived from WINDER30 (Section B.7.10.3). The value zero was assigned to cells with low susceptibility (WINDER30 = 2), NODATA was assigned to cells in counties that were not inventoried (WINDER30 = 3). All other cells (those with high susceptibility) were given the value of 1. This variable was dropped from the list of basic model variables in Phase 2. Data were not available statewide because some counties were not inventoried.
B.8.10.4 Sedimentation
Susceptibility to sedimentation (SED). Sedimentation is defined as shoreline erosio. It is derived from the SED30 grid (Section B.7.10.4). All cells with low susceptibility (SED30 > 1) are assigned a value of zero, leaving cells with high susceptibility with a value of one. This variable was used only in Phase 2.
B.9.1 Modeling Phases
B.9.1.1 Phase 1
Phase 1 began in April 1995. A pilot model for Nicollet County was completed by the end of September that year. On November 21, 1995, the PI for GIS first received authorization from the Project Manager to begin acquiring data beyond Nicollet County, along with a list of 22 counties to model by the start of the 1996 archaeological field season. This deadline was later extended to provide adequate time for data acquisition and conversion. Seven counties were added to the Phase 1 list at that time. Phase 1 models were completed October 15, 1996.
Counties modeled in Phase 1 were selected because probabilistic data (Statewide Archaeological Surveys and the 1995 Mn/Model surveys) as well as CRM data were available for them.
The Phase 1 models were built using archaeological data from probabilistic surveys meeting standards defined by the BRW Cultural Resources staff and Mn/Model Research Director (Chapter 5). These include surveys conducted by Mn/Model team crews during the summers of 1995 (Nicollet, Stearns, and Beltrami Counties) and 1996 (Wabasha, Wright, and Cass Counties), most surveys conducted as part of the Statewide Archaeological Survey (1977-1980), and certain trunk highway and pipeline surveys (CRM data). The counties with surveys meeting these criteria are collectively referred to as the Phase 1 counties. These 29 counties are listed, by region, in Table B.6. All known sites not meeting these criteria were used to test the models.
For the purpose of these models, sites were defined as parcels sampled where cultural resources were found to be present. Nonsites were defined as random points taken from parcels sampled where no cultural resources were found. Sites and nonsites were represented in the GIS as 30 meter cells (essentially points) that represented either the centroid of a known site or a random point located in a surveyed area. For the initial models, sites representing isolated finds or single artifacts were excluded.
Models were built for Archaeological Resource subregions (Section B.6.1.1). In some cases these subregions were combined to compensate for low site numbers. The combined regions were quite large and sometimes contained a wide range of environmental situations. Also, the regions were discontinuous, in that only some of the counties in each region had archaeological data of the quality required by the Phase 1 standards.
Phase 1 provided an opportunity to experiment with variables and modeling methods for site probability models. Refer to Table B.40 for a list of the variables used in Phase 1. Phase 1 results and the performance of the Phase 1 variables (Chapter 8) were assessed to determine the best variables and procedures for Phase 2.
B.9.1.2 Phase 2
Phase 2 modeling began in March 1997 and was completed in August 1997. In Phase 2, the entire state was modeled for the first time. Counties in each Archaeological Resource Region first modeled in Phase 2 are listed in Table B.6. The state was modeled in units of subregions and combinations of subregions. At least two models were run for each subregion. The first excluded single artifacts from the training data. The second excluded both single artifacts and lithic scatters.
Models were built using archaeological site data from probabilistic and qualified CRM sources, as in Phase 1. All other known sites were used to test the models. The majority of counties had only qualified CRM sources to work with. However, evaluation of Phase 1 results indicated that models predicted negative survey locations nearly as well as they predicted known sites. This indicated a strong bias in the locations of archaeological surveys. Consequently, negative surveys did not represent the entire range of environments available for comparison with site locations. To remedy this situation, random points generated by the GIS were used to represent non-sites in Phase 2.
Phase 2 modeling relied on some variables introduced in Phase 1 and some additional new variables. Phase 2 variables were divided into two categories: basic and enhanced. Basic variables were those available statewide and were used to build the basic site probability models. Enhanced variables were those derived from high-resolution soils and Trygg data and were available only for certain counties. These were used to build soil-enhanced and Trygg-enhanced models that covered only parts of regions (Table B.40).
Phase 2 results are summarized in Chapter 8. Problems remaining to be addressed in Phase 3 included low site numbers, survey bias, and environmentally heterogeneous regions.
B.9.1.3 Phase 3 Models
Phase 3 modeling began in January 1998 and was completed in September 1998. The entire state was modeled, this time regionalized by ECS subsections (Chapter 4). Subsections were combined into larger, numbered regions for the preparation of variables. Counties in each ECS subsection are listed in Table B.7.
To address the problems of low site numbers, site probability models were built using archaeological data from all sources. Sites from probabilistic and CRM surveys were usually less than half of a subregion's known sites. Random points represented non-sites, as they did in Phase 2. Survey probability models were built using archaeological data and negative survey points from all sources to represent places that have been surveyed. Random points also represented non-surveyed places.
In Phase 3, training data for preliminary site probability models included randomly selected halves of all sites except single artifacts. The other half was used as test data. When these models proved weak because of low site numbers, final site probability models were developed all known sites except single artifacts; no test population was reserved.
To better understand the patterns of survey bias and their effects on the site probability models, survey probability models were developed in Phase 3. Training data for preliminary survey probability models included randomly selected halves of all surveyed points including all known sites and all negative survey points. The other half was used as test data. The survey probability models adopted used all surveyed points; no test population was reserved.
Phase 3 variables are listed in Table B.40. To improve model performance, many of these variables were transformed to square root or sine values when used for modeling (Table B.42). By using square roots of the distance variables, their range of values was reduced considerably, shortening the tails of their distributions. This in turn reduced the influence of outliers in the statistical analysis. Transformations were performed in S-Plus. Grids of transformed variables were created only for variables that appeared in models.
B.9.2 Extracting Data for Statistical Analysis
For the purpose of this analysis, sites are defined as parcels sampled where cultural resources were found to be present. Negative survey points are defined as parcels sampled where no cultural resources were found. Surveyed places are defined as places that have been recorded as surveyed, whether or not cultural resources were found. These include both sites and negative survey points. Random points refer to truly random points generated by the GIS software. Only a very small percentage of these are likely to coincide with cultural resources.
Statistical analysis requires that the values of the environmental variables (independent variables) be known at each of the known archaeological sites and nonsites (dependent variables). Arc/Info GRID contains a SAMPLE function that extracts the values of a number of specified grids that coincide spatially with a grid of cells for sampling, writing these values to an ASCII file. The grid ARCHDATA contains the records for all sites, classified by type and source, and negative survey points. The grid RANDPTS contains all of the random points. A number of sample grids were created from various combinations of ARCHDATA and RANDPTS for extracting environmental data for different subsets of the archaeological database (Section B.8.2). Using the Arc/Info GRID SAMPLE function with the appropriate sample grid creates ASCII files of the environmental variables at each of the sites, negative survey points, and random points of interest.
GRID and S-Plus require different input file formats for logistic regression. GRID requires a sample grid of only the sites and non-sites of interest for a particular model. Values for sites must be 1 and values for non-sites must be 0. The resulting ASCII file must include values for no more than 16 environmental variables (Section B.9.3.1).
For S-Plus, all potential sites and non-sites can be put into a single sample file. Values for both sites and non-sites can be their unique IDs. A very large number of environmental and archaeological variables can be included in the ASCII file. However, the number of environmental variables that can be sampled at one time is limited by the length of the line the terminal will accept. To develop the S-Plus ASCII database, several files are generated and merged, then joined to the archaeological database to obtain archaeological attributes. The resulting ASCII database contains all of the records and fields that might possibly be needed for any version of the models. S-Plus can subset the data to any combination of sites and non-sites, training and test populations, combinations of variables, or even modeling regions in on the basis of attribute values.
S-Plus requires that all data points (records) contain a value for each field. Any field containing MISSING data values must be discarded, or the record must be discarded. If a significant part of a region (such as a county) is missing data, the variable cannot be considered in the analysis. This limitation required separate model runs to consider incomplete data such as high resolution soils and Trygg in Phase 2. These data were dropped in Phase 3, and only variables that were complete statewide were included in the analysis.
B.9.3 Building Site Probability Models
B.9.3.1 Logistic Regression in GRID
In Phase 1, models were built using logistic regression in GRID (Table B.56). This is not recommended. GRID does not contain a variable selection routine, nor does it perform step-wise multiple regressions. There is also a limit to the number of variables that can be run in a GRID logistic regression. Moreover, univariate analysis would not be reliable for identifying the best variables for a multivariate model. The operator must be responsible for selecting the variables to be included. It would be extremely time-consuming to test all possible combinations of variables.
The logistic regression function in GRID operates on ASCII files derived by the SAMPLE function (Section B.9.2). Because logistic regression is used only for modeling presence or absence of a dependent variable, the first variable in each record should have only values of "1" for "site present" or "0" for "site absent". The remaining environmental variables should be expressed as continuous numeric data. Logistic regression in GRID seems to work only for about 16 variables or fewer. To consider more than 16 variables requires running multiple separate logistic regressions. Thus, the ASCII files should be planned accordingly. Avoid combining two variables in the same file that are measuring the same thing (e.g. DED_LK1 and DED_BLK1). Start with relatively large groups of variables. Once the sample files are made, run the REGRESSION function, specifying logistic regression and a brief report of results, to get the regression coefficients for those variables.
The regression reports the intercept and coefficients for each variable, as well as the RMS error and Chi-square value. The value for coefficient 0 is the intercept. Very small coefficients are rounded to zero by GRID. Knowing the Chi-square value and degrees of freedom (which is equal to the number of variables in your model), you can use other statistical software to determine the p-value.
All values reported were recorded in a standard table. Variables were discarded from the analysis if their coefficients were zero. The variables with non-zero coefficients were combined and run through an additional regression. This process was repeated until a model with no zero coefficients was derived. This model was then applied to the entire modeling region (Section B.9.4) and evaluated (Section B.9.5).
GRID rounds coefficients to four significant digits. Very small coefficients, which are common for variables that have very large values, may round to zero. Having even very small coefficients for these variables, however, may make a significant difference in model performance. This alone could weaken the models. This and the absence of a good replicable routine for identifying the best combination of variables for the multiple regression make GRID logistic regression a last resort option.
B.9.3.2 Logistic Regression in S-Plus
In Phases 2 and 3, all variables were run through a stepwise multiple logistic regression routine (bic.logit) in S-Plus. This routine was provided by the project statistician, Dr. Gary Oehlert of the University of Minnesota. This routine both selects the best combinations of variables for the logistic regression analysis and also runs the analysis. S-Plus output includes multiple models (combinations of variables and their coefficients), along with measures of model performance.
The ASCII file (REG#_dat.txt) used as input to S-Plus contains all of the potential site and non-site records for one region (Tables B.6 and B.7) and all of the environmental variables. Within S-Plus, these can be subset to include only certain categories of sites, only certain variables, and only certain subregions or subsections.
The procedures for running stepwise multiple logistic regression in S-Plus are more demanding than for GRID. First, REG#_dat.txt must be checked for missing dat. If MISSING values are identified, either the records must be removed or the variable must be removed from the input variable list. Then the S-Plus function SVD is used to identify singular values (variables with no variance or multiples of other variables). These are not handed to the user on a silver platter, but must be ferreted out by examining matrices of numbers generated by S-Plus. This step can be tricky and time-consuming. However, S-Plus will not allow the analysis to proceed until all singular variables have been removed from the variable list. This procedure must be run separately for each unique combination of sites, nonsites, variables, and geographic region that will be modeled. Input parameters for each model run are recorded in the Model Input Form (Table B.43).
After singular variables have been removed, the bic.logit routine is run to identify the best models. Results include BIC values, variable lists for the best models, variable coefficients for these models, posterior probabilities for each model, and the probability that each variable's coefficient is not equal to zero (Section 7.3.6.2). These are recorded on the Model Results Form (Table B.44).
B.9.3.3 Model Intercepts
Unlike GRID, S-Plus does not provide an intercept for the model. The intercept is not necessary for modeling discrete regions. The relative probabilities for finding sites and surveyed places would be the same whether or not an intercept is used. However, it does affect the magnitude of the raw model values. Consequently, an accurate intercept would be necessary for comparison of raw model values between modeled regions.
In Phase 2, and for most of Phase 3, model intercepts were determined by taking the variables from the S-Plus models and running them through a logistic regression in GRID. In addition, since intercept values are influenced by the ratio between sites and nonsites, a correction factor was applied to each intercept. This was:
Ln(nonsites/sites)
The point of this exercise was to derive model grids with raw values (ranging from 0 to 1) that were comparable between regions. This would allow a statewide map, based on raw model scores, to be created. However, when these intercepts were applied to some regions in Phase 3, raw model values were either so large that they all rounded to 1 or so small that they all rounded to 0. Using the same variable coefficients, but excluding the intercept, provided reasonable raw model values. It became clear that a statewide map of comparable raw model values would be impossible. For this reason, 0 was used as an intercept for these and subsequent models.
B.9.4 Apply and Classify Probability Models
Either set of regression coefficients can be used to build a regression equation in GRID. To map the model, the mathematical model derived in the logistic regression must be applied to the entire region. In GRID, the following equations will accomplish this:
SUMGRD = intercept + (VAR1 * coef1) + (VAR2 * coef2) + (VARn* coefn)
MODEL = 1 / (1+ EXP(SUMGRD * -1) )
Second equation will produce a probability surface with floating point values ranging from 0 to 1. These values indicate the relative potential for the presence of archaeological sites. To save disk space, this floating point grid of raw model values was converted to an integer grid. Some raw model variable values were very small, requiring multiplication by larger numbers prior to rounding to create integers. The standard multiplier used was 10,000. In some cases with very low raw model values, a larger multiplier was used and the variations were recorded in a variance-tracking sheet (Table B.45) and model report. Had the reliable intercepts been available for all subregions modeled, this would have allowed the models developed from different multipliers to be corrected to a common scale before combining them into a statewide grid.
To simplify these probability surfaces, they were sliced, according to model value, into approximately equal sized groups of cells for classification. Equal sized can be interpreted as either equal numbers of cells or as equal areas, since all cells are the same size. Finally, to determine relative probabilities and facilitate evaluation and comparison of models, the models were categorized into high, medium, and low probability areas. Different criteria were used for this categorization in each phase of the project.
B.9.4.1 Phase 1 Classification Methods
In Phase 1, without first excluding water, steep slopes, and mines, models were sliced into three equal areas of high, medium, and low probabilities, using the SLICE function in GRID. Quite simply, the third of cells with the highest raw model values became the high probability class, the third of cells with the lowest raw model values became low probability, and the remaining third became medium probability. Thus, the relative areas of the three probability classes did not vary much from one region to the next, but the number of sites captured in each class did. Since the high and medium probability areas always occupied about 66% of the landscape, models were evaluated by whether significantly more than 66% of the sites occurred in these areas.
B.9.4.2 Phase 2 Classification Methods
In Phase 2, the goal was to reduce the percentage of the area in high and medium probability, without significantly reducing the number of sites occurring in these zones. First, water, steep slopes, and mines were excluded. Then model grids were sliced into 20 equal sized classes, using the SLICE function in GRID. Each class is assumed to contain approximately five percent of the cells in the modeled area, or five percent of the land area modeled.
The reclassification of these 20 classes was based on capturing approximately 70% of sites in high probability and 15% of sites in medium probability, then maximizing the gain statistic. The distributions of modeled sites and of all known sites among the 20 classes were determined using the SAMPLE function and appropriate sampling grid. Water, steep slopes, and mines provide an additional three classes. Breakpoints between the first 70% of sites (high probability) and the next 15% of sites (medium) were noted. Gain statistics were calculated for modeled sites and all known sites using these two sets of breakpoints. The breakpoints that provided the best gain statistic were selected. This sometimes resulted in very small areas classified as high and medium probability, but at the expense of the numbers of sites predicted. Both the area of the high and medium probability classes and the number of sites predicted by these classes varied between models.
Tables B.46 and B.47 provide examples of the Phase 2 worksheets for model classification. First, the numbers of modeled sites (training data) and other sites (test data) are determined, by sampling, for each of the 23 model classes and entered into the Model Classification Form (Table B.46). Then these values are added to provide values for all known sites. In the example provided, the number of sites from probabilistic sources (modeled sites) are much fewer than all other sites in the region. Moreover, the majority of modeled sites are strongly clustered in the higher model value categories (19 and 20), whereas the majority of other sites are dispersed through a larger number of categories. Because these sites are more numerous, they have a strong influence on the distribution of all sites.
The Phase 2 Worksheet for Model Classification (Table B.47) guides the modeler through the process of determining which of the 20 model classes to assign to each of the high, medium, and low probability categories. Calculations are performed for both modeled sites and all known sites. The determination of the high probability classes is based on capturing as close to 70 percent of the sites in categories with the highest model values. After determining what 70 percent of the total number of sites, either modeled sites or all known sites, would be, the numbers of sites in the Model Classification Form (Table B.46) are summed, beginning with category 20 and working down. When the sum closest to 70% of the sites is reached, it is entered as cx of the worksheet. The high/medium probability categories are based on capturing 85% of the sites, including those already in the high probability category, and are determined by the same method (ix). All other columns are calculated based on these values and the total number of sites in each of the two populations. The area of each of the 20 preliminary model classes is assumed to be five percent of the total area of the modeled, so percent area can be estimated by multiplying the number of categories by five (ex, kx). The estimated gain statistics are then calculated (hx, nx).
In this example, the estimated gain statistics for modeled sites are high than for all known sites (Table B.47). The model does a much better job predicting the modeled (probabilistic) sites than the total site population. This is to be expected, but it is not always the case. Some models have actually performed better for all sites than for modeled sites. These results imply that the probabilistic and non-probabilistic sites in this subregion are drawn from different populations and exhibit different geographic distributions. However, because the project's goal is to optimize the gain statistic, number of sites in high/medium probability, and total area in high/medium probability, the much higher gain statistics from the classification of modeled sites is more attractive. When recalculated from the population of all known sites in this model's high and medium probability categories, the gain statistic for the high probability area would be 0.7297 and the gain statistic for the high/medium probability would be 0.3182. Although these statistics are not as strong as those calculated from the distribution of modeled sites, they are much stronger than the statistics calculated from the model classification based on the distribution of all sites. This stronger gain statistic is the result of reducing the size of the area categorized as high/medium probability, even though a smaller percentage of all known sites will be found in these categories. By the decision rules in effect during Phase 2, the classification suggested by the distribution of modeled sites would have been selected as the model to apply.
Table B.48 illustrates how this 23 category model would be reclassified to the five category, three probability class model for display and evaluation.
B.9.4.3 Phase 3 Classification Methods
In Phase 3, the goal was to capture at least 85% of sites in high and medium probability areas. Only the areas of the probability classes were allowed to vary. After excluding water, steep slopes, and mines, models were sliced into 20 equal area classes, using the SLICE function in GRID. The SAMPLE function was used to determine the model (probability class: 20 classes) value for each cell in the SAMPGRID grid.
Using the unique field identifier in the file as a joinitem, the sample file was joined to REGION_DAT.DBF. The joined table was then exported to REGIONMODS.DBF. In the file names, REGION is a four-character subsection name. A summary table of model distribution among 20 probability classes can be made from REGIONMODS.DBF by summarizing on the model value. The summary table provides a count of the modeled sites (or surveyed points) in each of the probability classes. Cumulative totals and percentages are then calculated as new fields (Table B.49). The 27 sites on steep slopes are not included in these cumulative figures, although they are counted in the total number of sites from which the percentages are determined. Based on the cumulative percentage, the 20-class models are reclassified to 3-class models with the criteria that the high probability class contain 70% of sites (or surveyed points), the medium probability class contain the next 15% of sites, and the low probability class contain the remaining 15% of sites. In the example provided (Table B.49), classes 17-20 were defined as high probability, 13-16 were defined as medium probability, and the remaining classes were defined as low probability. The distinction between high and medium is not ambiguous. Classes 17-20 contain 2.852 percent less than 70 percent of all known sites, while classes 16-20 contain 2.924 percent more than 70 percent of sites. Because the number of sites in 17-20 is closest to 70 percent, it is defined as high probability.
B.9.5 Evaluating Probability Models
B.9.5.1 Model Evaluation Form
The three-probability category models were evaluated using standard methods so that results could be compared (for selecting the best model) and reported. The measures use also allow comparison of results from different model subregions. Model evaluation requires determining reclassified (three probability class) model values at every site and nonsite. This can be accomplished using the SAMPLE function. The resulting file may then attached to the archaeological database to distinguish between sites and nonsites and between types of sites. However, in Phase 3 the same result was accomplished simply by calculating a new field in the master database, based on the values of the 20 probability class model already recorded there. Numbers and percentages of selected groups of sites and nonsites are recorded in the Model Evaluation Form. Various versions of this form have been used throughout the project. An example from Phase 1 is provided in Table B.50, and Table B.54 illustrates an example from Phase 3. Additional examples can be found throughout Chapter 8. The number of cells in each model class within the subregion are taken from the model VAT and are also recorded on the form. The results recorded are compared to those for other models in the same subregion and to the established goals to determine the best subregion model (Section B.9.5.3).
Table B.50 illustrates several characteristics of the Phase 1 models. First, since the high, medium, and low probability classes are, by definition, each one third of the landscape, there is little variation in the area modeled within each class. The population of modeled (probabilistic) sites is much smaller than the population of other (non probabilistic) sites. Non-sites (negative survey points), which in an ideal world should be distributed randomly, have a distribution skewed towards high probability areas. Modeled (probabilistic) sites, as can be expected, were predicted very well by the model. Other (non probabilistic) sites were, in this case, predicted almost as well, but that is not always the case. Single artifacts are not as well predicted as other kinds of sites.
The Phase 3 model illustrated in Table B.49 is evaluated in Table B.51. Because of the classification techniques used in Phase 3, the cells in the subregion are not equally distributed among the three model classes (Section B.9.4.3). Because the modeled sites (training data) and other sites (test data) are separated using random numbers, the two populations are nearly equal in size. Negative survey points are still skewed towards the high probability class, and are predicted nearly as well as the population of test data. The gain statistics are calculated from all known sites. Even models based on halves of a subsection database, gains are typically higher than are Phase 1 or 2 models. Further improvement in gain statistics can be obtained from modeling all known sites together.
B.9.5.2 Gain Statistic
Kvamme's gain statistic is calculated as:
Gain = 1 -([ % of area in high or high/medium probability classes] / [% of all sites of the type modeled in high or high/medium probability classes])
B.9.5.3 Determination of the Best Model
Logistic regression in GRID returns the RMS-error and chi-square values for each model (Table B.52). The degrees of freedom equal the number of model variables. Technically, one should look for a high chi-square with a relatively low number of variables, but such a model does not necessarily make the best predictions. Moreover, differences between variations of the models for the same dataset can be quite small. Comparison is made more difficult as both chi-square and the number of variables vary from one model to the next.
P-values can be calculated from the chi-square and degrees of freedom of each model. This provides a test of the null hypothesis, that modeled sites (or surveyed places) are randomly distributed with respect to the model's variables. Typically, however, all models perform well by this measure, making it a poor discriminator between models (Table B.52).
It is generally desirable to find a model with a small number of variables that does a good job predicting site locations. However, such models can usually be improved slightly (i.e. predict more known sites) by adding more variables. Conventional wisdom says to avoid redundant variables, such as "distance to lake" and "distance to big lake". However, this apparently is not a hard and fast rule. The project statistician advised our modeling team that by combining such variables more information can be obtained. Following this advice, the redundant variables were not removed and the models tend to include a large number of variables.
Because of the project goals, Mn/Model models were evaluated primarily by the gain statistic. This measure summarizes the two components of Mn/Model's initial project goal: to predict a large number of known sites within a relatively small percentage of the land area. It is possible to manipulate this statistic by the choice of decision rules used to classify high, medium, and low probability areas (Section B.9.4). However, if all models in a group are classified by the same criteria, the gain statistic is a useful measure for comparison because it does discriminate well between models that may perform equally well by other measures.
In Phase 3, if the model was built by combining subsections, each subsection was evaluated separately and compared to other models built for the same area (either separately or as part of a different group of subsections). The model providing the best prediction for that subsection was selected for inclusion in Chapter 8.
All model selection methods assume that the population of known sites is representative of all sites in the area modeled. We do not know this to be the case. In fact, we are certain that surveyed places are not randomly distributed. The best models are only as good as the data available. In the case of Minnesota, the archaeological database is the weakest link in most parts of the state.
B.9.6 Additional Models
B.9.6.1 Data Confidence
A confidence layer was developed as an indicator of the quality of data available for each cell in the state. This is one indicator of confidence in the Phase 3 site probability models. Several factors contribute to confidence in the models. These include the number of archaeological sites in the modeled population, and the quality of the environmental data (e.g. whether 1:250,000 DEMs were used, whether variables at a larger scale than 1:250,000 were used). The data confidence layer is a composite grid with values that summarize these conditions. In this grid, higher values indicate higher confidence in the data used for modeling. This is not a precise measurement, but an attempt to summarize the data variability that may have affected model quality. The grid, DATA_CON, is derived by the following equation:
DATA_CON = INT((0.75 * ECOREG.MOD_NORM) + (0.5 * ECOREG.DAT_RES) + (0.75 * ECOREG.DENS_NORM) + (0.5 * ELEV_CON))
Where:
ECOREG.MOD_NORM is the normalized value (0 - 100) of modeled sites (excluding single artifacts) for the modeled subsection. It is an attribute added to the ECOREG grid VAT and is calculated as:
MOD_NORM = (number of modeled site in modeled subsection – lowest number of sites in any subsection)/0.01(highest number of sites in any subsection – lowest number of sites in any subsection)
ECOREG.DAT_RES is an item added to the ECOREG grid VAT that holds a 0 – 100 value for the scale of the lowest resolution database used in the final site model for a subsection (Table B.53). DAT_RES has the following values:
| SCALE | DAT_RES |
| 24,000 | 100 |
| 100,000 | 66 |
| 250,000 | 33 |
| 500,000 | 0 |
DENS_NORM is an item added to the ECOREG grid VAT that hold a 0-100 value for normalized value of the density of known sites (SITE_DENS, Table B.54).
SITE_DENS is all sites (including single artifacts)/km2 . DENS_NORM is calculated by
DENS_NORM = (SITE_DENS – lowest site density value in any subsection)/0.01(highest site density value in any subsection – lowest site density value in any subsection)
ELEV_CON is a statewide grid, derived from the Mn/Model version of QUAT30, indicating the quality of the elevation data within each 7.5 minute quad in the state. ELEV_CON has the following values:
DATA QUALITY
ELEV_CON MGC100 (1:250,000 scale) 0 Banded 1:24,000 DEMs 50 Unbanded 1:24,000 DEMs 100
B.9.6.2 Model Stability
In Phase 3, the percentage agreement between two preliminary models based on randomly selected halves of the database was calculated and KAPPA analysis was performed to evaluate the stability of these models. This method is explained in Chapter 7. Several factors contribute to stability in the models. These include the percentage of the area mapped to low probability, percentage of negative survey points in low probability, KAPPA values (see Section 7.5.1.3.2) from comparing the two preliminary models for the subsection, and the degree of difference of each individual cell between the two preliminary models. In this grid, higher values indicate higher stability of the model results. The model stability grid, MOD_STAB, is derived by the following equation:
MOD_STAB = INT((100 * (ECOREG.NEG_LOW/ECOREG.AREA_LOW))+ ECOREG.KAPPA + SS_CON)
Where:
ECOREG is the statewide ECS subsection grid. NEG_LOW, AREA_LOW, KAPPA are attribute items added to the grid.
- NEG_LOW: % negative survey points in low probability (an indicator of survey bias from the final site model for each subsection).
- AREA_LOW: % area mapped to low probability (in the final site model for each subsection).
- KAPPA: Kappa index value for half site models for each modeled region.
SS_CON is a grid for each modeled subsection that is a reclassification of the SITESITE grids (co-occurrence of preliminary model results). The matrix below indicates the SS_CON value for each possible combination of cell values when the two preliminary models are compared.
Second Preliminary Model Values |
||||
| First Preliminary Model Values | High |
Medium |
Low |
|
| High | 100 |
50 |
0 |
|
| Medium | 50 |
100 |
50 |
|
| Low | 0 |
50 |
100 |
|
Statewide, values for MOD_STAB range from 21 to 203. The model is classified according to the following criteria:
| VALUE | CATEGORY |
| 1 - 50 | Very Low |
| 51 - 100 | Low |
| 101 - 150 | Medium |
| 151 - 200 | High |
| > 200 | Very High |
One flaw in this model is that water bodies have been assigned low values. They should be removed from the model altogether. This will be remedied in Phase 4.
B.9.7 Statistical Analysis of Models and Variables
B.9.7.1 Preparing Database for Univariate Statistical Analysis
Because of time constraints, univariate analysis of model variables was performed only in Phase 3, for the final models. For this analysis, a dBASE format database was generated for each Phase 3 ECS subsection. This database included both variable and model values for all archaeological sites, negative survey points and random points in the subsection.
At this time, additional archaeological variables were added to ARCHDATA.PAT for inclusion in the univariate analysis database. These variables summarize information extracted from the SHPO database using complex queries (Table B.8).
B.9.7.2 Performing Statistical Analysis
Univariate statistical analyses were performed in S-Plus for each ECS subsection. Histograms of the distribution of all sites modeled, all negative survey points, and all random points were generated for selected variables. A summary of the mean, standard deviation, and correlation matrix between the modeled variables was also compiled. The interpretation of the analysis results is in Chapter 8.
In Phase 3, when a new archaeological database was developed, errors were discovered in ARCHDATA. Corrections to the data were too late to affect site & survey probability models, but were caught in time for testing the geomorphology models (Chapter 12). Statewide, 79 sites in ARCHDATA.PAT were miscoded SITE_TYPE = 0, even though they had valid site numbers and, in many cases, other information in the digital database. The lack of a valid code for SITETYPE indicates that these records would not have been selected as "site present" for model development, nor would they appear on maps of sites. Six of these would not have been eligible for modeling because they were too recent or were single artifacts. The impact of excluding the 73 eligible sites from modeling varies by region (Table B.55).
B.11.1 New Data
Since the completion of the Phase 3 models, a number of new or improved data sources have become available.
The SHPO has redesigned their database so it is truly relational. Fields, such as site function, that previously could hold more than one value have been parsed into separate records in separate tables, making it easier to summarize and query the data. UTM coordinates are being checked and corrected as well, though completing this task may take quite a while.
SHPO has expressed interest in digitizing the locations of past surveys. This will provide much more information to the survey probability models, probably increasing the amount of land classified as high and medium probability. In turn, the Phase 4 survey implementation models should contain less area classified as "unknown."
With the availability of two 1:100,000 scale geomorphic datasets from DNR, the MGC100 geomorphic data will be discarded. The higher resolution data will provide better delineation of alluvium and terraces as well as the ability to measure the influence of other, smaller features such as alluvial fans.
All 1:24,000 Level 2 DEMs have been completed for Minnesota. With this vast improvement in the quality of elevation data, the performance and resolution of models for several subsections should improve.
With SSURGO digital county soil survey becoming available for Minnesota, we should be able to model at least one entire subsection using high resolution soil variables.
Statewide land use/land cover data at 1:24,000 scale will provide better boundaries for mines and other factors that may have disturbed archaeological sites.
B.11.2 New Methods
Mn/Model models should be revised approximately every 5-10 years, depending on what new developments have occurred in the time elapsed since the previous modeling phase.
Because of acquired experience with the modeling methods, we expect there to be only one "phase" of modeling for Phase 4. This is likely to be based on jackknife procedures, using 10 randomly selected groups of data, each containing 90 percent of all sites or surveyed places. This was not possible in Phase 3 because of time constraints, but will allow us to test each of the ten models with the reserved 10 percent of the database. The final model will likely be built using all sites, but the previous 10 model tests will be more directly applicable than tests for models based on half or less of the data. Likewise, Kappa statistics will be based on a much larger number of model pairs for each subsection.
Preceding modeling, there will be an effort to use hydrologic (surface) modeling and other GIS-based techniques to reconstruct some aspects of pre-historic environments, such as drained lakes and abandoned river channels. If this is successful, the models may be able to predict a larger proportion of sites in some regions.
Variables for each subsection will be carefully screened before modeling. Variables for which the resources are not found in the subsection will be removed. This should eliminate the presence of variables that act as surrogates for latitude or longitude and are otherwise not interpretable.
Other new methods will be considered as well. Phase 4 models should be greatly refined from those presented in this report.
Anfinson, S.F.
1976 Minnesota Municipal and County Highway Archaeological Reconnaissance Study, 1975
Annual Report. Minnesota Historical Society, St. Paul.
1988 Annual Report Minnesota Municipal County Highway Archaeological Reconnaissance Study.
Appendix 3. Minnesota Historical Society, St. Paul.
1990 Archaeological Regions in Minnesota and the Woodland Period. In The Woodland Tradition in the
Western Great Lakes: Papers Presented to Elden Johnson, edited by Guy E. Gibbon, pp. 135-166.
University of Minnesota Publications in Anthropology No. 4. Department of Anthropology, University of
Minnesota, Minneapolis.
Balaban, N.H. (editor)
1988 Geologic Atlas of Olmsted County, Minnesota. Scale 1:100,000. Minnesota Geological
Survey/University of Minnesota, St. Paul, Minnesota. 9 pls.
Balaban, N.H., and B.M. Olsen (editors)
1984 Geological Atlas of Winona County, Minnesota. Scale 1:100,000 and smaller. Minnesota
Geological Survey/University of Minnesota: St. Paul, Minnesota. 6 pls.
Cowardin, L.M.
1977 Classification of Wetlands and Deep-Water Habitats of the United States (An Operational Draft).
U.S. Fish and Wildlife Service.
Garbrecht, J. and P. Starks
1995 Note on the Use of USGS Level 1 7.5-Minute DEM Coverages for Landscape Drainage Analyses.
Photogrammetric Engineering and Remote Sensing (615): 519-522.
Hammer, J.
1993 A New Predictive Site Location Model for Interior New York State. Man in the Northeast 45:39-
76.
Heinselman, M.L.
1974 Interpretation of Francis J. Marschner’s Map of the Original Vegetation of Minnesota.
Published on the back of The Original Vegetation of Minnesota by F.J. Marschner. Compiled from
U.S. General land Office Survey Notes. North Central Experiment Station, U.S. Department of
Agriculture, St. Paul.
Hobbs, H.C.
1995 Geologic Atlas of Rice County, Minnesota. Scale 1:100,000. Minnesota Geological
Survey/University of Minnesota: St. Paul, MN. 6 pls.
Hobbs, H.C., and J.E. Goebel
1982 Geologic Map of Minnesota: Quaternary Geology. Minnesota Geological Survey. Scale
1:500,000. Map projection Lambert Conformal (from USGS Base).
Marschner, F.J.
1974 The Original Vegetation of Minnesota. Compiled from U.S. General Land Office Survey notes.
North Central Forest Experiment Station, Forest Service, U.S.
Minnesota Governor's Council on Geographic Information, GIS Standards Committee
1996 Minnesota Geographic Metadata Guidelines, Version 1.0, September 25, 1996. Available from
the council staff coordinator at the Land Management Information Center, (612) 296-1208; e-mail
gc@mnplan.state.mn.us.
Minnesota Governor’s Council on Geographic Information, Soils Data Committee
1997 Developing digital county soil surveys for Minnesota (it’s a dirty job). Available from the council
staff coordinator at the Land Management Information Center, (612) 296-1208 or from the Council’s
home page, http:www.lmic.state.mn.us/gc/gc.html.
Mossler, J.H. (project manager)
1995 Geologic Atlas of Fillmore County, Minnesota. Scale 1:100,000. Plate 2, Bedrock geology, in
ARC/INFO format. Minnesota Geological Survey/University of Minnesota, St. Paul, Minnesota.
North American Pollen Database
Illinois State Museum, Springfield, Illinois, USA, and National Geophysical Data Center, Boulder,
Colorado, USA.
Runkel, A.C.
1995 Bedrock Geologic Maps, Eastern Half of Houston County, Minnesota. Scale 1:100,000.
Bedrock geology, in ARC/INFO format. Minnesota Geological Survey/University of Minnesota: St.
Paul, Minnesota.
Santos, K.M., and J.E. Gauster
1993 User’s Guide to National Wetlands Inventory Maps (Region 3) and to Classification of
Wetlands and Deepwater Habitats of the United States. U.S. Fish and Wildlife Service, National
Wetlands Inventory, Region 3, 4101 East 80th Street, Bloomington, Minnesota.
Sloan, R.E., and G.S. Austin
1966 Geologic Map Atlas of Minnesota, St. Paul Sheet. Scale 1:250,000. Minnesota Geological
Survey/University of Minnesota, St. Paul, Minnesota.
U.S. Geological Survey
1990 Digital Elevation Models Data Users Guide. U.S. Geological Survey, Reston, Virginia.
The Mn/Model Final Report (Phases 1-3) is available on CD-ROM. Copies may be requested by visiting the contact page.

Acknowledgements
MnModel was financed with Transportation Enhancement and State Planning and Research funds from the Federal Highway Administration and a Minnesota Department of Transportation match.
Copyright Notice
The MnModel process and the predictive models it produced are copyrighted by the Minnesota Department of Transportation (MnDOT), 2000. They may not be used without MnDOT's consent.