Quick Links
Chapters
- Management Summary
- Research Design & Time Line
- Environment & Native American Culture
- GIS Design
- Archaeological Database
- Archaeological & Environmental Variables
- Model Development & Evaluation
- Model Results & Interpretation
- Project Applications
- Model Enhancements
- Model Implementation
- Landscape Suitability Models
- Summary & Recommendations
Appendices
- Archaeological Predictive Modeling: An Overview
- GIS Standards & Procedures
- Archaeology Field Survey Standards, Procedures & Rationale
- Archaeology Field Survey Results
- Geomorphology Survey Profiles, Sections, & Lists
- Building a Macrophysical Climate Model for the State of Minnesota
- Correspondence of Support for Mn/Model
- Glossary
- List of Figures
- List of Tables
- Acknowledgments
Appendix F
Building a Macrophysical Climate Model for the State of Minnesota
By Paul Morin and Elizabeth Hobbs

Appendix F Table of Contents
F.2 Macrophysical Climate Modeling
F.3 Properties and Drawbacks of the Macrophysical Model
F.4 The Hierarchical Steps and the Assumptions
F.5 Calculating Local Climate History
F.6 Requirements to Model the Past Climate at a New Site
F.7 Integrating the Macrophysical Climate Model into Mn/Model
F.8 Fine-Scale Problems
References
As indicated in Chapter 3, Minnesota’s climate and vegetation have changed dramatically during the last 12,000 years. Ice, tundra, and spruce parkland covered nearly all of the state in the cool Late Glacial and Early Holocene periods (ca. 16,000 - 8000 years B.P.), and prairie grassland spread widely during the warm, arid Hypsithermal climatic episode (ca. 8000 - 6000 years B.P.). Even in more recent periods, climatic oscillations severely altered the character of the landscape. An example is the arid Scandic climatic episode (ca. 700 - 400 years B.P.) in which many lakes in western Minnesota dried up and grassland invaded woodland (Bryson et al. 1970). These changes have important implications for Mn/Model, for a basic assumption of the project’s modeling process is that hunter-gatherer’s without advanced transportation concentrate their activities and settlements near key resources. If these resources are dynamic in their distribution through time, then the power of the project’s predictive models could be lessened. This problem is compounded by geomorphic processes. Since many site components whose location may have been affected by radical shifts in vegetation and climate were formed during the Late Glacial and Early Holocene periods, they are much more likely than more recent sites to be deeply buried in accumulated sediment.
The addition of paleoclimate and geomorphic data layers to the GIS were considered important enhancements to the Mn/Model database during Phase 2. This appendix describes the nature of paleoclimate modeling, assumptions and procedures of the modeling process, and details of the model developed for the Mn/Model project. The model results and their incorporation into the Mn/Model GIS are discussed in Section 6.3.
Increasingly, complex computer models are being relied upon, by scientists and policy makers, to predict climatic changes and their effects. It is thus vitally important that these be models be accurate. Since climate models are usually developed using what is known of the current climate, one of the best ways of testing their output is by checking how well they can replicate the climatic conditions of the past. The only way to actually determine these past climate conditions is by analysis of the records found in ice and sediment deposited in the past. Besides providing data to these postulated precipitation and temperature trends, some of these data allow as well the reconstruction of past vegetation.
The basics of the model used were developed by Professor Reid A. Bryson of the Center for Climatic Research at the University of Wisconsin-Madison. With Professor Bryson’s monitoring, his model was adapted to the Minnesota region and inclusion in the Mn/Model GIS by Professor Emi Ito and Paul Morin of the Department of Geology and Geophysics at the University of Minnesota. The description below of Bryson’s paleoclimate modeling process is based on a workbook prepared by Bryson and his collaborators (Bryson et al. 1995). All quotations in this appendix are taken from this workbook.
F.2 MACROPHYSICAL CLIMATE MODELING
Bryson’s approach is based upon a paleoclimate simulation method called "macrophysical." It is called macrophysical because its primary generative processes are large scale natural phenomena, such as Rossby long wave equations, the thermal wind relationship, the Z-criterion derived from the work of Smagorinsky, and global glacial volume. The interrelationships of these processes are used to model the climate of site-specific areas. Underlying Bryson’s manipulation of these processes is a concept of climate that views it as "a consequence of external controls on the earth-atmosphere-hydrosphere-cryosphere system" (p. 3). In this view climate is not equivalent to weather but a system formed by macro forces that "produces and requires sets of weather complexes, which differ as the climate differs from one time to another" (ibid.). Because climatic states varied in the past, so did their array of associated weather patterns. The result was differing amounts of weather-related elements, such as annual amount of rain, snow, and cloud cover, wind velocity, and magnitude and duration of temperature. These variations determined, with other processes like plant migration, soil genesis, and rate of stream incision, the boundary conditions that influenced past hunter-gatherer adaptations, such as composition of regional vegetation, lake level, and depth of snow cover.
Macrophysical models are formed by identifying the large-scale global phenomenon that together are thought to control climate. Movement from global or hemispheric models to regional and site-specific models requires the identification of broad-scale relationships between these two levels of phenomena. An example is the relationship between the average hemispheric temperature and regional temperature gradients.
F.3 PROPERTIES AND DRAWBACKS OF THE MACROPHYSICAL MODEL
The macrophysical model developed by Bryson and his associates purports to have several features that make it of particular interest to predictive modeling in archaeology and, more generally, to scientists understanding human-environment relationships in Minnesota during the last 12,000 years. These properties, as listed in Bryson et al (1995:5), are:
- They model variations of the climate that occur on the scale of several centuries, and potentially on the scale of single centuries.
- They may be site specific, i.e., model the climate of a specific archaeological or historical site.
- Preliminary indications are that they can model the past climate at specific sites in hilly or mountainous terrain.
- They may be constructed and run quickly and cheaply on a microcomputer.
- They seem to have accuracy comparable to the large, complex General Circulation Models.
Because of its early stage of development, abstract nature, and global reach, Bryson’s macrophysical model does have several drawbacks as a modeling tool at the present time. These are:
- Since few such models have been developed, applied, and tested, there is not a large literature on the application of macrophysical models.
- The model has a number of adjustable and empirical parameters that do not dictate the time-series output at present but simply scale the inputs to give a reasonable value to the average output.
- While the match between model projections and field data has been satisfactory and even excellent in scattered tests, the model has yet to be fully validated with field data in Minnesota.
F.4 THE HIERARCHICAL STEPS AND THE ASSUMPTIONS
By feeding site-specific weather data into the macrophysical model, archaeologists and other field scientists are able to simulate past temperature and precipitation for the site. This is accomplished by deducing local climate from large-scale parameters, such as the latitudes of "centers of action" (e.g., the subtropical anticyclones), the latitude of the Intertropical Convergence, and the longitudes of troughs in the upper westerlies. This general approach is a branch of climatology known as synoptic climatology. The five steps outlined below provide an idea of the assumptions made in the creation of the model. Steps 1 to 4 are the path taken to calculate the modules that make up this site-specific climate model. Step 5 is what the modeler performs to create a climate model. Although users of the macrophysical model do not have to be familiar with steps 1 to 4 to use the model, familiarity with its underlying assumptions ensure a more sophisticated use of the model, and aid in its interpretation and improvement. The overview in this section is taken from the Bryson workbook.
Step 1 Model Glacier Volume And Area Time-Series
Examination of the geological evidence tells us that the volume of glacier changes varies slightly in the Southern Hemisphere from glacial to interglacial, and that most of the Pleistocene Northern Hemisphere glacier was in North America, with a large part of the rest being in Northwest Europe. Synoptic climatology tells us that the snowiest winters in the major Northern Hemisphere glacier accumulation areas are mild winters. Logic and experience tell us that snow melts slower in a cool, cloudy wastage season. This leads to assumption 1.
Assumption 1: The seasonal temperature of the hemisphere is related to the amount of radiation received and absorbed near the surface by the hemisphere in that season.
It follows that accumulation rate minus wastage rate will be inversely related to the seasonal radiation contrast of the hemisphere. It also follows that the difference of these two rates is also a rate, so that this net accumulation rate must be integrated to simulate the total glacier volume at any particular time. The Northern Hemisphere irradiance seasonality may be computed using the "Milankovitch" periodicities in the usual Fourier series form, which may be readily integrated. This series contains no high frequency terms (periods less than nine millennia or so).
Assumption 2: Volcanic aerosol (largely as sulfuric acid droplets in the stratosphere) is the major source of modulation of the incoming solar radiation.
Measurements from which the atmospheric aerosol loading can be determined have been made regularly only since 1883. Using historically observed eruptions, it has been demonstrated that most of the variance of the observed aerosol loading can be explained by the volcanic record. Using the radiocarbon-dated volcanic eruption chronology, it is possible to construct a proxy record of volcanic aerosol that extends back at least 30,000 years. This may be used to modulate the radiation for the integrated Milankovitch-based glacier volume modeling, and thus introduce higher frequency terms into the glacier model. The result of this modulation and the introduction of higher frequency terms is a simulation in arbitrary units of glacial volume that follows the known geological record of the past 40 millennia quite well, including such short term features as the "Younger Dryas" and Neo-Glaciation. The arbitrary units may be readily calibrated into standard volume units by scaling.
Step 1 Inputs - Astronomically calculated irradiance
- Volcanic aerosol derived from observed volcanism
- Scaling factors
These inputs are contained in the modules BMIN-N.WR1 or BMIN-S.WR1 (in the model software), for the northern and southern hemispheres, respectively. They are incorporated into a heat budget model, which is contained in the files NHT-MK3.WR1 and SHT-MK2.WR1, for the northern and southern hemispheres , respectively (although the two hemispheres are interactive).
Step 2 Model of Hemispheric Seasonal Temperatures
The model uses the calculated radiation over the northern hemisphere for each half year. It modulates the incoming radiation by a transparency derived from a global volcanicity index. Radiation is diminished by the albedo, which is obtained mostly from the calculated ice area. This gives an incoming shortwave radiation history. From this is derived a hemispheric half-year mean temperature that will produce an outward long-wave flux equal to the incoming short-wave flux.
Assumption 1: The largest source of variation in hemispheric albedo is due to variation in the areal extent of ice and snow cover.
Estimates of glacial volume were obtained in Step 1. This may be converted to glaciated area using a relationship developed for glacial profiles (Moran and Bryson 1969). Numerous measurements of albedos clearly indicate that the dominance of ice as the source of variation in time for the total range of the rather fixed surfaces is even less than the range within various forms of ice cover.
Assumption 2: Equivalent opaque cloud cover.
With the definition of equivalent opaque cloud cover developed by Dittberner and Bryson (1976), the cloud amount drops out of the heat budget equations but only for climatic scales. The equivalent opaque cloud cover may be thought of as a single, or dispersed, opaque cloud that has the same albedo as the real cloud cover. It is black in the infrared on its under surface; no heat arrives at the surface under the cloud nor leaves. The mean climate is determined by what happens outside the cloud area.
Assumption 3: Throughout most of geological history, the carbon dioxide and water vapor content of the atmosphere have been dependent variables dependent on temperature, and, as a first approximation, linearly so.
The test of this approximation is whether the hemispheric temperatures calculated using these assumptions in a heat budget model are realistic.
Step 2 Inputs - Astronomically calculated mean hemispheric irradiance
- Atmospheric transmissivity calculated from the observed volcanic record
- Calculated hemispheric albedo based on Step 1
- Scaling factor from GCM temperature range, or geological evidence
Step 2 Output- The incoming radiation absorbed at the surface and the calculated hemispheric half-year mean surface temperature calculated in the heat budget model.
This output is directly used as input to the Lettau climatonomic calculations, which are described below.
Step 3 Model Monthly Hemispheric Temperature, Evaporation, and Net Radiation Time-Series
The mean incoming radiation absorbed at the surface (called "left side" in the files) is now converted into a "first approximation" set of monthly temperature values for the hemisphere by fitting to a cosine curve that will give the correct half year means. The same is done with the half-year mean hemispheric temperatures. These monthly values are then used, for each time step into the past, as input to the Lettau protocol for adjusting the monthly temperature values to give an internally consistent set of monthly values of subsurface storage, temperature, outward radiation, and evapotranspiration.
Assumption 1: The Lettau climatonomic method of obtaining a mutually consistent set of monthly surface heat budget components is correct.
Step 3 Inputs The inputs are internal to the model contained in files NHT-MK3.WR1 and SHT.MK2.WR1.
Step 3 Output The output of the Lettau calculations is contained within the same files as the input, and is also in file BMTS-1.WR1 and BMTS-1S for the two hemispheres.
Step 4 Calculate the Latitude of the "Centers of Action"
Centers of action are large-scale features such as the subtropical anticyclones and the jet stream. They were recognized many years ago as indicators of the general synoptic situation. At present, synopticians talk about the position of the jetstream as an indicator of the local weather condition to be expected.
Assumption 1: The latitude of dynamic instability of the westerlies as calculated by Smagorinsky is a valid estimate of the latitude of the subtropical anticyclones.
That this is valid was first suggested by Flohn, who used the term "Z-Criterion." Tests with modern data give abundant evidence that the assumption is valid even regionally, and gives very close estimates. The Z-Criterion calculation requires only the large-scale meridional and vertical temperature gradients. The meridional gradient is easily calculable, but the vertical gradient must be estimated at present. Since equatorial temperatures hardly vary during the course of the year and in time, the meridional temperature gradient is a function of the mean hemispheric temperature. This would be true even is there were a small variation of equatorial temperatures proportional to the mean temperature. The vertical temperature gradient is a function of season (it is well-known that the annual course of temperature aloft lags behind the surface temperature). These relationships must be determined empirically using modern data.
Assumption 2: Assume that the latitude of the jet stream is closely related to the outer edge of the westerlies as calculated with the Z-Criterion.
Assumption 3: The variation of the latitude of the intertropical convergence is closely related to the variation of the latitude of the related subtropical pressure system.
This relation has been demonstrated for the present day annual shift of these "centers of action." The predictors of these latitudes are outputs of the previous steps, so that the past history of these parameters may be calculated directly. There is, however, little proxy data with which to compare the results.
Step 4 Inputs- Output of selected previous steps as needed
Basically, the only calculated inputs available are the outputs of the Lettau protocol described above. These must be used with present day large-scale climatic data to obtain estimates of the past history of the centers of action. Present day values are contained in the file PARA-NOW.WR1.
Step 4 Output- The calculated "center of action" values for the past have, for the most part, already been calculated and are contained on the reference diskette as modules, such as NAJL-1.WR1 for the North American jet latitude.
F.5 CALCULATING LOCAL CLIMATE HISTORY
The preceding steps lead to the main purpose of the model, which is calculating an estimate of a site-specific climate history.
Step 5 Calculate Local Climate History
This is where the spreadsheet modules are assembled into a climate model. The modeler must use his/her knowledge of the local synoptic climatology to identify the major large-scale forces that shape the local climate. This could be the Jet Stream, the Azores High, the Pacific High, or any number of other synoptic structures. Many users will find the general literature of climatology, and in particular of synoptic climatology, useful at this point. The remainder of the Bryson workbook is guidance for this step, and includes an example.
Step 5 Inputs- Output from some of the previous steps. This is in the form of modules on the reference diskette. (A list of available modules is given in Appendix F of the workbook.)
- Local modern climate data (monthly temperature and precipitation)
- Regional modern upper air data, such as jetstream latitude. This is given in most cases in the module called PARA-NOW.WR1
- Knowledge of the pertinent synoptic climatology of the area
Step 5 Output - Temperature and precipitation models.
F.6 REQUIREMENTS TO MODEL THE PAST CLIMATE AT A NEW SITE
1. A spreadsheet program. At present, the needed pre-calculated values to be used are stored as modules on electronic spreadsheets in Lotus format. These spreadsheets can be loaded into almost any other program for modeling. A list of modules containing inputs for calculating models for new sites is given in Appendix F of the workbook.
2. Present day climatic data. This includes monthly mean temperature and precipitation values at the site for which a modeled climatic history is desired. This may be a nearby (but representative) climate station (this type of data in the United States can be found on the Internet). The present climate may have to be interpolated from climate stations in the same physiographic region. Some commentary on how to interpolate climatic data is given in Appendix E of the workbook.
3. An analysis of which features of the General Circulation are important in determining the annual march of the climate at the chosen location. For example, the monthly rainfall at Madison, Wisconsin, is very closely related to the monthly position of the polar front, along which storms move. This location is indicated by the monthly position of the jetstream, which has already been calculated for North America. It is then necessary to establish how the precipitation amounts are distributed with respect to the position of the jetstream. This may be an intensive analysis of much data, or may, as a first approximation, be done statistically by fairly simple regression. Clearly, a good knowledge of synoptic climatology is useful, whether it be one’s own or that of another project member.
Precipitation in Minnesota is dominated by three air masses; the cold, dry Northern Polar, the warm, moist Gulf of Mexico Air, and the western airmass, which was modified on its trip through the Rocky Mountains. Long term precipitation trends are defined by the change in the monthly location of the Jet Stream. The best example of this is in Minnesota is in the winter, when cold, dry, Arctic air commonly called an Alberta Clipper, is associated with clear weather. Schematically this is when the jet stream is south of our position. Conversely, warmer winters have more precipitation because the jet stream is north of our position allowing the moister gulf air further north. This is reflected in the precipitation model by plotting the present day jet latitude against monthly precipitation. For locations in Minnesota, the relationship between jet location and precipitation emerges. This effect must be tempered in the model because cold weather snow is possible, just less likely. To capture this the jet is blurred with a function. Present day modeled precipitation for a location is adjusted with present day 30 year averages. This difference is then applied to the entire model at this location.
Temperature is calculated by taking the modeled North American temperature gradient and adjusting it site by site, month by month, each 200 years back to 10 ka. It is assumed that the 30 year monthly temperature averages have encode the local physiographic features. The modeled North American temperature gradient is calculated using assumptions 1-4 in this appendix. The most important steps to keep in mind are: (1) Orbital geometry defines the strength of the radiation reaching the earth. (2) Volcanic aerosols control the amount of energy that is reflected back into space by the atmosphere. (3) Glacial surface area is the dominant factor defining the amount of energy reflected by the surface of the Earth.
For most users, the output of all but the last step need be done only once and is included with the modules. Users need not recompute the modules in the course of modeling a new site.
Pollen, primarily from cores of lakes and bogs, has been extensively used to interpret the past distribution of vegetation because of the relative simplicity of the method. In Europe and North America, the density of the data is quite high. Understandably, the data are best for the more recent past. The Holocene, the geologic epoch that encompasses the last 10,000 years (10ka), is well represented. Past 12ka, the reliability of the dating, usually from carbon 14, deteriorates, and beyond 18ka, when the extent of ice sheets during the last glaciation was at its maximum, there are very few data at all. Data were received from the National Geophysical Data Center (www.ndgc.noaa.gov) in Boulder, Colorado. These data consist of raw pollen counts (the number of pollen grains found at each depth and a list of carbon 14 dated depths. These data were processed into pollen percentages, a much easier form to compare and analyze.
The percentage data, irregular in time, were processed with the carbon 14 data through linear interpolation into 100 year time slices which can be added to and analyzed in Mn/Model.
The pollen data are in the form of files. An example is file MNPin0035, which has the following form:
58
-93.75000 49.58333 391.0000 60.03897
-90.35000 45.30000 470.0000 71.67542
-90.35000 45.30000 470.0000 68.15539
-93.70000 42.26000 317.0000 3.083916
-93.11667 44.83333 254.0000 8.350400
-92.62000 46.72000 386.0000 66.62424
-89.90000 46.25000 488.0000 46.51469
-91.11667 48.00000 462.0000 66.63404
-92.82500 45.05000 258.0000 11.50420
...
The name MNPin0035 shows that this file is from the Minnesota region and represents 350 kA 58 is the number of pollen cores in the time slice. 93.75000 is the Longitude of the site, 49.58333 is the Latitude, 391.0000 is the elevation and 60.03897 is the percentage of pollen at this time slice.
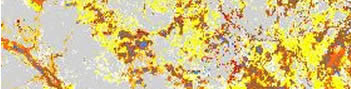
In the course of processing the North American Pollen Database, MPEG movies were made, which are available for viewing at BRW or the University of Minnesota.. Minnesota is in an advantageous position for looking at the East-West migration of the forests concentrated in the North-East quadrant of the state. The prevailing wind is westerly and transports the pollen from the forest in back into itself. Many cores have been taken over the years in Minnesota. In many counties in Northern Minnesota there is more than one core per county. A disadvantage is that the pollen database is a compilation of the percentage of pollen data in a specific core taken from a specific lake. It is not the percentage of a give species at that point. Care must be taken to interpret the database and animations.
Experience in testing the various simulations of the model run revealed several fine-scale problems in using the model:
- There is a very real problem in creating comparable temporal units, especially when cultural indicators are considered. In a very general sense, cultural indicators of environmental change (e.g., changes in lithic technology to accommodate changes in the resource base) operate in similar ways to other proxy data in that they have, for example, differing rates of change and lag times. Further, the temporal resolution of the model presented here is rarely matched by archaeological data, including chronometric data in many cases, and even the fine resolution of dendrochronology has built-in biases that may be misconstrued.
- There may be very real differences between the climate histories of areas in close proximity to one another. This is particular the case for areas of mountainous or hilly terrain, as in the "Driftless" area of southeastern Minnesota. In these cases, regionally specific models must be tested against regionally acquired field data to test the assumptions built into the modeler’s interpretation of the regional synoptic climate.
- Some caution should be exercised when applying the output of this modeling technique to various intervals within the Holocene, particularly the very early Holocene. Just as there are geographical regions for which climatic modeling is less complicated than for others, so too are there time periods that pose more difficulties than others.
- The model is unable to consider the effects of regional physiographic features that were not present during the 30 years of weather records used as input. Consequently, the model ignores the moderating effects of glacial lakes on Minnesota's early Holocene climate.
- Only data from Minnesota were modeled. When the modeled data are interpolated into a surface using GIS, the absence of data from adjacent states results in distortions of the surface near the state boundaries.
Because of these problems, the climate model output was not incorporated into Mn/Model. Likewise, the pollen data were evaluated and considered to be too low-resolution for our purposes. The evaluation of the climate model and pollen data are discussed fully in Section 6.3.
Bryson, R.A., D.A. Baerreis, and
W.M. Wendland
1970. The Character of Late-Glacial and Post-Glacial Climatic Changes.
In Pleistocene and Recent
Environments of the Central Great Plains,
edited by W. Dort, Jr., and J. K. Jones, pp. 53-72.
University of Kansas Press, Lawrence.
Bryson, R.A., And R.U. Bryson (in
collaboration with EMI Ito and Paul Morin)
1995. An Archaeoclimatology Workbook: High-Resolution, Site-Specific,
Climate Modeling for Field
Scientists (Version 1.14). Center for
Climatic Research, the University of Wisconsin-Madison, and
Department of Geology and Geophysics, University
of Minnesota, Minneapolis.
Bryson, R.A., And G.J. Dittberner
1976. A Non-Equilibrium Model of Hemispheric Mean Surface Temperatures. Journal of Atmospheric
Sciences 33(1):2094-2106.
Moran, J.M., And R.A. Bryson
1969. The Contribution of Laurentide Ice Wastage to the Eustatic
Rise of Sea-Level: 10,000 to 6,000 Years
BP. Arctic and Alpine Research 1(2):97-104.
The Mn/Model Final Report (Phases 1-3) is available on CD-ROM. Copies may be requested by visiting the contact page.

Acknowledgements
MnModel was financed with Transportation Enhancement and State Planning and Research funds from the Federal Highway Administration and a Minnesota Department of Transportation match.
Copyright Notice
The MnModel process and the predictive models it produced are copyrighted by the Minnesota Department of Transportation (MnDOT), 2000. They may not be used without MnDOT's consent.