Quick Links
Chapters
- Management Summary
- Research Design & Time Line
- Environment & Native American Culture
- GIS Design
- Archaeological Database
- Archaeological & Environmental Variables
- Model Development & Evaluation
- Model Results & Interpretation
- Project Applications
- Model Enhancements
- Model Implementation
- Landscape Suitability Models
- Summary & Recommendations
Appendices
- Archaeological Predictive Modeling: An Overview
- GIS Standards & Procedures
- Archaeology Field Survey Standards, Procedures & Rationale
- Archaeology Field Survey Results
- Geomorphology Survey Profiles, Sections, & Lists
- Building a Macrophysical Climate Model for the State of Minnesota
- Correspondence of Support for Mn/Model
- Glossary
- List of Figures
- List of Tables
- Acknowledgments
Chapter 7
Model Development and Evaluation
By Elizabeth Hobbs, Craig M. Johnson and Guy E. Gibbon

Chapter
7 Table of Contents
7.1 Introduction
7.2 Types of Models
7.2.1 Site Probability
Models
7.2.2 Survey Probability
Models
7.2.3 Survey Implementation
Models
7.3 Model Formulation
7.3.1 Statistical Model
7.3.2 Dependent Variable
7.3.3 Independent Variables
7.3.4 Database Preparation
7.3.5 Training and Test
Populations
7.3.6 Running the Models
7.4 Model Application
7.4.1 Calculation of Model
Values
7.4.2 Applying Models to
the Landscape
7.5 Model Evaluation
7.5.1 Model Classification
Procedures
7.6 Interpretation
7.6.1 Approach
7.6.2 Methods
7.6.3 Considerations in
Interpreting Site/Environment Relationships
7.7 Modeling from the Statewide Database
7.8 Refining Models
7.9 Conclusions
References
The modeling approach chosen for this project was an inductive empirical method based on statistical relationships between the locations of archaeological sites and their surrounding environment. This kind of model is predictive, but not explanatory. This approach is the most productive for the goals of this project because it reduces the element of subjectivity. It can also handle large volumes of data and be utilized consistently across a number of environmentally diverse regions. Though the methods used for each region are identical and replicable, the model results appropriately vary by region. Since the model results are expressed mathematically, they can be applied to all cells in a region by using map algebra capabilities in a raster GIS. This allows displaying model results in map format and testing of the model beyond previously surveyed areas.
Chapter 7 examines the process of model development and evaluation, including discussions of which data subsets were modeled and statistical techniques used to select model variables. It then considers issues arising when applying models to the entire landscape of a region and assessing model performance.
The objective of the project was to build archaeological predictive models, that is, models predicting the potential of finding archaeological resources. Such models were built in all project phases. However, in Phase 3, two additional model types were developed. These were used to account for the survey bias observed in the archaeological database. All three model types are described in this section.
Site probability models predict the potential for finding precontact archaeological sites and were the first type developed. They classify the landscape as high, medium, or low potential for sites. Over the course of the three-year project, modeling procedures were refined to produce increasingly better model results. A model performs well if it places a large percentage of known archaeological sites in the high and medium site potential areas, provided these areas are a small percentage of the landscape. The project goal was to have 85 percent of sites in high and medium site potential areas and for these areas to occupy no more than 33 percent of the landscape.
7.2.1.1 Phase 2 Enhanced Models
Two variations on the site probability models were built in Phase 2 of the project. These are referred to as "enhanced" models because they have been enhanced by the addition of variables derived from datasets that are not statewide (or even region-wide) in coverage. One set, the Trygg enhanced models, obtained additional variables from digitized Trygg maps (Section 6.2.5.4). The other set, soil enhanced models, obtained additional variables from digital county soil surveys (Section 6.2.4.3). Neither type of model could be built for every region. Nor could they be built for entire regions. Enhanced models covered only the land areas of the counties within each region modeled that had the Trygg or soil data available. Aside from this, they were built using the same methods as other site probability models in Phase 2.
7.2.2 Survey Probability Models
In the course of evaluating preliminary site probability models, the non-random pattern of archaeological surveys in Minnesota became apparent. Site probability models often predict the locations of previous surveys almost as well as they predict the locations of known sites. This discovery led to the development of survey probability models, which predict survey bias. The high, medium, and low survey potential zones in these models indicate the likelihood that archaeologists have surveyed places with similar environmental characteristics.
These models classify the landscape as high, medium, or low potential for surveys. Ideally, surveys should be randomly distributed, with no discernible pattern between survey locations and environmental variables. If surveys are randomly placed, 85 percent of the land area must be classified as high and medium survey potential to capture 85 percent of the surveyed places. This would be a highly desirable outcome.
7.2.3 Survey Implementation Models
As the interpretation of the site probability models was dependent on the results of the survey probability models, it became clear that a combination of the two models would be most expedient for implementation. The survey implementation models are a composite of the two probability model types. In these models, an 'unknown' zone results from the coincidence of both low site potential and low survey potential. Making this zone explicit avoids the possibility for interpreting areas as having low potential for sites when, in fact, these and similar places have not been adequately surveyed. Outside this 'unknown' zone, the survey implementation models identify eight levels of low, medium, and high site potential, with weights assigned to these based on survey potential values. Only in areas with a high potential of having been surveyed can site probabilities be estimated with confidence. Where survey potential is low, the medium and high site potential cells are classified as 'suspected.' Where survey potential is medium, site potentials are classified as 'possibly' low, medium, or high. MnDOT's Cultural Resources Unit will use the survey implementation model to design sampling strategies for future archaeological surveys.
Methods used to formulate the site probability and survey probability models are discussed in this section.
Logistic regression was selected for use in this project for several reasons:
- It is appropriate for presence/absence data.
- It is valid for these data, because it does not assume normality.
- Logistic regression has been used successfully in developing other predictive models (Anderson 1995; Hammer 1993; Kvamme 1992; Young et al. 1995).
Logistic regression models predict a categorical variable, site presence or absence. Site presence in a cell is represented as a value of 1, where site absence is represented by a value of 0. Although it is possible with other techniques to develop models predicting some numeric characteristic of sites (such as density or diversity of artifacts), the available database was inadequate to build such a model.
Warren (1990) provides an excellent discussion of logistic regression. Whereas the dependent variable in the logistic regression is categorical (e.g. presence/absence of sites), the independent variables (characteristics of the environment) can be measured on nominal, ordinal, interval, or ratio scales. This provides the modeler with enormous flexibility in selecting and measuring the independent variables. The regression function is a relationship, or equation, that predicts the probability that the dependent variable, a site, is present. This probability is expressed as a value between 0 and 1.
Logistic regression was the most accessible technique in Phase 1, as it is available in the ARC/INFO GRID software used to develop the database and derive the environmental variables. In Phase 1, the project statistician tested logistic regression and other methods using S-Plus statistical software. Logistic regression in S-Plus provided the best results. Also, by comparing the regression results from ARC/INFO GRID and S-Plus, it was discovered that very small co-efficients were rounded to 0 in GRID. Because some Mn/Model environmental variables, particularly distance variables, have very large values, this made a significant difference in how well the GRID-derived models performed. S-Plus was used to run the logistic regression in Phases 2 and 3.
7.3.2.1 Site Probability Models
The dependent variable for the site probability models is the presence or absence of archaeological sites. This section discusses how these two aspects of the dependent variable were defined in each phase of Mn/Model and the considerations given to these definitions.
7.3.2.1.1 Site Presence
Site presence could be defined very simply as the occurrence in a cell of any archaeological site recorded in the database. Cells with sites present are assigned a value of 1. However, attempting to model all archaeological sites together may not produce the best results. Usually a subset of the population of known sites will be used as model input.
7.3.2.1.2 Exclusion of Single Artifacts
For most survey probability models (exceptions are noted in the next paragraph), in all phases of this project, site presence occurred at cells containing the centroids of known sites that were not single artifacts. It was assumed that single artifacts could occur anywhere in the landscape and that their inclusion would reduce the predictive capabilities of the model.
7.3.2.1.3 Lithic Scatters
In Phase 2, models were also constructed that excluded lithic scatters, as well as single artifacts, from consideration as sites. Many lithic scatters are small and tend to be widely scattered over the landscape, much the same as single artifacts (Section 6.4.1.1). It is assumed that including these kinds of lithic scatters mask site locational patterns of value for cultural resource management.
There are, however, problems with the definition of lithic scatters in Minnesota’s SHPO database. The term is used to refer to both small lithic scatters and any assemblage of lithic artifacts and/or debris whose function has not been determined. These artifact assemblages, which do not meet the definition of small lithic scatters, are presumed to show a more patterned distribution and may indeed be significant sites. Any sites more than about 2500 years old will be among these lithic scatters (Scott Anfinson, personal communication 1996). Excluding these would reduce the ability of the model to predict early sites.
Given this situation, the question arises as to whether sites classified by the Minnesota SHPO as lithic scatters have sufficient site type integrity to be excluded as a class from the site types modeled. This issue was considered in the design of the Phase 3 modeling procedures. One particular concern was the potential loss of older sites from the model. Of 408 Archaic and Paleoindian sites in the archaeological database, 361 (88.5 percent) were lithic scatters. Moreover, comparing the Phase 2 models with and without lithic scatters did not demonstrate superior performance by the exclusion of lithic scatters (Section 8.6.2). For these reasons, lithic scatters were not excluded from the population of sites modeled in Phase 3.
7.3.2.1.4 Site Absence
Site absence is as important in model development as site presence. Characteristics of the locations of sites must be compared and contrasted with characteristics of the locations of nonsites to determine differences. For the logistic regression analysis, cells containing nonsites are assigned a value of 0. Ideally, nonsite locations should be representative of all kinds of environments where sites are not found and should have been surveyed to verify that no sites are present.
7.3.2.1.5 Negative Survey Points
In Phase 1, site absence was represented by negative survey points taken from areas surveyed in probabilistic or qualified CRM survey locations where no sites were found. However, if survey locations are biased (i.e. vary from a simple random survey), this population of nonsites would not be representative of the landscape as a whole.
Unfortunately, the Phase 1 model evaluations showed that negative survey points to be distributed in the landscape more like sites than would be expected had they been randomly chosen. This is a strong indication of survey bias. There are several reasons for this bias:
- Mn/SAS and many CRM surveys used a sampling technique that was biased towards where archaeologists expected to find sites. This usually meant that more surveying was done near water than away from water.
- These points tend to be clustered geographically because multiple points were often taken from the same survey area.
- The negative survey points are in many cases near sites locations that were discovered in the same survey.
Since the spatial distribution of negative survey points differs little from that of sites, the statistical analysis of these relatively small differences would be expected to produce weak models.
7.3.2.1.6 Random Points
Construction of the site models relies on the contrast between site and nonsite locations. Because of the biased distribution of the negative survey points described above, this contrast may not be great. Given the fact that archaeological surveys tend to be conducted in areas thought to have a high or medium potential for containing sites, some modelers (Kvamme 1988:357) suggest using points positioned randomly across the landscape as a baseline by which environmental characteristics of site locations can be compared. Since most of these "nonsite" locations have not actually been surveyed to determine the presence or absence of sites, their use can only be justified in cases where the actual a-priori occurrence of sites is thought to be low. In other words, placing points at random across the landscape by computer and measuring their environmental characteristics can be justified only when the actual probability of finding a site is very low. The discussion in Chapter 5 indicates that for two counties (Wright and Wabasha) surveyed by a simple random sampling design, the chances of finding a site at a 'nonsite' random point is low (0.47 and 1.43 percent of surveyed areas, respectively).
For this reason, nonsites in Phase 2 and 3 site probability models were represented by truly random points. These points were generated by the GIS throughout the regions modeled. These same computer-generated random points are also used in the construction of the Phase 3 survey models, under the same assumption that the areas archaeologists have examined (i.e. all sites including single artifacts, negative survey points) will rarely coincide with the random points. The use of random points also has the advantage of providing a much larger number of points for comparison to archaeological sites and surveyed places.
7.3.2.2 Survey Probability Models
For the survey probability models developed in Phase 3, the dependent variable was presence or absence of a previously recorded survey. Survey presence was defined to occur in any cell that contained either the centroid of a known archaeological site (of any type in the archaeological database) or a negative survey point (see Section 5.5). Concern was expressed that using the population of sites to represent surveyed areas would bias survey probability models to show the same patterns as site probability models. However, in all regions the number of negative survey points far exceeds the number of known sites. The sites were included primarily because they were the only representatives of locations of surveys done before the 1970’s. In the future, when more surveys have been conducted using probabilistic sample designs and survey locations are recorded more consistently, it will be possible to develop better survey probability models using only negative survey points to represent the dependent variable. Random points were used to represent unsurveyed areas for the Phase 3 survey probability models.
Independent variables, those used to predict the presence or absence of the dependent variable, represent aspects of the environment thought to be related to the location of archaeological sites. These are the environmental variables discussed in detail in Chapter 6. The same variables were used in both the site and survey probability models.
Most of the environmental variables used in Mn/Model have a truly continuous distribution of values. For instance, distance to water can range from 0 to a very large number. A few variables, such as river terraces, are represented by nominal values, recorded as present (1) or absent (0). One of the advantages of logistic regression is that it can use continuous, discontinuous, and nominal independent variables.
Many of the environmental variables used in Mn/Model had values with very large ranges. Consider a situation where the only lake in a region is in the northwest corner of that region. The variable distance to the nearest lake, measured in meters, would have values of 0 adjacent to the lake, but extremely large values in the southeastern corner of the region. In Phases 2 and 3 of the project, these variables were transformed to square roots to reduce the range, producing fewer outlier values in the tail of the distribution. This transformed, rather than linear, measure of distance also performed better in the models, indicating it may be a better indicator of the relationship between distance and human activity than distance per se.
The logistic regression analysis can process a very large number of independent variables. Mn/Model used 40 variables in Phase 1, up to 85 in Phase 2, and 43 in Phase 3 (Section 4.7.2). Smaller, more carefully selected sets of variables seem to improve model results because they contain fewer redundancies and a larger proportion of variables that have been shown to be good site predictors.
The first step in building the model is to create a database that includes values of all of the environmental variables (Chapter 6) for each of the site and nonsite records. Efficiency and flexibility can be gained by creating one master database that includes all site types (including sites that may later be excluded from modeling) and all nonsite types (both negative survey and random points). This is accomplished by a sampling function in the GIS. The database should also include additional variables by which the database can be sorted, such as site type. The same database can then be used for all possible permutations of the site and survey probability models.
In this database, columns hold the values for the dependent and independent variables. Rows represent the records for each individual site or nonsite. Databases for Phase 2 regions typically had more than 70 columns and more than 1,000 records. In Phase 3, the number of columns was reduced by eliminating some redundant variables, while the number of records increased dramatically with the addition of more sites and negative survey points from the US Forest Service database and the generation of additional random points.
S-Plus can be used to perform calculations on the database more efficiently than performing the same procedures in GRID. For Mn/Model, the database was processed in S-Plus to compute transformations of the original variables. Two kinds of variable transformations were used. For variables with very large ranges and skewed distributions, primarily distance variables, square roots were used to reduce variability. For directional variables, sine and cosine were taken. In Phase 2, transformed variables were added to, rather than substituted for, the original derived variables in the database. On the basis of the Phase 2 results, it was determined that these transformed variables generally performed better than the original derived variables. For this reason, the transformed variables were substituted for the original variables in Phase 3.
The S-Plus logistic regression routine provides some quality control for the database and input file. Essentially, the routine will not run if certain kinds of errors are present. These errors may prevent the data file from being read at all:
- Syntax or punctuation errors in the user-generated input file used to run the routine.
- Discrepancies between information contained in the database and information contained in the input file (i.e. the input file may indicate that the database contains 1000 rows when it actually contains 999).
These errors are not always easy to locate. However, they must be located and corrected in order to proceed.
After the data file has been successfully read by S-Plus, the following errors may prevent the logistic regression routine from running:
- "Nodata" (missing) values anywhere in the database. Most often these were random points on the region boundary that could be deleted. Sometimes, however, they were an indicator of "holes" in the variable grids that needed to be fixed.
- Variables with no variance, i.e. every record in the database has the same value for the variable. This may occur if a feature, such as paper birch, is found everywhere in a region. In such a case the variable distance to paper birch would have the value "0" in every cell. This kind of error most commonly occurs in variables that were derived from very low resolution data sources.
- Duplicate variables, consisting of pairs of variables that are 100 percent correlated (i.e. have exactly the same values). For instance, if the only hardwoods in a region are in river bottom forests, then the values for distance to hardwoods and distance to river bottom forests will be the same.
S-Plus provides some output that helps identify the nature of the problem. However, quite a bit of detective work may be involved. Because S-Plus will not proceed with the analysis as long as any of these conditions occur in the database, identifying each offending variable and taking some action is necessary.
For Mn/Model, if missing data values were associated only with random points on the edges of regions, the points were removed from the database. If they were associated with gaps in data layers, these gaps were repaired if possible. If repair was not possible, the variable was removed from the database. Variables with zero variance were removed from the data set. When duplicate variables were identified, one was discarded.
7.3.5 Training and Test Populations
In all phases of Mn/Model, the site population was divided into a group of sites from which the model was generated (the training data) and a separate group of sites which were reserved to test the model (test population). However, criteria for separating these populations changed over the course of the project.
7.3.5.1 Phases 1 and 2
In Phases 1 and 2 the distinction between training and test data was based on the source of the site information. The training data were taken from three categories of sources: probabilistic surveys, qualified CRM surveys, and significant sites, as defined below.
Probabilistic surveys included surveys of six counties conducted as part of this project and surveys of an additional 23 counties conducted as part of the 1970 Minnesota Statewide Archaeological Survey (MnSAS). Of these, only three county surveys (Cass, Wabasha, and Wright) were based on a true simple random survey design. The others were based on various stratified random sampling designs that tended to favor investigation of parcels near water. These stratified survey designs have the effect of biasing the population of both sites and negative survey points towards near-water locations (see Section 5.3).
Qualified CRM surveys had to meet several criteria. There had to be sufficient information about location to accurately relocate the site. Field methods should have been rigorous, comparable to or better than 30-meter intervals between transects or shovel tests. Surveyed areas had to be larger than 2 acres and had to be made on undisturbed land. All qualified surveys occurred in 1983 or later.
Significant sites included those that had undergone data recovery/mitigation or that had been determined eligible for the National Register of Historic Places. Although these sites were first located in surveys that did not meet rigorous survey design criteria, they are considered important. Not including them in the model could compromise the model’s ability to predict important site types.
In the first two phases of the project, the test population consisted of the remaining sites in the archaeological database, including all sites provided by the U.S. Forest Service. It was assumed that the geographic distribution of these sites was biased by the non-probabilistic and presumably less rigorous nature of the surveys in which they were first discovered. As individual sites, however, their locations should be predicted by the model.
This method is technically the best, since it insures that models are built with the best available data. However, the result was that the training population was invariably much smaller than the test population. In most regions, this meant too few sites were available in the training data to build reliable models. Because training data sets needed to be enlarged to improve model performance and stability, other methods were adopted in Phase 3.
In Phase 3, the entire database was randomly divided into 10 classes, each containing approximately the same number of sites, negative survey points, and random points. The class number (1 through 10) for each site and nonsite was recorded as a variable in the database.
The original intention of this procedure was to allow for the use of jackknife methods for both the site and survey probability models (Kvamme 1988: 396). This would involve running 10 preliminary models for each region. For each model, nine of the classes would be used as training data and one as test data, with the class used as test data changing with each model until all are used. This procedure would maximize the number of sites or surveyed places in the training dataset. The 10 preliminary models produced could be evaluated independently and compared to determine their stability, then a final model could be run using the entire dataset. Unfortunately, this procedure proved to be far too time consuming to perform on more than 20 regions in the limited time available. Instead, the procedure was shortened to involve only two preliminary model runs, each based on a different randomly selected half of the database.
For the first preliminary model run, the training population was selected from the first half of the database (classes from 1 to 5), and the test population consisted of the remaining half of the database. For the second preliminary model run, the training data consisted of classes 6-10, while the testing data came from classes 1-5. This provided two site probability models and two survey probability models for each region, each run from a different subset of the data. Comparison of the pairs of site and survey probability models supported the evaluation of model stability and derivation of the KAPPA statistics.
The final Phase 3 site and survey probability models were developed using the entire database as training data. This decision was made based on the low stability of the majority of models produced from halves of the database. Since there no test population was available at the time of modeling, there was no way to evaluate how well the model predicted data that were not used to build it. It was assumed that the final model performed better and was more stable than the two preliminary models. Three years after development of the Phase 3 models, these models were tested using archaeological site data not available at the time of modeling. The results of these tests are presented in this report. Keep in mind, however, that the testing data are not probabilistic. They consist primarily of sites added to the SHPO database between 1995 and 2001. Some sites in this database have entry dates prior to 1995. They appear to meet the criteria for modeling, but were not in the Mn/Model archaeological database for unknown reasons. Many of the sites added to the database are from US Forest Service records, so the distribution of new sites is heavily weighted towards northern Minnesota. Consequently, not all regions are equally well tested by these data. During this period, Phase 2 and 3 models were being used by MnDOT to design surveys. Although efforts were made to include some surveys in low and unknown site potential zones, the high probability zone would have been disproportionately surveyed (Section 11.5). Other surveys were likely based on the same mental models used prior to the development of Mn/Model, introducing many of the same biases found in the training data. Until new survey location data become available in digital form, an analysis of survey bias cannot be performed.
Models are derived by running the training data through a logistic regression routine. This routine was available in both ARC/INFO GRID and in S-Plus. However, the performance and output of the two different software packages varied considerably.
7.3.6.1 Phase 1
Most Phase 1 models were based on subjective selections of groups of variables that were then submitted to logistic regression analysis in ARC/INFO GRID. The primary drawback to relying on logistic regression in ARC/INFO GRID is that there is no step-wise regression or variable selection routine available. Moreover, there is a limit of about 15 variables that can be included in a single regression. Consequently, it is not possible with only this software to try every possible combination of variables to find the best models.
When using GRID’s logistic regression function, any variables that were assigned coefficients of zero were excluded from further analysis. Remaining variables were then recombined and input into another regression. The models resulting from this method contained a relatively small number of variables (5-12). There was no efficient method for determining which subset of these variables contributed the most to the model’s power. Moreover, some of the discarded variables (those with coefficients of zero) may have been significant had their true coefficients been reported (see Section 7.3.1 and Section 7.3.6.2).
While these Phase 1 models were being built by the GIS team, the project statistician was experimenting with different methods in S-Plus. One of these was "Classification and Regression Trees" (CART). It uses a recursive partitioning algorithm to produce a "tree" of alternatives that divide data into groups, which are then predicted by some group statistic. The most successful models in this phase, however, were built using logistic regression in S-Plus.
In Phases 2 and 3, the stepwise logistic regression routine in S-Plus was used to identify the best site and, in Phase 3, survey probability models. This routine performs a backward stepwise procedure, starting with all variables, to determine the 30 variables likely to be the best predictors. This procedure is analogous to backwards stepwise in multiple linear regression but using logistic regression test statistics. It then evaluates all possible combinations of those 30 variables and suggests combinations from which to produce the most statistically valid logistic models. In its evaluation criteria, it penalizes models for each additional variable added. This is to reduce the chance of incorporating noise or anomalies from the training data into the models.
The output from the S-Plus routine includes a number of useful reports.
- The list of the 30 best variables.
- The probabilities associated with each of these 30 variables. These are the probabilities that the coefficient for a given variable is not zero.
- The five best combinations of variables (the models).
- The BIC (Bayesian information criterion), which is the major criterion of model strength. It is based on the model’s fit to the data minus a complexity penalty.
- The posterior probabilities of each of the best models. These can be interpreted as the percent probability that each model is the correct or true model.
- The estimated coefficient for each variable in each model. These are logistic regression coefficients. However, S-Plus does not report the intercept for the regression equation.
In Phase 2, the recommended combinations of variables were entered into the logistic regression function in ARC/INFO GRID to determine the model intercept and variable coefficients. The resulting regression equation was then applied to the regional data (see Section 7.4). In this phase it was noticed that coefficients provided by GRID were not always the same as those provided by S-Plus. This was usually attributable to rounding error.
GRID rounds coefficients to the nearest thousandth. In many models, coefficients of variables suggested by S-Plus were so small they rounded to zero. These were initially dropped out of the models. Later, to determine whether the variables with very small coefficients could influence the models, new versions of the models were created using the intercept from the GRID regression and the model coefficients from the S-Plus routine. The S-Plus variables with very small coefficients were usually associated with data values that were very large (e.g. distances or areas), so that they often had a strong impact on the model. Consequently, models built using GRID regression coefficients tend not to perform as well as models built with S-Plus coefficients, which are not rounded.
In Phase 3, S-Plus coefficients were used exclusively. ARC/INFO GRID contributed the model intercept only. However, some of the Phase 3 models would not run in GRID, so intercepts could not be determined. The implications of this are discussed in Section 7.4.1.
7.4.1 Calculation of Model Values
The regression procedure generates a logistic function that best predicts the presence or absence of the dependent variable (sites) as a function of the values of the independent (environmental) variables. The ARC/INFO GRID logistic regression reports the intercept and coefficients of this function, whereas S-Plus reports only the coefficients of the variables. When these values are applied in a logistic prediction equation to the environmental variables for a sample point, the result is a probability value in the range of 0 to 1. The equation takes the form:
y = 1/[1 + exp(- aiXi)]
In this equation, ai represents the coefficient for each variable in the model, while Xi represents the value of each variable. The coefficient a0 is coefficient of X0 (the constant) and X0 is assumed to be 1. The product a0 X0 is the intercept. The coefficient ai is the coefficient for the model variable i, and Xi is that variable’s value for a data record or grid cell.
The intercept, being a constant for each application of the equation, is not necessary for building a valid model. Relative values of raw model scores for cells within the region modeled will remain the same with or without the intercept. However, the intercept does affect the relative values of model scores between regions that are modeled separately, because the intercept determines the magnitude of the model scores. Nevertheless, even with the intercept included in the calculation of model scores, the model scores are not exactly comparable between regions. This is because the value for the intercept is largely a function of the ratio between sites and nonsites (or surveyed places and random points). This ratio varies from region to region.
So that model values for different regions could be compared, a correcting factor was added to the intercept for each model in Phases 2 and 3. This correcting factor was calculated as the natural log of the ratio of nonsites to sites (or random points to surveyed places) and added to the intercept. The calculation of adjusted model values was considered important for evaluating the degree of difference in probabilities among regions and for constructing a statewide map that accurately reflected the potential of finding sites throughout the state. However, because some Phase 3 models that were successful in S-Plus failed to run in GRID, no intercepts were reported. Consequently, the model values available in these regions could not be compared to those in other regions and could not be used to construct a statewide map. Another method was selected to develop a model with comparable values statewide (see Section 7.7). However, this method has its own flaws.
7.4.2 Applying Models to the Landscape
It would be possible, though very time-consuming, to do the entire analysis described so far by taking measurements for sample points (sites and nonsites) from paper maps. However, the model equation must now be applied to the entire landscape. This is done by calculating model values for every cell in the region, using the values of the model variables in each cell. As variable values vary from cell to cell, so do model values. To apply the results of the equation to a region, or even a much larger set of sample points, using manual methods would be prohibitive, if not impossible. The benefit of GIS is that the environmental variables are measured for every 30 square meter cell in the region. Thus, the model equation is easily applied to every cell in the region. This results in a regional map of probability values, expressed as floating point numbers ranging in value from 0 to 1. These values can be grouped into a smaller number of site or survey potential classes for model display and evaluation (see Section 7.5.1).
Although several statistics (BIC and posterior probabilities in S-Plus, chi-square and root mean square error in GRID) are reported by the regression analysis, they are not good indicators of practical performance. The best way to evaluate model performance is to compare the regional model’s predictions to the distribution of a separate set of known archaeological sites that were not included in model development (the test population discussed in Section 7.3.5). Consequently, populations of known archaeological sites (or surveyed places) were set aside for model testing. In Phase 2 the test data consisted of sites that did not meet the criteria required of modeled sites. In Phase 3 all sites and surveyed places were randomly divided in halves to set aside training and test data subsets (see Section 7.3.5.2). However, for the final Phase 3 models, the test population was not available until three years after the models were developed. This consisted primarily of sites added to the SHPO database in that three year period.
Models must be tested with reference to established goals. The stated goal, at the beginning of the project, was to develop a model that would predict 85 percent of the known sites in Minnesota. To operationalize this goal, more specific criteria were established. First, the definition of "prediction" had to be established. Second, a criterion for the relationship between land areas classified as having potential for sites (or survey) and prediction had to be determined. The ratio between the proportion of sites predicted and the proportion of land area classified as having potential for sites (or surveys) measures model performance.
For the definition of prediction, a minimum model value for prediction could have been established. Cells with higher values would be classified to indicate the presence of a site or surveyed place. Cells with lower values would be classified to infer site or survey absence. The establishment of the threshold value would necessarily be subjective in the early project stages, since there was not experience with model values and performance to refer to. Some regions have much higher values than others, as regions are not equally likely to contain archaeological sites. Moreover, low overall model values could be a function of lack of data in undersurveyed areas, rather than true site probabilities. Also, intercept values are necessary to determine true model values, and these were not available for all models (Section 7.4.1). Consequently, if arbitrary model values were used, some regions were at risk of being classified as low site potential throughout.
Since relative site potentials within regions were of greater interest, it was determined that model values be reclassified within regions to site potential classes (high, medium, and low). When associated with the Phase 3 survey models, these are survey potential classes. A site or surveyed place was defined as "predicted" by the model if it fell within either the high or medium site or survey potential class. The original goal established was for the models to predict 85 percent of all known sites. However, it was necessary to derive criteria for classifying cells as high, medium, or low site potential. The classification procedures used to achieve this in each project phase are described in the following subsection. The relationship between area and prediction varies, depending on the classification procedures used.
7.5.1 Model Classification Procedures
Procedures for classifying model values into high, medium, and low classes were developed in Phase 1 and further refined in Phases 2 and 3. Differences in classification procedures primarily impact the relationship between area and prediction. Procedures can be designed to keep the proportion of land area in each site potential class constant and allow the number of sites predicted to vary, to keep the proportion of sites predicted constant and allow the proportions of land area within each class to vary, or to allow both to vary. It is the ratio between the proportion of sites predicted and the proportion of land area classified as high and medium site potential that determines model performance. Performance can be improved by keeping site prediction constant (or raising it) and reducing land area or by keeping land area constant (or lowering it) and increasing site prediction.
7.5.1.1 Phase 1
7.5.1.1.1 Classification Procedures
For the initial models (Phase 1), it was determined, using the following reasoning, that a classification scheme should be based on area. If an entire region is classified as having a high potential for sites, it will accurately predict 100 percent of all sites. Obviously, for planning purposes this would be unusable. If 85 percent of a region is classified as high and medium site potential, then by chance alone the model should accurately predict 85 percent of all sites. Such a model, again, is not helpful. The intention of creating the predictive model was to have statistically viable correlations between site locations and environmental attributes rather than determining locations by chance. Therefore, high and medium site potential areas need to be classified so that they encompass significantly less than 85 percent of the region if they contain 85 percent of known sites.
The simplest method (and the one used in Phase 1) was to divide regions into three equal-area classes based on model values. The third of the cells with the highest model values were classified as high site potential, the third with the lowest value were classified as low site potential, and the remaining third were classified as medium site potential. If the three classes were assigned at random to a region, then by chance alone 33 percent of the known sites should fall within each category. If the classes are assigned by a model, and if that model performs better than by chance alone, significantly more than 66 percent of the sites should be in the high and medium site potential areas (which by definition constitute 66 percent of the landscape). Thus the goal became to build initial models for which 85 percent of known sites occurred with the high and medium site potential areas, which constituted 66 percent of the landscape. Evaluation of these models is simple, as only the percentage of sites predicted varies.
7.5.1.1.2 Results
This standard was applied to the evaluation of the initial models built for five partial regions, using Phase 1 county data only. The results are summarized in Table 7.1, clearly illustrating that the results met or exceeded this goal.
Table 7.1. Evaluation of Phase 1 Initial Models: Percent of Known Sites (excluding single artifacts) in each Site Potential Class.
Region |
Low |
Medium |
High |
High/Medium |
Nicollet County |
0 |
14 |
86 |
100 |
Southwest Riverine |
8 |
17 |
75 |
92 |
Prairie Lakes |
11 |
18 |
71 |
89 |
Southeast Riverine |
8 |
13 |
79 |
92 |
Central Lakes Deciduous |
14 |
27 |
58 |
85 |
Central Lakes Coniferous |
2 |
13 |
85 |
98 |
It is important that the model predict sites that were not part of the dataset used to build the model. Although the goal was stated in terms of all known sites, the real test of the model is in the prediction of test population sites. Table 7.2 evaluates the same Phase 1 models with respect to sites in the test population alone. As demonstrated, the results are comparable to all sites combined.
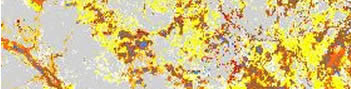
For initial evaluation of the Phase 1 models, water bodies, mines, and steep slopes were not excluded. The implications of this became apparent when comparing two of the models. In the best initial model for Nicollet County (Figure 7.1), the model assigned high site potential values to water bodies. In the other, the best initial model for Cass County (Figure 7.2), the model assigned low site potential values to water bodies.
Table 7.2. Evaluation of Initial Basic Models: Percent of Test Population Sites in each Phase 1 Site Potential Class.
Region # |
Region |
Low |
Medium |
High |
High/Medium |
Pilot |
Nicollet County |
0 |
19 |
81 |
100 |
1 |
Southwest Riverine |
12 |
20 |
69 |
89 |
2 |
Prairie Lakes |
10 |
19 |
71 |
89 |
3 |
Southeast Riverine |
7 |
10 |
83 |
93 |
4 |
Central Lakes Deciduous |
16 |
29 |
55 |
84 |
5 |
Central Lakes Coniferous |
3 |
12 |
85 |
97 |
In the first case, if water was considered to be outside of the area of interest for planning, then less than 66 percent of the dry land and wetland area would have been classified as high and medium site potential, without reducing the number of sites predicted. This in effect improves the model, for 100 percent of the sites would have been in less than 66 percent of the dry land area.
In the second case, if water bodies are excluded, then more than 66 percent of the dry land and wetland area would be classified as high and medium site potential, reducing the performance of the model. Having water bodies classified low site potential is not efficient for planning purposes. Reclassifying the same model, so that a third of the dry land area (rather than the total area) of the region is in each category would result in a reduction in the number of sites predicted.
7.5.1.2.1 Exclusion of Water Bodies, Mines, and Steep Slopes
Because of the Phase 1 results discussed in the previous section, consideration was given to excluding not only water bodies, but also other areas where sites are unlikely to be found or where surveys are unlikely to be required. Several options were considered. It was determined that water bodies, mines and steep slopes were unlikely areas for projects, except along their edges. Wetlands, on the other hand, are often ephemeral and may be drained for project work. On that basis, it was decided that model classifications should extend to wetlands but not to water bodies, mines or steep slopes.
The determination of what constituted "steep slopes" for the purpose of this model was based on an analysis of the relationships between known sites and slope (Table 7.3). Of 1,874 sites in 8 subregions (Border Lakes, Central Lakes Coniferous South, Central Lakes Deciduous East, Central Lakes Deciduous West, Lake Superior North, Lake Superior South, Northern Bog West, and Southeast Riverine East), the minimum slope was 0, the mean was 3 degrees, and the maximum was 40 degrees (about 85 percent). The variance was 13 degrees (about 20 percent) and the standard deviation was four. Approximate correspondence between degrees of slope and percent slope are provided in Table 7.4. The regions with the steepest slopes were Southeast Riverine East, with a range in slopes from 0 to 57 degrees and Southeast Riverine West, with a range from 0 to 63 degrees. In these data, 96 percent of the archaeological sites are on 10 degree (18.3 percent) slopes or less. Based on this analysis, any slope greater than 10 degrees was considered to be "steep."
Table 7.3. Association of Known Archaeological Sites with Slope.
Slope (degrees) |
Number of Sites |
Slope (degrees) |
Number of Sites |
|
0 |
310 |
14 |
6 |
|
1 |
476 |
15 |
12 |
|
2 |
339 |
16 |
6 |
|
3 |
217 |
17 |
5 |
|
4 |
177 |
18 |
2 |
|
5 |
112 |
19 |
4 |
|
6 |
59 |
20 |
1 |
|
7 |
36 |
21 |
2 |
|
8 |
35 |
23 |
2 |
|
9 |
26 |
26 |
1 |
|
10 |
17 |
27 |
2 |
|
11 |
8 |
28 |
3 |
|
12 |
7 |
30 |
2 |
|
13 |
6 |
40 |
1 |
Table 7.4. Approximate Correspondence Between Degrees Slope and Percent Slope.
Degrees |
Percent |
10 |
18.3 |
20 |
37.3 |
30 |
59.0 |
40 |
84.5 |
The next question was whether to eliminate these areas before calculating the model or after calculating the model, but before classifying the region into site potential zones. The argument against excluding water bodies from model calculations was that there are known sites within lakes. These are either sites that were known before lake levels were raised by damming or sites that were discovered in dry years when lake levels dropped naturally.
Another argument is that, because of the varying horizontal accuracy of the mapped data and the 30-meter resolution of the model, sites on the shores of lakes may be mapped as being just within the lake. By the same token, some sites are recorded on slopes that are considered too steep to contain sites. That is probably because the slope of the 30-meter cell is an average that includes, for instance, a bit of the flat top of the bluff and a bit more of the bluff itself. Thus, removing lakes or steep slopes from consideration before calculating the models would remove the information contained by those sites from consideration in the model. Water, steep slopes and mines, on the other hand, are also likely to provide information about where sites are not located. To exclude these areas from the model calculations would reduce the level of environmental variability in the database and possibly reduce the model’s ability to distinguish between sites and nonsites.
It was determined that water bodies, mines and steep slopes be left in for the calculation of the models, but removed before classifying the site potentials. Thus, the high, medium, and low site potential areas will contain only dry land, wetlands, slopes less than 10 degrees, and areas not altered by surface mining. Consideration was given to the possibility that known sites can and do occur in these excluded locations. This risks having a number of known sites without associated site potential values. Model testing is more effective with large numbers of known sites.
To increase the probability that known sites fall into either the high, medium or low site potential areas, rather than excluded areas, lakes were reduced by three cell widths (90 m) along each edge before eliminating them from model grids. Thus, all cells within lakes, but within 90 meters of the shore, would be classified as high, medium or low site potential, rather than as "lake." Consequently, any known sites within this zone can be used to evaluate the accuracy of the model. A similar consideration was given to double line rivers, steep slopes, and mines. However, since all of these have steeper profiles, they were reduced in area by only one cell width (30 meters) along each edge to increase the probability of capturing sites along their edges.
With the water bodies, mines, and steep slopes excluded, the models were sliced into site potential classes (see below). Table 7.5 reports the percentage of each modeled region that was excluded from Phase 2 models because it was defined as water, steep slopes, or mines.
Table 7.5. Distribution of Water, Steep Slope, and Mines in Phase 2 Regions.
Region |
% Water |
% Steep Slopes |
% Mines |
1 Southwest Riverine |
0 |
< 1 |
0 |
2e Prairie Lakes East |
1 |
< 1 |
0 |
2n Prairie Lakes North |
<1 |
<1 |
<1 |
2s Prairie Lakes South |
<1 |
<1 |
0 |
3e Southeast Riverine East |
<1 |
13 |
0 |
3w Southeast Riverine West |
< 1 |
3 |
0 |
4e Central Lakes Deciduous East |
4 |
< 1 |
0 |
4s Central Lakes Deciduous South |
3 |
<1 |
0 |
4w Central Lakes Deciduous West |
5 |
<1 |
0 |
5se Central Lakes Coniferous South and East |
1 |
<1 |
1 |
5cnw Central Lakes Coniferous Central, North, and West |
5 |
<1 |
1 |
6 Red River Valley |
<1 |
<1 |
0 |
7 Northern Bog |
4 |
<1 |
0 |
8 Border Lakes |
4 |
<1 |
<1 |
9 Lake Superior |
6 |
2 |
0 |
7.5.1.2.2 Classification Criteria
After excluding water, steep slopes, and mines from the model, it was necessary to determine breakpoints between high, medium, and low site potential classes. The method used in Phase 1 for model reclassification (assigning 33 percent of the area to each of the three classes) was rejected, since it did not allow adjustment in the size of the site potential areas or the number of sites predicted. Three criteria were considered. The first was to predict 85 percent of the known sites. The second was to have the high and medium site potential areas as small as possible. The third was to achieve the best model gain possible. Measurement of model gain using Kvamme's gain statistic is discussed below.
Kvamme’s gain statistic was used in Phase 2 to estimate the model’s level of improvement over chance at different cut points. It was subsequently used, in Phases 2 and 3, to provide a single measure of model performance that would allow comparison of models predicting different percentages of sites and with different proportions of the land area classified as high and medium site potential.
Gain is calculated as
1 - (percent area/percent sites)
where percent area is the percentage of the region in the high or high and medium site potential areas and percent sites is the percentage of known sites of the type modeled actually found in the same area.
A perfect model would include very little area in high and medium site potential classes, but would accurately predict 100 percent of sites. The gain statistic for that model would be very close to one. In a poor model, that provided no improvement over chance alone, the percent area classified as high and medium site potential would equal or even exceed the percentage of sites predicted. The gain statistic for such a model would be very close to zero.
7.5.1.2.4 Classification Procedures
Phase 2 classification procedures were designed to consider all three of the criteria selected. The determination of which cut points to accept was based on which would produce the best overall gain statistic. The overall gain statistic was always calculated using the entire population of known sites of the type modeled, no matter which population was used to determine cut points.
To provide the desired flexibility for classification, the model was sliced into 20 equal area site potential classes, after excluding water, steep slopes, and mines. The next step involved examining the distribution of sites among these 20 classes to determine site potential class cut points. Distributions of modeled sites alone (the training data) and all known sites combined (training plus test data) were examined separately. Starting with the highest site potential class, this evaluation determined how many classes were required to hold the first 70 percent and next 15 percent of sites from each population. The first tier of site potential classes, holding the first 70 percent of sites, became the high site potential class. The second tier, holding the next 15 percent of sites, became the medium site potential class. The remaining site potential classes became the low site potential class.
Where different cut points were suggested by the distributions of the training data vs. all known sites, the version that achieved the highest gain statistic was selected. This gain statistic was in fact an estimate, as it was calculated based on the assumption that the 20 classes were of approximately equal area, rather than on actual measurements of the area of each class. Once the final cut points were selected, the model was reclassified into three site potential classes.
7.5.1.2.5 Results
The Phase 2 models were evaluated by examining the distribution of the three site potential classes within the region and the distribution of surveyed points, modeled sites, test sites, and specific types of sites within the three classes. Maps and tables, comparable to those provided in Chapter 8, were developed to illustrate these distributions. Gain statistics were calculated for the high site potential and the combined high/medium site potential areas.
Table 7.6 reports the summary evaluation of the best Phase 2 site probability models, based on populations of sites excluding single artifacts. Models based on populations excluding both single artifacts and lithic scatters performed, on average, less well. One problem that is apparent from this evaluation is that most models predicted fewer than 85 percent of sites. This usually was the result of selecting cut points for higher gain, as that often meant decreasing the land area in high and medium site potential rather than increasing the number of sites predicted.
Table 7.6. Best Phase 2 Site Probability Models (Excluding Single Artifacts).
Region |
High/Medium |
High |
||||
% Area |
% Sites |
Gain |
% Area |
% Sites |
Gain |
|
Southwest Riverine |
35 |
86 |
0.59 |
15 |
69 |
0.78 |
Prairie Lakes East |
25 |
64 |
0.61 |
10 |
48 |
0.79 |
Prairie Lakes North |
20 |
71 |
0.71 |
10 |
53 |
0.81 |
Prairie Lakes South |
20 |
77 |
0.74 |
10 |
62 |
0.84 |
Southeast Riverine East |
34 |
72 |
0.53 |
26 |
51 |
0.49 |
Southeast Riverine West |
63 |
87 |
0.28 |
34 |
68 |
0.50 |
Central Lakes Deciduous East |
18 |
82 |
0.78 |
9 |
67 |
0.87 |
Central Lakes Deciduous South |
24 |
81 |
0.70 |
10 |
59 |
0.83 |
Central Lakes Deciduous West |
18 |
81 |
0.78 |
9 |
67 |
0.87 |
Central Lakes Coniferous South and East |
15 |
78 |
0.81 |
5 |
62 |
0.92 |
Central Lakes Coniferous Central, North, and West |
19 |
77 |
0.75 |
5 |
50 |
0.90 |
Red River Valley |
19 |
79 |
0.76 |
10 |
67 |
0.85 |
Northern Bog |
33 |
59 |
0.44 |
22 |
39 |
0.44 |
Border Lakes |
10 |
81 |
0.88 |
5 |
73 |
0.93 |
Lake Superior |
8 |
74 |
0.89 |
4 |
53 |
0.92 |
7.5.1.3.1 Classification Procedures
In Phase 3, model classification procedures were simplified. A decision was made to return to the initial project goal of predicting 85 percent of known sites and to use this as the sole classification criterion. Borrowing from the Phase 2 methods, the model was sliced into 20 equal area classes ranked by model values, after excluding water, steep slopes, and mines. The distribution of all known sites of the type modeled among these 20 classes was examined to determine site potential class cut points. Ideally, the first tier of potential classes, holding the first 70 percent of sites, became the high potential class. The second tier, holding the next 15 percent of sites, became the medium potential class. The remaining potential classes became the low potential class.
In reality, the sites were seldom distributed so that exactly 70 percent could be grouped in the high potential class and exactly 15 percent in medium potential. Table 7.7 shows the distribution of one hypothetical model among the original 20 potential classes. The decision rule for cut points was that the cumulative percentage closest to 70 became the cutoff for the high potential class and the cumulative percentage closest to 85 became the cutoff for the medium potential class. In the example below, 67.797 is closer to 70 than is 72.881, so class 18 became the cut point for the high potential category. Likewise, 83.051 is closer to 85 than is 88.136, so class 16 became the cut point for medium potential.
Table 7.7. Hypothetical Distribution of Site Probability Model Among 20 Site Potential Classes.
Initial Class |
Number of sites |
Cumulative Total |
Cumulative Percent |
Final Class |
1 |
0 |
0 |
100 |
Low |
2 |
0 |
0 |
100 |
Low |
3 |
1 |
59 |
100 |
Low |
4 |
0 |
58 |
98.305 |
Low |
5 |
2 |
58 |
98.305 |
Low |
6 |
0 |
56 |
94.915 |
Low |
7 |
0 |
56 |
94.915 |
Low |
8 |
0 |
56 |
94.915 |
Low |
9 |
1 |
56 |
94.915 |
Low |
10 |
0 |
55 |
93.22 |
Low |
11 |
2 |
55 |
93.22 |
Low |
12 |
0 |
53 |
89.831 |
Low |
13 |
1 |
53 |
89.831 |
Low |
14 |
0 |
52 |
88.136 |
Low |
15 |
3 |
52 |
88.136 |
Low |
16 |
6 |
49 |
83.051 |
Medium |
17 |
3 |
43 |
72.881 |
Medium |
18 |
16 |
40 |
67.797 |
High |
19 |
16 |
24 |
40.678 |
High |
20 |
8 |
8 |
13.559 |
High |
In general, the percentage of sites predicted by Phase 3 models is near 85 percent. Any variations from this figure are attributable to irregularities in the distributions of sites as described above. In some models, particularly for regions with low site numbers, these irregularities can be extreme. For example, the best model for the Laurentian Highlands, 95 percent of sites were contained in classes 19 and 20. Thus, these two classes became the high site potential area and there was no medium site potential area. All remaining classes were low site potential.
7.5.1.3.2 Measuring Model Stability
Gain statistics (Section 7.5.1.2.3) were calculated for assessing the performance of Phase 3 models. However, in Phase 2 it was observed that two models developed from different halves of the same dataset could both perform well, but look very different when mapped. This implied a large degree of uncertainty in which, if either, model actually represented the true distribution of archaeological sites in the region. For datasets where there are strong and consistent relationships between site locations and environmental variables, models from different subsets of the data should be very similar. Instability could stem from a variety of factors. These could include low site numbers (too little data for patterns to be discerned), inclusion of outliers in the dataset (sites that are quite atypical of the majority of sites in the region, such as very old sites or ceremonial rather than settlement sites), or inclusion of too wide a range of environmental situations within a region.
Model stability is a function of the similarity of different models developed from the same dataset of archaeological sites. Since the initial Phase 3 models were being developed from two randomly selected halves of each regional database, they provided the input for the model stability measurement (Figure 7.3).
The statistic selected to measure stability is the Kappa coefficient of agreement (Bonham-Carter, 1994: 245). Kappa measures the amount of agreement between the two models and corrects for the expected agreement due to chance alone. Agreement between each pair of models is first determined by overlaying the two models and counting the number of cells that received the same classification in both models (the diagonal total in Table 7.8). The cells in this matrix are then divided by the total number of cells in the region to create a matrix of the observed area proportion. From this, the expected area proportions are calculated. These represent the total expected agreement due to chance, assuming there is no correlation between the two models.
The Kappa statistic is then calculated by the formula:
K = (∑pii - ∑qii) / (1 - ∑qii)
where pii is the observed area proportion and qii is the expected area proportion. Kappa values range from -1 (perfect disagreement) to +1 (perfect agreement). The value 0 indicates the degree of agreement expected due to chance alone.
Conditional Kappa values (KI) can also be calculated for each of the site potential classes separately, using the formula:
KI = (pii - qii ) / (pi. - qii)
Table 7.8. Evaluation of Site Probability Model Agreement, Anoka Sand Plain Subsection.
Model 1 Scores |
Model 2 Scores |
Row Totals |
||
Low |
Medium |
High |
||
Low |
3755185 |
287331 |
140319 |
4182835 |
Medium |
288455 |
123050 |
146362 |
557867 |
High |
139215 |
147336 |
549697 |
836248 |
Column Totals |
4182855 |
557717 |
836378 |
5576950 |
Diagonal Total: |
4427932 |
Percent agreement: |
79.40% |
7.5.1.3.3 Modeling with All Known Sites, Excluding Single Artifacts
Preliminary Phase 3 models were developed using randomly selected halves of the database for each ECS subsection (Section 7.3.5.2). While many of these models performed very well, some did not because of low site numbers in the ECS subsections. In particular, concern was expressed regarding the low Kappa values derived for many pairs of subsection models. Since only one model from the pair could be used for implementation, the goal was for this model to be as accurate a prediction of known site potential as could be developed from the data at hand.
On this basis, the decision was made to develop the final Phase 3 models using the entire database. This has the drawback of losing the test population. However, these models can be tested in the future using data from new surveys. Meanwhile, they are evaluated on the basis of their gain statistics, the proportion of sites predicted, and the Kappa of the preliminary models. It is assumed that, were another database of equal size available to build a comparable model, the Kappa derived from the comparison of those two models would be higher than for the preliminary models developed from databases with half the number of sites. Consequently, by doubling the number of sites in the database, the potential stability of the resulting models should be improved.
All of the Phase 3 site and survey probability models reported on in Chapter 8 were developed from the entire database of sites, excluding single artifacts.
7.5.1.3.4 Modeling Combined Regions
Ecological Classification System subsections were the basic geographic unit for developing Phase 3 models (Section 3.5, Figure 3.11). However, even when the entire database was used, 13 of the 24 subsections had fewer than 130 known sites when single artifacts were excluded. All of these regions initially produced weak models, as evidence by low gain, low preliminary model Kappa, or both. The remaining subsections, with 220 or more sites, produced acceptable models. This is a fairly good indication of the minimum number of sites required to develop predictive models in relatively small, homogeneous environmental regions.
To improve model performance for these regions, they were combined with adjacent regions to increase site numbers, and new models were developed. Various combinations of subsections were tested modeling randomly selected halves of the database. Initially subsections with low site numbers were combined with adjacent subsections that were within the same ECS section. Sometimes these combinations did not perform well. In such cases, combinations with adjacent subsections from different ECS sections were tried.
Comparisons were made of all model pairs developed for each ECS subsection, including the models for the subsection alone and all variations of combined subsections. These comparisons were based on both gain and Kappa statistics as well as the proportion of sites predicted. Ideally, subsection combinations with the highest values for all three measures were selected as the final regionalization scheme for developing models from the entire database. In reality, some combinations produced more stable model pairs, while others predicted more sites or had higher gain statistics. In cases where the best subsection combination was not apparent, multiple subsection combinations were modeled using the entire database.
As a result of this effort, multiple models were developed for some subsections. For example, the Aspen Parkland subsection was modeled alone, in combination with the Hardwood Hills subsection, and in combination with the Agassiz Lowland and Littlefork-Vermilion Uplands. In these cases, all models were compared to determine which performed best for the individual subsection. In the case of the Aspen Parkland, the best site probability model came from the combined Aspen Parkland/Hardwood Hills model, while the best survey probability model came from the combined Littlefork-Vermilion Uplands/Agassiz lowland/Aspen Parkland model.
In Chapter 8, Phase 3 models are reported on for individual subsections and for three combined subsections. For six of the individual subsections reported, models are taken from combined subsections, as described above. Only when two or more subsections share the same best site probability and survey probability models are they reported on in combination.
7.5.1.3.5 Survey Probability Models
Phase 3 survey probability models were developed using exactly the same methods as the site probability models, except that surveyed places were used in place of sites. However, the evaluation of survey probability models is conceptually somewhat different. Ideally, surveys should be randomly distributed, with no discernible pattern between survey locations and environmental variables. If surveys are randomly placed, 85 percent of the land area must be classified as high and medium survey potential to capture 85 percent of the surveyed places. In other words, using the performance criteria for site probability models, it is desirable for survey probability models to perform poorly. However, this assumption can only be valid where there are enough surveyed places to develop a large database. Small databases may not contain enough information for patterns to be discerned, so may produce models that do not perform well but should not be interpreted as confirming that a region has been well surveyed.
In Minnesota, many surveys have focused on the kinds of places archaeologists expect to find sites, primarily near water bodies. Consequently, this pattern is discernible to some extent in all regions. Regions showing the most survey bias are in northern and southeastern Minnesota. In several of these regions, survey probability models perform nearly as well as site probability models, predicting a large proportion of the surveyed places in a relatively small medium/high survey potential land area. This indicates a very strong relationship between locations of surveyed places and of known sites. As a result, most areas that are classified as low potential for sites are also classified as low potential of having been surveyed. The conclusion from this is that site potentials may be misleading, in that sites have not been found in these areas primarily because such areas have not been adequately surveyed.
For evaluating and interpreting the survey probability models, it should not be assumed that every place classified as high survey potential has been surveyed. The high survey potential class represents environmental situations or settings statistically similar to those for which surveys are recorded in the archaeological database. One may conclude that such environmental settings have been better surveyed than environments with low survey potential. Low survey potential areas are in environmental settings unlike those of the known surveyed places. These kinds of places are not well represented in the database of known surveys.
7.5.1.3.6 Survey Implementation Models
Because information about unsurveyed or under surveyed areas is critical to the interpretation and implementation of the site probability models, composite models were developed to make the co-occurrence of site and survey potential classes between the two types of models explicit. These are the survey implementation models. They were developed by overlaying the best site and survey probability models for each region, then reclassifying the resulting grid on the basis of the combination of model values in each cell, according to Table 7.9.
Table 7.9. Reclassification of Co-occurring Site and Survey Probability Model Values for Survey Implementation Models.
Survey Potential |
Site Potential |
||
Low |
Medium |
High |
|
Low |
Unknown |
Suspected Medium |
Suspected High |
Medium |
Possibly Low |
Possibly Medium |
Possibly High |
High |
Low |
Medium |
High |
In the archaeological predictive modeling literature, two basic modeling aims with different goals have been identified (Tomlin 1990: 167-225; Warren 1990:90, 94-95; Leusen 1996:181-185). These two aims are often called the CRM approach and the Academic approach. In the CRM approach, the aim is to describe regularities in the locations and patterns of known archaeological resources to predict where other such resources may be found. This approach produces reports and maps that describe the archaeological sensitivity of places for planning purposes. With this approach, explanations of correlations between site locations and environmental variables are not required (Leusen 1996:184).
In the Academic approach, the aim is to reconstruct and understand motives and causes underlying locational patterns. Explaining these patterns in terms of cultural and environmental conditions, site formation processes, and site circumstances should lead to understanding past settlement choices.
The two aims lead to different modeling approaches as well as different procedures for interpreting, testing, and enhancing the results. The CRM approach is interested in location factors that have a significant statistical correlation to some set of sites. Models are usually based on the relationship between known surface sites and present environmental variables. Although this historical approach is well suited for modeling the present distribution of sites, its models are usually unsuited to making sense of past human behavior, since the present environment often bears little relation to past environments (Brandt et al. 1992).
In contrast, the Academic approach is interested in locational choice factors that were involved in the original process of site selection. This approach is best suited for modeling the past distribution of communities and, as a consequence, entails a huge effort in reconstructing past cultural and environmental conditions and processes. Here the choice of independent variables is explicitly based on our understanding of the settlement location factors important to the prehistoric population studied, and it is an aim of the modeling to increasing our understanding of these factors.
In practice, the distinction between these two approaches is often confused and blurred. Typically, some kind of interpretation is attempted in projects using the CRM approach for two reasons. First, it is easier to evaluate the results of locational models if they make archaeological sense. Second, it is easier to convince potential users or stakeholders that the results are meaningful if they can be grounded in cultural patterns as well as abstract statistical correlations.
Since Mn/Model has CRM objectives and is based on a CRM approach, its results have been interpreted and tested in conformity with this approach. The primary aims through the several stages of model development and refinement have been to reduce bias, reduce costs, and make accurate predictions. However, for the purpose of this report, some preliminary interpretations of the Phase 3 models have been provided. The primary emphasis of these interpretations is a graphical and statistical analysis of the contribution of the individual model variables. There is also an attempt to explore the relationships between certain cultural context, descriptive, or settlement variables and site potentials. This is accomplished using bivariate analyses focusing on several cultural components of the database. The interpretation methods used are described fully in Section 8.4.
The interpretations of the regional models rely on a number of interrelated graphical and statistical techniques, an approach pioneered by Kvamme (1985; 1992; 1994) and adopted by other modelers (Warren and Asch 1996). Basically, the approach in this report is to present maps of the site and survey models along with various summary statistics and histograms in order to explore the relationships between the site or survey potentials and the variables used to construct each model.
Most of the interpretation involves comparisons between sites and random points, in the case of the site models, or surveyed and random locations, as is the case with the survey models. Construction of the site models relies on the contrast between site and nonsite locations. These nonsite locations actually consist of a series of computer-generated random points spread across the landscape (Section 7.3.2.1). Evaluating the differences in the distribution of model variable values between the populations of sites or surveyed places and the distribution of random points serves to point out some of the key differences between site and nonsite locations as detected by the model.
An important goal in model interpretation is to be able to determine the relative importance that each biophysical variable plays in model construction. Although each model variable is accompanied by a regression coefficient and its associated probability value, the strength of these are difficult to interpret on an intuitive level. Another approach is to calculate correlation coefficients between the values all sites or surveyed places have on the variables used in model construction. The probability values for the 30 x 30 meter cells in which the sites or surveys occur are continuously (interval) scaled for this analysis. On the other hand, the model maps break these probabilities into three levels: high, medium, and low intervals. Finally, correlations between variables can show the degree of independence of the variables themselves.
Spearman’s rank order correlation coefficient was used to analyze correlations between sites or surveyed places and individual variables, as well as correlations between pairs of variables. This test provides an ordinal non-parametric measure of association that makes no assumptions about the distribution of the data (Siegal 1956:202-213). The coefficients range in value from –1.0 (perfect negative or inverse relationship) to 1.0 (perfect positive or direct relationship). For example, a high negative correlation (-0.5 to –1.0) between site probability and distance to nearest lake inlet/outlet means that as distance decreases, the probability of a site occurring generally increases. On the other hand, a high positive coefficient (0.5 to 1.0) between a variable like surface roughness and site potential means that as surface roughness increases, the probability of a finding a site also increases. For variable pairs, correlations at or close to zero indicate the variables are independent of one another.
Another statistical approach in model interpretation is to compare the mean or average value of modeled sites, negative survey points, and random points on each variable used to construct the site or survey models. The comparisons made on distance variables, except vertical distances to water, are based on untransformed values. This means that the transformed values (i.e. square roots) that are used in model construction and appear in the data tables need to be squared to retain their original linear scale. The significance of the differences between the sites and random points or the surveyed places and random points on each model variable is also evaluated by the Mann-Whitney U or Wilcoxon test on independent samples. This test does not require any assumptions of the shape of the distribution of the data (i.e. non-parametric) other than each variable be measured at least on an ordinal (ranked) scale (Siegal 1956:116-127). The test determines whether the sites vs. random points or surveyed places vs. random points are drawn from the same population. It is an alternative to the more familiar t-test that compares sample means, except that Mann-Whitney examines the ranking of scores between samples to determine if the two distributions are different by chance.
Construction of histograms of modeled sites, negative survey areas, and random points for each model variable complements the comparison of means by giving a graphical display of how each of these three groups is distributed. Comparing the modeled sites and surveyed areas against the random points provides a direct test of the classes used in model construction. That is, when the site and survey models are constructed, sites (and survey points) are compared to random points (nonsites or survey areas) to determine the set of variables that are most effective in discriminating between the two.
It can not be emphasized enough that these analyses are based on one model variable at a time whereas the models are multivariate in nature. Consequently, some of the statistics, especially those relating to variable correlations, are to be treated in a cautious manner. The presentation of several sources of statistical data is designed to add interpretive value to the models and avoid an over-reliance on correlation coefficients.
One final series of analyses is designed to explore the relationship between certain cultural context, descriptive, or settlement variables and site potential. This involves the creation of a series of nine bivariate tables for each subsection model based on the number of sites within each of the three site probability categories and the presence or absence of various site characteristics: 1) Paleoindian vs. not-Paleoindian; 2) Archaic vs. not-Archaic; 3) Woodland vs. not-Woodland; 4) Plains Village vs. not-Plains Village; 5) Mississippian vs. not-Mississippian; 6) Oneota vs. not-Oneota; 7) aceramic vs. not-aceramic; 8) mounds vs. not-mounds; and 9) single component vs. not-single component. Many of these relationships could not be explored for a number of subsections because of small sample sizes.
These dichotomies are defined as follows:
- Paleoindian sites date before about 6000/5000 B.C. and are characterized by a series of bison or mammoth kill or butchering sites. Other sites of this period include camps and quarries. Subsistence was largely based on large mammals. Nearly all sites contain diagnostic projectile points of this period or tradition. Non-paleoindian sites can be of any other age.
- Archaic sites date between about 6000/5000 B.C and 500 B.C. and are characterized by a number of kill, butchering, quarry, and camp sites. The basis of the economy during this period was the hunting of large and small mammals, fishing, and foraging of plants. Most sites contain artifact types, usually projectile points, diagnostic of this time period or tradition.
- Woodland sites date between about 500 B.C. and A.D. 1650. They are characterized by the presence of pottery, diagnostic projectile points and other artifacts, and/or earthen mounds. Subsistence was based on hunting and foraging, the intensive exploitation of wild rice and other seeds, and the beginnings of horticulture.
- Plains Village sites date between about A.D. 1000 and 1650. They are characterized by an economy dominated by bison hunting and corn horticulture. Villages and camps of this tradition are limited to the southwestern portion of the state and contain diagnostic pottery.
- Mississippian sites date between about A.D. 1000 and 1300. They are characterized by a dual economy dominated by corn horticulture and hunting. These sites are usually villages and camps, limited to the southeast part of the state. They contain diagnostic pottery and other artifacts.
- Oneota sites date between about A.D. 1300 and 1800. Typical sites of this period include villages and camps where subsistence depended largely on hunting and corn horticulture. These sites are spread throughout southern Minnesota where diagnostic pottery and projectile points are found.
- Aceramic sites are those lacking pottery, whereas non-aceramic sites contain pottery. The difference between the two groups probably reflects the amount of time they were occupied and the activities that occurred there. That is, aceramic sites (e.g. small lithic scatters) are generally thought to represent short term occupations and limited activities compared to sites containing pottery.
- Mounds are sites characterized by the construction of earthen mounds, usually circular or linear in form. Along with pottery, the presence of mounds is a diagnostic trait of the Woodland period or tradition. Mounds frequently, but not always, contain burials.
- Single component sites are those containing evidence for the presence of one component or occupation. Occupations can occur over a short or long period of time, marked by temporally diagnostic artifacts or features assigned to one time period.
The significance of these relationships is evaluated with chi-square, a non-parametric test of the independence between two variables (Siegal 1956:104-111). The value of the chi-square statistic is influenced not only by the inherent relationship of variables, but also the number of cells and sample size. That is, as the number of cells and sample size rises, the chi-square statistic also increases. To compensate for the number of cells, degrees of freedom (number of table rows times the number of columns) are used. For a given level of significance, a higher chi-square value is needed to reject the null hypothesis in a table with a high number of cells compared to one with a lower number of cells. A 0.05 level of significance is chosen for the two-tailed test of the null hypothesis that there is no relationship between site potential and various contextual variables.
It can be noted that the SHPO database, upon which these characteristics are based, is incomplete and contains numerous limitations. For example, many sites probably contain multiple components when in fact only one has been recorded. Other sites have been assigned to various contexts (e.g. Archaic) based on little diagnostic information. Under these circumstances, only the most general conclusions can be drawn from this analysis. The emphasis here is on the recurring relationships between the site locations and their characteristics that crosscut subsection boundaries.
7.6.3 Considerations in Interpreting Site/Environment Relationships
Evaluating the importance of environmental variables in site selection is not a straightforward process in Minnesota for a variety of reasons. One reason is extreme seasonality. The extremes of the seasons make some locations ideal cold weather sites and others preferred warm weather sites. The identification of different geographic clusters of warm and cold weather sites is a common result of site locational studies. For example, Neumann (1992) found that warm season sites in the South Branch of the Potomac River in the Middle Atlantic region cluster in the upper drainage, while lower drainage sites were cold season sites. In her settlement study of the Sangamon River drainage in central Illinois, Roper (1979) found that cold weather sites were clustered in the upper portions of the drainage and warm weather sites in the lower portion. Modeling approaches that adopt a site present/absent archaeological database blur these kinds of distinctions.
Another serious problem is the concept ‘site’ itself. As has been increasingly argued, the site concept by itself is inadequate in settlement pattern analysis and flawed more generally (Dewar 1986; Dunnell 1992; Dunnell and Dancey 1983; Ebert 1992; Foley 1981a, 1981b, 1981c; Gaffney and Tingle 1984; Van Buren 1990; Wobst 1983). Some of the problems with the concept quickly become apparent when terms developed by Binford (1982), Dewar (1986), Dewar and McBride (1992), and others for remnant settlement pattern analysis are applied to Minnesota’s archaeological record. According to this terminology, a site is simply a modern place where evidence of past human activity is preserved. An occupation is the archaeological remains of a group’s single use of a place, which could have been for a day or for years. Occupations are the archaeological equivalent of the camps and villages that appear in ethnographic descriptions of the seasonal round of a social group. A component is the archaeological remains of a period of use and human activity that cannot be subdivided chronologically. It is the product of one or more occupations. The area of a site is the area of continuous distribution of cultural debris, the area of an occupation the area of debris deposited by a single occupation or continuous period of use, and the area of a component the area within the site that bears evidence of all activities of a specified historic period. Given these terms, it is reasonable to ask questions like: How many components are present at a site (which in Minnesota is usually equivalent to asking in how many periods, such as Late Paleoindian and Early Archaic, were artifacts deposited at a site)? Is a component the product of one or more occupations? What is the area of each occupation or component?
These questions and the earlier discussion suggest a number of cautions in assuming that the same site location was chosen for the same reasons throughout Minnesota’s 11,500 year precontact and contact period. For example, a site may at times have been a base camp because of the environmental diversity of the locality, a temporary camp because of a nearby river crossing, and a special-use fishing station because of the presence of rapids in the river. And since the area of a site bears an uncertain relationship to the size of the communities that used it, it seems naive to assign function to a site as a unit primarily on the basis of its size and location, as is most often the case today. The implication of these cautions for this section is that it may be difficult to determine with confidence the importance of individual environmental attributes in site selection. Stated another way, while combinations of environmental attributes may be able to inductively predict the locations of sites with some success, it may be very difficult to demonstrate that a particular variable is always instrumental in site selection at a particular location. As a simple example, even though the site area in the above example is relatively flat, and flatness of location was a reason for the location there of base and temporary camps, flatness of location may have been irrelevant compared to a successful fish harvesting.
Since the numbers of occupations and components in most sites in Minnesota, and their purpose, are unknown, an exploratory approach to determining the importance of individual environmental variables could be adopted. In this approach, a distinction would be made between environmental variables that differentiate between all sites and random points (site present/absent) and those that differentiate between various types of sites. Hammer’s (1993) analysis of variables in site location for prehistoric interior New York State found that excellent to good discriminators between sites and nonsites included measures of distance to water, terrain roughness, remoteness from large drainage systems, absolute and relative elevation, percent of slope, and distance to any big body of water, such as rivers, major lakes, and large wetlands. None of his variables were able to discriminate between all types of sites, although many were able to discriminate between particular types of sites. For example, a measure of climatic temperature (coldness) was an excellent discriminator between Paleoindian and earlier Archaic sites. Orientation toward south was closely associated with Paleoindian and earlier Archaic sites, which were occupied during a very cold period, but was not a good discriminator between other types of sites or the set of random points. Throughout his analysis, Hammer (1993) suggests functional reasons for the importance or lack of importance of particular variables in specific situations.
Tests of variables can be cast in hypothesis form. An example from Young et al.’s (1995) central Michigan predictive modeling project is: The greater the number of streams in an area, the greater the likelihood of site presence. Several examples from Schermer and Tiffany’s (1985) Coralville Reservoir study in Iowa are: Sites are located disproportionately for a southern exposure (vs. For any location, there is no difference between the aspect (exposure) of site locations and random points) and Sites are located disproportionately on soils with good drainage capabilities (vs. There is no difference in soil drainage properties between site locations and random points). Examples from studies in the eastern Prairie Peninsula, which includes parts of southern Minnesota, are: The larger the site, the greater the likelihood it is located in and along major valleys (Brown 1981); Site probability decreases as surface slope becomes progressively steeper and Site probability increases as one moves from flat landforms to more rugged landforms with greater topographic relief (Warren and Asch 1996). Exploratory tests like these should provide information that will help determine reasons for site location. One of the most important reasons for evaluating variables is to distinguish as best as possible between proxy variables and the systemic decision variables for which they are stand-ins (Kohler and Parker 1986). For example, depending on region and adaptive type, elevation may be a proxy for length of growing season, amount of summer rainfall, vegetation distribution, or faunal resource community, among other choices. Predictive power of models can be increased by concentrating on systemic decision rather than proxy variables.
7.7 MODELING FROM THE STATEWIDE DATABASE
The statewide map of the Phase 3 site probability models (Figure 8.5) is a simple composite of the regional models. No adjustment of raw model scores was made to elicit true relative probabilities between regions because of the problems noted in Section 7.4.1. To develop a model with comparable values statewide, a simpler approach was taken. At the end of Phase 3, all regional databases were concatenated and a statewide model was built on the entire database using the Phase 3 methods described above. Only one model was constructed (Figure 8.8). Because of time constraints, there was no time to model halves of the dataset and evaluate stability.
This model is not completely comparable to the one envisioned from adjusting regional model scores, as it is based on a subset of the environmental variables. Some variables, such as distance to bedrock used for tools and distance to paper birch were not calculated at a statewide level. Consequently, portions of the database from regions that did not have these features contained null values for them. Since it would have been too time-consuming to calculate these variables statewide at that point in the project, such variables were dropped from the database. Moreover, the model generalizes environmental differences between regions, and high probability values are heavily weighted towards parts of the state that have had the most survey activity. An evaluation of this model is presented in Section 8.6.3.4.
Throughout this project some models have performed very well and others have not. In each project phase, attempts have been made to refine modeling methods to improve model performance. These are summarized briefly below.
In Phase 2, the most important refinement was that all counties were modeled. This provided complete geographic coverage of data within each region, so that patterns could be better discerned. This also provided greater site numbers within the regions for model development.
Enhancing the models with additional variables was tested in Phases 1 and 2. The Phase 1 and basic Phase 2 models were based only on environmental data that were available at that time for the entire state. In Phase 1, variables derived from Trygg maps (Section 6.2.5.3) were applied in Phase 1 to models of one county and one region. In both cases, one or more Trygg variables improved the performance of the models. In Phase 2, Trygg-enhanced models were attempted for ten subregions. In some cases, models with Trygg variables performed better than basic models. In other regions, S-Plus selected no Trygg variables for inclusion in a model. However, this may not be the best test of the value of these variables, as only a few counties in each region contributed to the model. Modeling with Trygg variables was discontinued in Phase 3 because it was determined that models from partial geographic coverage were inadequate and that there would not be time to digitize the entire state.
In Phase 2, high-resolution digital soil surveys were available for 28 counties. These data contributed to enhanced models for eight subregions. Soil variables figured into models for only three of these regions. They showed some potential to improve model performance, but the results were inconclusive because of the poor geographic coverage of the available data. Since full state coverage of digital soils surveys will not be available for several years, the use of these data was not pursued in Phase 3.
In Phase 3 of the project substantial model refinements were introduced for both improving and evaluating model performance. These included:
- Adopting a new regionalization scheme to reduce the amount of environmental variability within the region modeled (Section 4.6.3)
- Adding a 10 km buffer around each region helped to reduce the boundary effects (Section 4.7.2.1)
- Adding variables derived from two new data layers, bearing tree distributions (Section 6.2.5.5) and major and minor watersheds (Section 6.2.2.2)
- Removing some Phase 2 variables and consolidating others (Section 4.7.2)
- Developing survey probability and survey implementation models (Section 7.5.1.3)
- Developing a data confidence model (Section 4.5.3)
- Measuring model stability using the Kappa coefficient of agreement (Section 7.5.1.3.2)
However, not all of the Phase 3 models predict as many sites, provide sufficient gain, or are as stable as desired. Some of the poor results are grounded in the database and cannot be improved by refining modeling techniques. The only remedies for these are more and better archaeological data from less biased surveys. Another alternative would be to take a completely different, non-statistical approach to modeling. These options and others are discussed extensively in Chapter 10.
This project has adopted an inductive empirical approach to predictive modeling, using logistic regression to find relationships between known sites and their environment. It has been most successful in regions where there are large number of known sites, where environmental variation is relatively small, and where high resolution environmental data are available. Lessons learned in each phase of the project were applied to improve methods and models in subsequent phases.
The modeling steps and evolution of the modeling methods are described above. The model results are presented in Chapter 8. However, neither the methods nor the results are final. Mn/Model will continue to evolve, new data will be incorporated, new methods will be tried, and new results will be developed. Chapters 10 and 11 provide some indications of what kinds of enhancements are under consideration and how such enhancements will be incorporated into MnDOT's implementation plan.
Anderson, P. F.
1995 GIS Modeling of Archaeological Sites in the Raccoon River
Greenbelt. Report prepared
for the Dallas County Conservation Board,
Iowa.
Binford, L.R.
1982 The Archaeology of Place. Journal of Anthropological Archaeology 1:1-31.
Bonham-Carter, G.F.
1994 Geographic Information Systems for Geoscientists: Modelling
with GIS. Pergamon
(Elsevier Science Ltd.), Tarrytown, NY.
Brandt, R. W., B.J. Groenewoudt,
and K. Kvamme
1992 An Experiment in Archaeological Site Location: Modelling in
the Netherlands Using GIS
Techniques. World Archaeology 24(2):268-282.
Brown, M.K. (editor)
1981 Predictive Models in Illinois Archaeology: Report Summaries. Division of Historic Sites,
Illinois department of Conservation, Springfield.
Dewar, R.E.
1986 Discovering Settlement Systems of the Past in New England. Man in the Northeast 31:77-
88.
Dewar, R.E., and K.A. McBride
1992 Remnant Settlement Patterns. In Space, Time, and Archaeological
Landscapes, edited by
J. Rossignol and L. Wandsnider, pp. 227-255.
Plenum Press, New York.
Dunnell, R.C.
1992 The Notion of Site. In Space, Time, and Archaeological
Landscapes, edited by J.
Rossignol and L. Wandsnider, pp. 21-41.
Plenum Press, New York.
Dunnell, R.C., and W.S. Dancey
1983 The Siteless Survey: A Regional Scale Data Collection Strategy. Advances in
Archaeological Method and Theory 6:267-287.
Ebert, J.I.
1992 Distributional Archaeology. University of New Mexico
Press, Albuquerque.
Foley, R.
1981a A Model of Regional Archaeological Structure. Proceedings
of the Prehistoric Society
47:1-17.
1981b Off-Site Archaeology: An Alternative Approach for the Short-Sited.
In Patterns of the
Past: Studies in Honor of David Clarke,
edited by Ian Hodder, G. Isaac, and N. Hammond,
pp. 157-183. Cambridge University Press,
Cambridge.
1981c Off-Site Archaeology and Human Adaptation in Eastern Africa:
Analysis of Regional
Artifact Density in the Amboseli, Southern
Kenya. Cambridge Monographs in African
Archaeology 3. BAR International Series
97. B.A.R., Oxford.
Gaffney, V.L., and M. Tingle
1984 The Tyranny of the Site: Method and Theory in Field Survey. Scottish Archaeological
Review 3:134-140.
Hammer, J.
1993 A New Predictive Site Location Model For Interior New York
State. Man in the Northeast
45:39-76.
Kohler, T.A., and S.C. Parker
1986 Predictive Models for Archaeological Resource Location. Advances
in Archaeological
Method and Theory 9:397-452.
Kvamme, K.L.
1985 Determining Empirical Relationships Between the Natural Environment
and Prehistoric Site
Locations: A Hunter-Gatherer Example. In For Concordance in Archaeological Analysis:
Bridging Data Structure, Quantitative Technique,
and Theory, edited by C. Carr, pp. 208-
238. Westport Press, Kansas City.
1988 Development and Testing of Quantitative Models. In Quantifying
the Present and
Predicting the Past: Theory, Method, and
Applications of Archaeological Predictive
Modeling, edited by W.J. Judge and
L. Sebastian, pp. 325-428. U.S. Department of the
Interior, Bureau of Land Management, Denver,
Colorado.
1992 A Predictive Site Location Model On The High Plains: an Example
with an Independent Test.
Plains Anthropologist 37(138):19-38.
1994 Ranter’s Corner: GIS graphics vs. spatial statistics: how
do they fit together? Archaeological
Computing Newsletter 38:1-2.
Leusen, P.M. van
1996 GIS and Locational Modeling in Dutch Archaeology: A Review
of Current Approaches. In
New Methods, Old Problems: Geographic
Information Systems in Modern Archaeological
Research, edited by H. Maschner, pp.
177-197. Occasional Paper No. 23, Center for
Archaeological Investigations, Southern
Illinois University, Carbondale.
Neumann, T.W.
1992 The Physiographic Variables Associated with Prehistoric Site
Location in the Upper
Poptomac River Basin, West Virginia. Archaeology
of Eastern North America 20:81-124.
Roper, D.C.
1979 Archaeological Survey and Settlement Pattern Models in
Central Illinois. Scientific
Papers, Vol. XVI, Illinois State Museum,
Springfield; Special Papers, No. 2, Midcontinental
Journal of Archaeology, Kent, Ohio.
Schermer, S.J., and J.A. Tiffany
1985 Environmental Variables as Factors in Site Location: An Example
from the Upper Midwest.
Midcontinental Journal of Archaeology 10(2):215-240.
Siegal, S.
1956 Nonparametric Statisticas for the Behavioral Sciences. McGraw-Hill
Book Company, New
York. Tomlin, C.D.
1990 Geographic Information Systems and Cartographic Modeling. Prentice-Hall, New York.
Van Buren, T.M.
1990 Where Do We Draw the Line? Some Thoughts on the Use of the
‘Site’ Concept.
Proceedings of the Society for California
Archaeology 4:213-219.
Warren, R. E.
1990 Predictive Modeling In Archaeology: A Primer. In Interpreting
Space: GIS and
Archaeology, edited by K.M.S. Allen,
S.W. Green, and E.B.W. Zubrow, pp 90-111. Taylor
and Francis, London. Warren, R.E., and
D.L. Asch.
1996 A Predictive Model of Archaeological Site Location in the
Eastern Prairie Peninsula, Illinois.
Unpublished manuscript, Illinois State
Museum, Springfield.
Wobst, M.H.
1983 We Can’t See the Forest for the Trees: Sampling and the Shapes
of Archaeological
Distributions. In Archaeological Hammers
and Theories, edited by James Moore and Arthur
Keene, pp. 37-85. Academic Press, New York.
Young, P. M., M. R. Horne, C. D.Varley,
P. J. Racher, and A. J. Clish.
1995 A Biophysical Model For Prehistoric Archaeological Sites
In Southern Ontario. Research
and Development Branch Ministry of Transportation,
Ontario.
The Mn/Model Final Report (Phases 1-3) is available on CD-ROM. Copies may be requested by visiting the contact page.

Acknowledgements
MnModel was financed with Transportation Enhancement and State Planning and Research funds from the Federal Highway Administration and a Minnesota Department of Transportation match.
Copyright Notice
The MnModel process and the predictive models it produced are copyrighted by the Minnesota Department of Transportation (MnDOT), 2000. They may not be used without MnDOT's consent.