Quick Links
Chapters
- Management Summary
- Research Design & Time Line
- Environment & Native American Culture
- GIS Design
- Archaeological Database
- Archaeological & Environmental Variables
- Model Development & Evaluation
- Model Results & Interpretation
- Project Applications
- Model Enhancements
- Model Implementation
- Landscape Suitability Models
- Summary & Recommendations
Appendices
- Archaeological Predictive Modeling: An Overview
- GIS Standards & Procedures
- Archaeology Field Survey Standards, Procedures & Rationale
- Archaeology Field Survey Results
- Geomorphology Survey Profiles, Sections, & Lists
- Building a Macrophysical Climate Model for the State of Minnesota
- Correspondence of Support for Mn/Model
- Glossary
- List of Figures
- List of Tables
- Acknowledgments
8.19 MILLE LACS UPLANDS SUBSECTION OF WESTERN SUPERIOR UPLANDS SECTION
8.19.1 Environmental Context
8.19.2 Site Probability Model
8.19.3 Survey
Probability Model
8.19.4 Survey Implementation Model
8.19.5 Other Models
This regional model report is organized as described in Sections 8.2.1 through 8.4.1. Refer to these sections of the report for explanations of the tables, variables, and statistics.
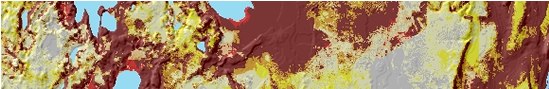
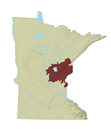
Mille Lacs Uplands is a subsection of the Western Superior Uplands Section of the Laurentian Mixed Forest Province (Figure 8.1) (Minnesota DNR 1998). Gently rolling till plains and drumlin fields are the dominant landforms. The most significant hydrologic feature is Lake Mille Lacs (Figure 8.19.1.a), the third largest lake in the state.
The St. Louis River, in Carlton and St. Louis Counties, defines the northeast border of the subsection. The interface between the Toimi drumlin area (to the north) and the Automba drumlin area (to the south) defines the northeastern section of the northern border. The western portion of the northern border is defined by the Aitkin lacustrine plain (on the north) and the Swatara plain (on the south) (Minnesota DNR 1998). The St. Croix River forms the eastern boundary, while the western boundary is defined by the interface between the western edge of the Rainy Lobe moraine and the eastern limits of the Des Moines Lobe end moraine. The interface between the southern edge of the Superior Lobe sediments and the Des Moines Lobe moraines or the Anoka Sandplain forms the southern border.
The Mille Lacs Uplands is a landscape with flat to gently rolling topography (Figure 8.19.1.a). Elevation rises steadily from the St. Croix Valley on the southeastern border to the northern boundary of the subsection. There are several noteworthy geomorphic features within this subsection. The Pierz drumlin field is located to the south and southwest of Mille Lacs Lake. The Automba drumlin field lies to the east of Mille Lacs Lake. Esker formations lying to the east and southeast of Mille Lacs Lake are oriented from northeast to southwest.
The end and ground moraines of the Superior Lobe define the subsection, though materials from three glacial sources are evident (Figure 8.19.2.a). Rainy Lobe moraines are west of Mille Lacs Lake and Des Moines Lobe moraines are in the southeast portion of the subsection. Moraines dominate the landforms in nearly the entire subsection. The formation of Mille Lacs Lake is evidence of the moraines’ influence on landforms. The Superior Lobe end moraine was covered with clay till from the St. Louis sublobe. This formed a dam to glacial meltwater and resulted in the formation of the lake. Outwash material is interspersed throughout the dense glacial till (Figure 8.19.2a, Minnesota DNR 1998). The Kettle River and the Snake River follow ancient outwash channels. These rivers flow south and east to the St. Croix River. The Rum River is another example of a stream that follows outwash substrates. It flows south from Mille Lacs Lake to the Mississippi River.
Historic vegetation within the Superior Lobe (Figure 8.19.1.b) was a transition from Big Woods, in the south, to mixed hardwood/conifer communities that dominated the majority of the subsection. A wide swath of brush prairie south of Mille Lacs Lake and scattered areas of brush prairie throughout the central and northern portions of the subsection added to the vegetation mosaic. Oka openings and barrens and prairies occurred on the margins of the Big Woods and as inclusions in the mixed forest. Conifer bog was the tree community typically found on extensive areas of poorly drained soils (Figure 8.19.2.b).
8.19.2.1 Description
The areas of medium and high site potential in the site probability model for the Mille Lacs Uplands (Figure 8.19.3) correspond to a combination of water features and topography.
Areas of high and medium site potential are concentrated around Mille Lacs Lake and the clusters of lakes north and west of Mille Lacs, to the chain of lakes extending from southeastern Mille Lacs County in a northeasterly direction to southern Carlton County, and in the network of lakes and streams in the southeastern portion of the subsection. Site potential patterns around the lakes appear to be controlled by topography. Lakeshores with adjacent wetlands tend to be classified as areas of low potential, while high and medium site potential occur more often on the higher land.
Areas of high and medium site potential follow elevated bluff lines in narrow configurations along streams. Where wider valleys are present, the too are occupied by high and medium site potential zones. High site potential also lines the margins of some abandoned stream channels within the subsection.
The St. Croix River, at its most northern point along the southern border of Pine County, exhibits no medium or high site potential until its confluence with the Kettle River. Zones of high and medium site potential broaden around the St. Croix River as it flows south from the Kettle River outlet. The band of high and medium site potential along the St. Croix becomes very narrow in central Chisago County and is interrupted completely by sections of low site potential. Areas of high site potential widen to the limits of the river valley as the St. Croix River reaches the southern boundary of Chisago County.
In addition to many water features exhibiting high and medium site potential, there is a narrow ridge of high site potential that starts near the mouth of the Snake River in Pine County. This line continues south to central Chisago County and the southern border of the subsection. It follows a bluff feature that is visible in the variable height above surroundings (Figure 8.19.4.a).
Most areas of high and medium site potential are on end moraine and outwash deposits (Figure 8.19.2.a). Extensive areas of low site potential in this model occur primarily on stagnation moraine, where wetlands predominate.
8.19.2.2 Evaluation
The site probability model for the Mille Lacs Uplands subsection performed extremely well. It is based on 19 variables (Table 8.19.1) representing topography, vegetation, hydrology and soils.
Table 8.19.1. Site Probability Model, Mille Lacs Uplands Subsection.
Intercept |
12.598 |
|
ln(nonsites/sites) |
1.968855088 |
|
Variable |
Regression coefficient |
Probability |
Direction to nearest water or wetland |
-0.3345878 |
91.5 |
Distance to aspen-birch |
-0.009238206 |
100.0 |
Distance to edge of nearest large lake |
-0.02714142 |
100.0 |
Distance to edge of nearest perennial river or stream |
-0.02672654 |
100.0 |
Distance to edge of nearest swamp |
0.05490464 |
100.0 |
Distance to hardwoods |
-0.010499496 |
92.4 |
Distance to mixed hardwoods and pines |
-0.01571726 |
100.0 |
Distance to nearest confluence between perennial or intermittent streams and large rivers |
-0.01150199 |
100.0 |
Distance to nearest lake, wetland, organic soil, or stream |
-0.06022191 |
100.0 |
Distance to nearest minor ridge or divide |
-0.02506964 |
100.0 |
Distance to nearest permanent lake inlet/outlet |
-0.01672269 |
99.1 |
Distance to prairie |
-0.004977397 |
95.8 |
Distance to well-drained soils |
0.0325125 |
100.0 |
Elevation |
-0.008221587 |
92.8 |
Height above surroundings |
0.09024267 |
100.0 |
Size of nearest lake |
0.0001081234 |
100.0 |
Slope |
0.1646023 |
72.8 |
Vegetation diversity within 1 km |
0.3200204 |
100.0 |
Vertical distance to permanent water |
-0.03259693 |
100.0 |
In this model, 86.72 percent of all known sites are in high/medium site potential areas, which make up only 14.37 percent of landscape (Table 8.19.2). This produces a very strong gain statistic of 0.83429 (Table 8.6.11). The model tested somewhat less well. Only 76.19 percent of sites were predicted, producing a test gain statistic of 0.81139.
Table 8.19.2. Evaluation of the Site Probability Model, Mille Lacs Uplands Subsection.
Region (30 meter cells) |
Random Points |
Negative Survey Points |
Modeled Sites |
Test Sites |
||||||
# |
% |
# |
% |
# |
% |
# |
% |
# |
% |
|
Low |
14200408 |
81.46 |
2513 |
80.29 |
612 |
57.63 |
50 |
11.44 |
15 |
23.81 |
Medium |
835286 |
4.79 |
145 |
4.63 |
78 |
7.34 |
39 |
8.92 |
7 |
11.11 |
High |
1670555 |
9.58 |
323 |
10.32 |
371 |
34.93 |
340 |
77.80 |
41 |
65.08 |
Water |
724075 |
4.15 |
149 |
4.76 |
0 |
0 |
3 |
0.69 |
0 |
0 |
Steep Slopes |
1994 |
0.01 |
0 |
0 |
1 |
0.09 |
5 |
1.14 |
0 |
0 |
Mines |
0 |
0 |
0 |
0 |
0 |
0 |
0 |
0 |
0 |
0 |
Total |
17432318 |
100 |
3130 |
100 |
1062 |
100 |
437 |
100 |
63 |
100 |
The database included 437 sites that were not single artifacts. This is well above the average number of sites for the Phase 3 regions (Table 8.6.11). Two preliminary models using different halves of the known sites had 89 percent agreement. The Kappa statistic, which is adjusted for the amount of agreement expected by chance alone, was 0.57116 (Table 8.6.11) indicating that this model is slightly more stable than average. The conditional Kappa statistics (Table 8.19.3) are lowest for the medium and high site potential zones, indicating that most of the model's instability is in distinguishing between these two zones. Increasing the number of sites for modeling may improve confidence in the model performance and stability.
Table 8.19.3. Conditional Kappa Values for Site Probability Model, Mille Lacs Uplands.
Class |
Ki |
Proportion Correct |
Low |
0.6729 |
0.9509 |
Medium |
0.1670 |
0.2086 |
High |
0.6405 |
0.6764 |
8.19.2.3 Interpretation
There are 19 variables used in the site probability model for the Mille Lacs Uplands subsection. Nine of these variables are related to surface hydrology, five to vegetation, four to topography, and one to soils (Table 8.19.1).
8.19.2.3.1 Differences between Modeled Sites and Random Points for Individual Model Variables
Only two model variables have correlations coefficient values greater than 0.3 (Table 8.19.4). These are distance to nearest large lake (Figure 8.19.10c) and distance to nearest permanent lake inlet/outlet (Figure 8.19.12b). Modeled sites are, on the average, 4200 meters closer to large lakes and 2500 meters closer to lake inlet/outlets than are random points. Variables with coefficients between 0.2 and 0.3 indicate that sites have average slope 1.47 degrees greater than random points (Figures 8.19.4.b and 8.19.9d), they are 2570 meters closer to confluences of perennial or intermittent streams and large rivers (Figure 8.19.11b), 49 meters nearer lakes, wetlands, organic soils, or streams (Figure 8.19.12a), and 983 meters closer to mixed hardwood and pines (Figure 8.19.14a). Lakes near sites are 1376 acres larger in size as compared to those near random points (Figure 8.19.12c). This variable, however, could be highly skewed by the size of Mille Lacs Lake.
Compared to random points, sites are also closer to minor ridges and divides (Figure 8.19.9a), perennial rivers and streams (Figure 8.19.10d), hardwoods (Figure 8.19.13d), prairie (Figure 8.19.14d), and are generally in areas of greater vegetation diversity (Figures 8.19.15a and 8.19.5b). Since prairie is found only in the extreme western and southern portions of the subsection, distance to prairie may simply reflect the preponderance of sites in the west (primarily around Mille Lacs Lake) and south, rather than the importance of the prairie resource itself. Sites tend to be farther from swamps than would be expected by chance (Figure 8.19.11a). Sites are at about the same average elevation as random points (Figure 8.19.9b), but are higher above their surroundings (Figures 8.19.4.a and 8.19.9c) . They are closer in the vertical dimension to permanent water (Figure 8.19.6 and Figure 8.19.13a) and are located in a less southerly direction with respect to water bodies (Figure 8.19.10b).
An examination of the results of the Mann-Whitney U test (Table 8.19.4) indicates that the differences between modeled sites and random points are statistically significant at the 0.05 level for all but two variables, distance to aspen-birch (Figure 8.19.13b) and distance to well-drained soils (Figure 8.19.15b). This means that the model for this subsection is successful at isolating a series of variables that discriminate between sites and random points to the extent that they can be considered to be drawn from different populations.
Table 8.19.4. Model Variable Statistics.
Mille Lacs Uplands |
Modeled Sites |
Surveyed Areas |
Modeled Sites |
Sites in Low Prob. |
Neg. Survey Points |
Random Points |
||||||
Model Variable |
Coeff. |
Sign. |
Coeff. |
Sign. |
Mean |
S.D. |
Mean |
S.D. |
Mean |
S.D. |
Mean |
S.D. |
Distance to nearest minor ridge or divide |
-0.087 |
0 |
-0.139 |
0 |
21.67 |
11.83 |
25.11 |
11.46 |
22.47 |
11.47 |
25.24 |
14.04 |
Elevation |
-0.124 |
0 |
- |
- |
1056.5 |
163.11 |
1137.44 |
158.43 |
1064.8 |
159.53 |
1161 |
135.09 |
Height above surroundings |
0.14 |
0 |
0.246 |
0 |
10.11 |
12.49 |
6.36 |
6.19 |
8 |
11.73 |
4.69 |
6.49 |
Slope |
0.228 |
0 |
0.305 |
0 |
2.51 |
3.15 |
1.42 |
1.33 |
1.67 |
2.34 |
1.04 |
1.44 |
Surface roughness |
- |
- |
-0.302 |
0 |
173.21 |
25.51 |
180.46 |
25.19 |
170.7 |
25.55 |
182.3 |
21.48 |
Direction nearest water or wetland (sine) |
-0.011 |
0 |
-0.076 |
0 |
0.23 |
0.73 |
0.22 |
0.75 |
0.19 |
0.73 |
0.39 |
0.72 |
Distance to edge of nearest large lake |
-0.333 |
0 |
-0.06 |
0 |
44.87 |
43.8 |
64.98 |
47.65 |
77.74 |
44.64 |
79.09 |
40.3 |
Distance to edge of nearest perennial river or stream |
-0.187 |
0 |
-0.407 |
0 |
26.89 |
17.24 |
29.52 |
15.67 |
28.41 |
16.09 |
36.54 |
17.46 |
Distance to edge of nearest swamp |
0.125 |
0 |
0.106 |
0 |
12.77 |
8.48 |
10.9 |
7.85 |
12.65 |
8.55 |
11.87 |
12.28 |
Distance to nearest confluence between perennial or intermittent streams and large rivers |
-0.243 |
0 |
-0.396 |
0 |
69.57 |
33.58 |
81.49 |
35.05 |
72.08 |
33.31 |
86.08 |
30.51 |
Distance to nearest intermittent stream |
- |
- |
0.118 |
0 |
41.4 |
17.56 |
41.38 |
20.63 |
39.8 |
22.26 |
37.24 |
19.1 |
Distance to nearest lake inlet/outlet |
- |
- |
-0.272 |
0 |
38.63 |
18.36 |
46.57 |
19.23 |
47.33 |
18.5 |
55.77 |
21.96 |
Distance to nearest lake, wetland, organic soil, or stream |
-0.264 |
0 |
-0.181 |
0 |
5.91 |
5.9 |
7.79 |
5.77 |
7.49 |
5.74 |
9.18 |
11.35 |
Distance to nearest permanent lake inlet/outlet |
-0.368 |
0 |
- |
- |
44.78 |
20.93 |
54.13 |
19.76 |
56.74 |
23.04 |
66.9 |
25.84 |
Size of nearest lake |
0.222 |
0 |
- |
- |
2762.44 |
6164.3 |
417.58 |
598.17 |
851.69 |
3584.92 |
1386 |
4892.9 |
Size of nearest permanent lake |
- |
- |
0.125 |
0 |
2763.36 |
6164.09 |
417.6 |
598.25 |
896.31 |
3708.81 |
1390 |
4893.4 |
Vertical distance to permanent water |
0.016 |
0 |
-0.073 |
0.059 |
10.78 |
16.93 |
12.62 |
15.62 |
16.93 |
27.86 |
16.21 |
23.88 |
Distance to aspen-birch |
-0.15 |
0.422 |
- |
- |
57.14 |
59.48 |
58.51 |
49.05 |
59.63 |
63.82 |
51.8 |
50.2 |
Distance to brushlands |
- |
- |
-0.241 |
0 |
75.1 |
48.96 |
81.71 |
51.04 |
84.97 |
52.08 |
104.1 |
66.59 |
Distance to hardwoods |
0.01 |
0 |
-0.313 |
0 |
26.76 |
25.95 |
33.88 |
28.23 |
30.69 |
31.03 |
46.87 |
33.52 |
Distance to mixed hardwoods and pine |
-0.225 |
0 |
-0.105 |
0.003 |
63.5 |
45.86 |
72.77 |
42.11 |
68.86 |
41.99 |
70.83 |
41.79 |
Distance to oak woodland |
- |
- |
-0.183 |
0 |
86.06 |
50.07 |
102.38 |
58.5 |
117.33 |
69.14 |
123 |
69.01 |
Distance to pine barrens or flats |
- |
- |
0.227 |
0 |
171.46 |
67.95 |
140.9 |
69.78 |
158.01 |
74.88 |
149.8 |
67.9 |
Distance to prairie |
0.095 |
0 |
- |
- |
182.79 |
63.56 |
188.04 |
62.17 |
203.88 |
81.73 |
206.2 |
78.03 |
Vegetation diversity within 1 km |
0.151 |
0 |
- |
- |
3.16 |
1.06 |
2.96 |
1.09 |
2.71 |
0.96 |
2.62 |
0.9 |
Distance to well-drained soils |
-0.003 |
0.146 |
- |
- |
5.35 |
9.46 |
4.23 |
8.18 |
3.93 |
7.87 |
7.29 |
13.86 |
On river terraces |
- |
- |
0.239 |
0 |
0.09 |
0.29 |
0.02 |
0.14 |
0.07 |
0.25 |
0.03 |
0.16 |
Frequency counts |
437 |
1543 |
437 |
50 |
1062 |
3130 |
||||||
See Interpretation section for discussion of the statistics:
Coeff. = correlation coefficient
Sign. = significance of the Mann-Whitney U test
S.D. = standard deviation
Distances and areas are expressed in square roots of meters. Square the values in the table to get actual values.
8.19.2.3.2 Relationships between Variable Pairs
An examination of the correlation matrix in Table 8.19.5 indicates that there are six variable pairs with correlation coefficients greater than 0.5.
Distance to hardwoods is positively correlated with elevation and negatively correlated with distance to nearest large lake. This indicates that hardwoods in this subsection tend to be a lower elevations, near large lakes. Distance to mixed hardwoods and pines is inversely related to distance to prairie, indicating that these two vegetation communities are not likely to be found together. Height above surroundings is highly correlated with vertical distance to permanent water and slope, as might be expected. Distance to nearest large lake is negatively correlated with size of nearest lake, indicating that the size of the nearest lake increases as the distance to a large lake decreases, a rather obvious relationship.
Table 8.19.5. Variable Correlation Matrix.
Mille Lacs Uplands |
Distance to nearest minor ridge or divide |
Elevation |
Height above surroundings |
Slope |
Direction to nearest water or wetland (sine) |
Distance to edge of nearest large lake |
Distance to edge of nearest perennial river or stream |
Distance to edge of nearest swamp |
Distance to nearest confluence between perennial or intermittent streams and large rivers |
Distance to nearest lake, wetland, organic soil, or stream |
Distance to nearest minor ridge or divide |
1 |
|||||||||
Elevation |
0.08 |
1 |
||||||||
Height above surroundings |
-0.09 |
-0.08 |
1 |
|||||||
Slope |
0 |
-0.13 |
0.64 |
1 |
||||||
Direction to nearest water or wetland (sine) |
0.08 |
0.14 |
-0.32 |
-0.23 |
1 |
|||||
Distance to edge of nearest large lake |
-0.3 |
-0.49 |
0.22 |
0.1 |
-0.26 |
1 |
||||
Distance to edge of nearest perennial river or stream |
0.27 |
0.14 |
-0.08 |
-0.11 |
-0.08 |
-0.29 |
1 |
|||
Distance to edge of nearest swamp |
0.01 |
-0.24 |
0.03 |
0.06 |
-0.19 |
0.09 |
0.24 |
1 |
||
Distance to nearest confluence between perennial or intermittent streams and large rivers |
0.18 |
0.42 |
0.01 |
-0.03 |
-0.04 |
-0.33 |
0.43 |
0.03 |
1 |
|
Distance to nearest lake, wetland, organic soil, or stream |
-0.14 |
-0.1 |
0.22 |
0.01 |
-0.29 |
0.44 |
0.1 |
0.31 |
0.01 |
1 |
Distance to nearest permanent lake inlet/outlet |
-0.08 |
-0.3 |
0.05 |
-0.01 |
-0.14 |
0.42 |
0.39 |
0.26 |
0.02 |
0.2 |
Size of nearest lake |
0.23 |
0.46 |
-0.17 |
-0.14 |
0.22 |
-0.8 |
0.34 |
-0.06 |
0.4 |
-0.26 |
Vertical distance to permanent water |
-0.1 |
0.01 |
0.74 |
0.47 |
-0.25 |
0.22 |
-0.15 |
0.03 |
-0.04 |
0.28 |
Distance to aspen-birch |
0.03 |
-0.35 |
0.29 |
0.18 |
-0.09 |
0.12 |
-0.02 |
0.09 |
0.03 |
0.11 |
Distance to hardwoods |
0.08 |
0.58 |
-0.3 |
-0.21 |
0.28 |
-0.51 |
-0.04 |
-0.14 |
0.15 |
-0.3 |
Distance to mixed hardwoods and pine |
-0.05 |
-0.45 |
0.35 |
0.35 |
-0.17 |
0.26 |
-0.15 |
0.01 |
0 |
0.12 |
Distance to prairie |
0.03 |
0.29 |
-0.27 |
-0.2 |
0.19 |
-0.25 |
0.22 |
0.07 |
-0.14 |
-0.05 |
Vegetation diversity within 1 km |
0.05 |
0.38 |
-0.17 |
-0.15 |
0.03 |
-0.31 |
0.22 |
-0.04 |
0.38 |
-0.03 |
Distance to well-drained soils |
-0.08 |
-0.04 |
-0.08 |
-0.13 |
0.09 |
0.16 |
-0.13 |
-0.16 |
0.03 |
0.21 |
Mille Lacs Uplands |
Distance to nearest permanent lake inlet/outlet |
Size of nearest lake |
Vertical distance to permanent water |
Distance to aspen-birch |
Distance to hardwoods |
Distance to mixed hardwoods and pine |
Distance to prairie |
Vegetation diversity within 1 km |
Distance to well-drained soils |
|
Distance to nearest permanent lake inlet/outlet |
1 |
|||||||||
Size of nearest lake |
-0.27 |
1 |
||||||||
Vertical distance to permanent water |
0.02 |
-0.12 |
1 |
|||||||
Distance to aspen-birch |
0.09 |
-0.04 |
0.24 |
1 |
||||||
Distance to hardwoods |
-0.35 |
0.32 |
-0.22 |
-0.3 |
1 |
|||||
Distance to mixed hardwoods and pine |
0.09 |
-0.25 |
0.27 |
0.44 |
-0.49 |
1 |
||||
Distance to prairie |
-0.02 |
0.29 |
-0.22 |
-0.31 |
0.29 |
-0.58 |
1 |
|||
Vegetation diversity within 1 km |
-0.2 |
0.21 |
-0.15 |
-0.39 |
0.28 |
-0.32 |
0.15 |
1 |
||
Distance to well-drained soils |
0 |
-0.13 |
-0.02 |
-0.06 |
-0.08 |
0.06 |
-0.05 |
0.02 |
1 |
|
Refer to "Relationships between variable pairs" for interpretation of the table values.
8.19.2.3.3 Sites in Low Probability Areas
As sites in low probability areas are not predicted by this model, it is informative to examine their characteristics and the characteristics of the environments in which they are found (Table 8.19.4). Sites in low site potential areas are most distinctive on six variables. Compared to both all modeled sites and random points, they are closer to perennial rivers and streams, swamps, pine barrens and flats, and well-drained soils. They also are near to smaller lakes and farther from mixed hardwoods and pines. These sites are more similar to random points on seven variables, and more similar to sites on only three variables.
Of the 50 sites that are not predicted by the model, one is a quarry, one is a wild rice site, two are mortuaries, 12 are mounds or earthworks, 13 are artifact scatters, and 21 are lithic scatters. If all sites types were equally well predicted by the model, 11.4 percent of each site type would be found in low probability areas. This is not the case. Two site types, wild rice sites and artifact scatters, are under-represented in the low probability areas. This indicates that the model does a relatively good job predicting such sites. Twenty percent of all mortuary/cemetery sites, 24 percent of all mounds/earthworks, and 20.4 percent of all lithic scatters are in low probability areas, implying that these site types are not as well predicted by the model. The model's worst performance is in predicting quarry sites, with 50 percent of sites in the low probability area. However, this may not be significant, as there are only two known quarry sites in the subsection.
8.19.2.3.3 Relationships between Cultural Context, Descriptive, or Settlement Variables and Site Potential
There is a sufficient number of sites in the Mille Lacs Uplands to assess the relationship between predictive categories and five dichotomous site types: Paleoindian/not-Paleoindian, Archaic/not-Archaic, Aceramic/not-Aceramic, single component/not-single component, and mounds/not mounds (Table 8.19.6). Only one of these, Aceramic vs. not-aceramic, is significant at the 0.05 level as measured by the chi-square test. The relative frequencies of Paleoindian, Archaic and aceramic sites tend to be higher in the low site potential areas compared to all modeled sites (15.7 percent to 23.5 percent vs. 11.7 percent). The low numbers of Paleoindian and Archaic sites make any conclusions drawn from these statistics very tentative. However, it is clear that sites lacking pottery (e.g. lithic scatters) are not predicted as well as those containing pottery.
Table 8.19.6. Summary of Bivariate Relationships between Five Dichotomous Archaeological Variables and Three Areas of Site Potential, Mille Lacs Uplands (Site Probability Model).
Low Potential |
Medium Potential |
High Potential |
Total |
Chi-square Test |
|||||||
Dichotomous Variable |
N |
% |
N |
% |
N |
% |
N |
% |
value |
df |
p-value |
All Sites |
50 |
11.7 |
39 |
9.1 |
340 |
79.2 |
429 |
100.0 |
- |
- |
- |
Paleoindian |
4 |
23.5 |
1 |
5.9 |
12 |
70.6 |
17 |
100.0 |
3.62 |
2 |
0.16 |
Not Paleoindian |
23 |
9.2 |
22 |
8.8 |
204 |
81.9 |
249 |
100.0 |
|||
Archaic |
7 |
20.0 |
2 |
5.7 |
26 |
74.3 |
35 |
100.0 |
4.49 |
2 |
0.11 |
Not Archaic |
20 |
8.7 |
21 |
9.1 |
190 |
82.3 |
231 |
100.0 |
|||
Aceramic |
32 |
15.7 |
18 |
8.8 |
154 |
75.5 |
204 |
100.0 |
6.15 |
2 |
0.046 |
Not Aceramic |
18 |
8.0 |
21 |
9.3 |
186 |
82.7 |
225 |
100.0 |
|||
Single Component |
20 |
9.4 |
20 |
9.4 |
172 |
81.1 |
212 |
100.0 |
1.28 |
2 |
0.53 |
Not Single Component |
7 |
13.0 |
3 |
5.6 |
44 |
81.5 |
54 |
100.0 |
|||
Mounds |
1 |
6.3 |
1 |
6.3 |
14 |
87.5 |
16 |
100.0 |
0.71 |
2 |
0.70 |
Not Mounds |
49 |
11.9 |
38 |
9.2 |
326 |
78.9 |
413 |
100.0 |
|||
8.19.3 Survey Probability Model
8.19.3.1 Description
The survey probability model (Figure 8.19.7) for the Mille Lacs Uplands subsection indicates that extensive areas to the northeast, east, and southwest of Mille Lacs Lake have not been surveyed. The areas of high and medium survey potential follow the same water features as in the site model. However, the extent of high and medium survey potential zones is more than twice the extent of the corresponding site potential zones. The models are quite similar because of the significance of water and topography features on the model’s configuration.
High and medium survey potential zones are found around lakes northeast of Mille Lacs Lake, i.e. Clear and Swamp Lakes, and along the northern section of the St. Croix River and its minor tributaries in Pine County, areas where high site potential is scarce. The northeastern part of the subsection exhibits significant differences between the site and the survey probability models. The extensive zone of high and medium survey potential in southern St. Louis and northeastern Carlton counties is not reflected in the site probability model. This zone is attributed to the presence of a linear survey along a major pipeline route in this area. The relative randomness of this linear survey contributed to the inclusion of a broad spectrum of landscapes in the high and medium probability zones. Widely spaced surveys along Minnesota Highway 23 in southeast Benton and southern Mille Lacs counties do not produce the same effect in that area. Factors determining the irregular spacing of these surveys are not known. However, no known sites correspond with their locations, and they apparently did not sample a wide range of environments. Many surveys have been conducted around Mille Lacs and other large lakes and in the St. Louis and St. Croix Rivers valleys, resulting in concentrations of high and medium site potential in these settings.
The Benton County portions of the model includes several straight-line artifacts resulting from joining elevation grids from different sources. These should not be considered predictive features.
8.19.3.2 Evaluation
The survey probability model predicted surveyed places well, suggesting that surveys are not located randomly with the subsection. The model is based on twenty variables (Table 8.19.7), representing topography and hydrology , vegetation, soils, and geomorphology.
Table 8.19.7. Survey Probability Model, Mille Lacs Uplands Subsection.
Intercept |
9.396 |
|
ln(non-surveys/surveys) |
0.707304431 |
|
Variables |
Regression Coefficient |
Probability |
Direction to nearest water or wetland |
-0.261435 |
100.0 |
Distance to brushland |
-0.0112539 |
100.0 |
Distance to edge of nearest large lake |
-0.00755909 |
100.0 |
Distance to edge of nearest perennial river or stream |
-0.0226177 |
100.0 |
Distance to edge of nearest swamp |
0.0394933 |
100.0 |
Distance to hardwoods |
-0.0100163 |
100.0 |
Distance to mixed hardwoods and pines |
-0.00926543 |
100.0 |
Distance to nearest confluence between perennial or intermittent streams and large rivers |
-0.0086011 |
100.0 |
Distance to nearest intermittent stream |
0.0146347 |
100.0 |
Distance to nearest lake inlet/outlet |
-0.00951708 |
100.0 |
Distance to nearest lake, wetland, organic soil, or stream |
-0.0396827 |
100.0 |
Distance to nearest minor ridge or divide |
-0.0152781 |
100.0 |
Distance to oak woodland |
0.00808426 |
100.0 |
Distance to pine barrens or flats |
-0.00515589 |
100.0 |
Height above surroundings |
0.0512879 |
100.0 |
On river terraces |
-0.690761 |
88.0 |
Size of nearest permanent lake |
6.09162e-005 |
100.0 |
Slope |
0.209832 |
100.0 |
Surface roughness |
-0.0375013 |
100.0 |
Vertical distance to permanent water |
-0.00863186 |
100.0 |
The model predicts 84.58 percent of all sites and negative survey points in high/medium survey potential areas, which make up 33.53 percent of the landscape (Table 8.19.8). This produces a good gain statistic of 0.60357 (Table 8.6.14). In Mille Lacs Uplands subsection, surveyed places were predicted with less precision than were sites. This indicates that sites are confined to only a portion of the total area surveyed. However, the models predicted surveyed places significantly better than by chance, indicating that the region has not been randomly surveyed. Survey frequency in this subsection is 0.098 surveys per square km, which is less than average for the subsections modeled. Site frequency of 0.027 known sites per square km is also below average.
Table 8.19.8. Evaluation of Survey Probability Model, Mille Lacs Uplands Subsection.
Region (30 meter cells) |
All random points |
All negative survey points |
All sites |
All sites and negative survey points |
||||||
# |
% |
# |
% |
# |
% |
# |
% |
# |
% |
|
Low |
10860470 |
62.30 |
1889 |
60.35 |
201 |
18.93 |
27 |
5.61 |
228 |
14.78 |
Medium |
2505662 |
14.37 |
462 |
14.76 |
203 |
19.11 |
57 |
11.85 |
260 |
16.85 |
High |
3340117 |
19.16 |
630 |
20.13 |
657 |
61.86 |
388 |
80.67 |
1045 |
67.73 |
Water |
724075 |
4.15 |
149 |
4.76 |
1 |
0.09 |
3 |
0.62 |
3 |
0.19 |
Steep Slopes |
1994 |
0.01 |
0 |
0 |
0 |
0 |
6 |
1.25 |
7 |
0.45 |
Mines |
0 |
0 |
0 |
0 |
0 |
0 |
0 |
0 |
0 |
0 |
Total |
17432318 |
100 |
3130 |
100 |
1062 |
100 |
481 |
100 |
1543 |
100 |
The database included 1543 surveyed places. This is well above the average number of surveys for a Phase 3 region (Table 8.6.14). Two preliminary survey probability models had only 79 percent agreement. However, the Kappa statistic for these models was 0.6243 (Table 8.6.13), which is higher than average for the state. The conditional Kappa statistics (Table 8.19.9) are lowest for the high and medium site potential zones, indicating that most of the model instability is in distinguishing between these two zones. Distributing more surveys throughout the undersurveyed areas should improve the model's stability and reduce the level of bias.
Table 8.19.9. Conditional Kappa Values for Survey Probability Model, Mille Lacs Uplands.
Class |
Ki |
Proportion Correct |
Low |
0.7545 |
0.9018 |
Medium |
0.3872 |
0.5097 |
High |
0.6104 |
0.6883 |
8.19.3.3 Interpretation
The survey probability model is constructed from 20 variables, half of which are hydrologic (Table 8.19.7). The remaining variables are divided between topography and vegetation; river terrace location is the only landform variable. Ten variables have correlation coefficients of 0.2 and greater (Table 8.19.4).
The strongest correlation is with the variable distance to nearest perennial river or stream (Figure 8.19.10d). A comparison of the means of these variables for negative survey points and random points, along with the results of the Mann-Whitney or Wilcoxon test, indicates that surveys have not been conducted in a random fashion across the landscape. On the contrary, surveys occur in areas nearer to perennial rivers and streams (Figure 8.19.10d), confluences between perennial or intermittent streams and large rivers (Figure 8.19.11b), and lake inlet/outlets (Figure 8.19.11d) than do random points. However, they are slightly farther from intermittent streams (Figure 8.19.11c).
Compared to random points, sites are higher above their immediate surroundings (Figures 8.19.4a and 8.19.9c) but on steeper slopes (Figures 8.19.4b and 8.19.9d) and less rugged terrain ((Figures 8.19.10a and 8.19.5.a)) compared to random points. Surveys also tend to be conducted more often on river terraces (Figure 8.19.15c) and in areas of more diverse vegetation (Figure 8.19.15a) compared to random points. Surveys have also been conducted closer to oak woodland (Figure 8.19.14b) and brushlands (Figure 8.19.13c) and farther from pine barrens or flats (Figure 8.19.14c) than would be expected by chance.
The results of the Mann-Whitney U tests indicate that except for one variable, vertical distance to permanent water (Figure 8.19.13a), differences between surveyed places and random points are significant at the 0.05 level (Table 8.19.4). This indicates that surveys and random points, on most of the variables, are not drawn from the same population.
8.19.4 Survey Implementation Model
The survey implementation model for Mille Lacs indicates that 61.71 percent of the landscape is classified as unknown because of inadequate survey (Table 8.19.10 and Figure 8.19.8). These areas a dispersed throughout the subsection and are primarily away from large lakes and major river valleys. Only eight (12.7 percent) of the test sites were from unknown areas.
Water and wetlands occupy only 34 percent of the undersurveyed landscapes. The low and possibly low areas together occupy 19.74 percent of the landscape. More surveys in the unknown areas are needed to improve this model.
Table 8.19.10. Evaluation of Survey Implementation Model, Mille Lacs Uplands Subsection.
Region (30 meter cells) |
Random Points |
Negative Survey Points |
Single Artifacts |
Sites |
||||||
# |
% |
# |
% |
# |
% |
# |
% |
# |
% |
|
Unknown |
10758207 |
61.71 |
1864 |
59.55 |
198 |
18.64 |
2 |
4.55 |
17 |
3.89 |
Possibly Low |
2107773 |
12.09 |
396 |
12.65 |
173 |
16.29 |
7 |
15.91 |
18 |
4.12 |
Low |
1334428 |
7.65 |
253 |
8.08 |
241 |
22.69 |
3 |
6.82 |
15 |
3.43 |
Suspected Medium |
80687 |
0.46 |
21 |
0.67 |
2 |
0.19 |
0 |
0 |
0 |
0 |
Possibly Medium |
241585 |
1.39 |
31 |
0.99 |
16 |
1.51 |
1 |
2.27 |
16 |
3.66 |
Medium |
513014 |
2.94 |
93 |
2.97 |
60 |
5.65 |
4 |
9.09 |
23 |
5.26 |
Suspected High |
21576 |
0.12 |
4 |
0.13 |
1 |
0.09 |
0 |
0 |
8 |
1.83 |
Possibly High |
156304 |
0.9 |
35 |
1.12 |
14 |
1.32 |
0 |
0 |
15 |
3.43 |
High |
1492675 |
8.56 |
284 |
9.07 |
356 |
33.52 |
26 |
59.09 |
317 |
72.54 |
Water |
724075 |
4.15 |
149 |
4.76 |
0 |
0 |
0 |
0 |
3 |
0.69 |
Steep Slopes |
1994 |
0.01 |
0 |
0 |
1 |
0.09 |
1 |
2.27 |
5 |
1.14 |
Mines |
0 |
0 |
0 |
0 |
0 |
0 |
0 |
0 |
0 |
0 |
Total |
17432318 |
100 |
3130 |
100 |
1062 |
100 |
44 |
100 |
437 |
100 |
Landscape suitability models for the St. Croix (Section 12.10) and Mississippi (Section 12.4) river valleys are partially within the Mille Lacs Uplands subsection. An additional landscape suitability model, not included in this report, was developed for the Trunk Highway 169 corridor along the western shore of Mille Lacs Lake. These models should be consulted for projects in the areas mapped. They are relevant for both surface and subsurface sites.
8.20 Minnesota River Prairie
8.21 Oak Savanna
8.22 Pine Moraines & Outwash Plains
8.23 Red River Prairie
8.24 Rochester Plateau
8.25 St. Croix Moraines and Outwash Plains (Twin Cities Highlands)
8.26 St. Louis Moraines/ Tamarack Lowlands
8.27 Conclusion
References
The Mn/Model Final Report (Phases 1-3) is available on CD-ROM. Copies may be requested by visiting the contact page.

Acknowledgements
MnModel was financed with Transportation Enhancement and State Planning and Research funds from the Federal Highway Administration and a Minnesota Department of Transportation match.
Copyright Notice
The MnModel process and the predictive models it produced are copyrighted by the Minnesota Department of Transportation (MnDOT), 2000. They may not be used without MnDOT's consent.