What is the Greater Minnesota Mobility Study?
The Greater Minnesota Mobility Study evaluated mobility investment needs on the National Highway System (NHS) throughout Greater Minnesota. The 2017 Minnesota State Highway Investment Plan identified the NHS as the priority network for mobility investments in Greater Minnesota. There are about 4,500 centerline miles of NHS roadways in Greater Minnesota. These roads are critical to the nation’s economy, defense and mobility and are the centerpiece of the Federal Highway Administration’s and MnDOT’s commitment to provide a safe, modern, and efficient transportation system.
The goal of the Greater Minnesota Mobility Study was to identify locations with the greatest mobility or reliability issues on the NHS and identify low-cost spot mobility improvements to address the needs identified. Due to the limited funding available and the needs across the state, the study focused on low-cost, high-benefit improvements.
Download the Full Greater Minnesota Mobility Study: Greater Minnesota Mobility Study – (PDF 24.3MB)
Online Map of the identified locations and scoring: Click the map to see all of the locations and details, overall score, and the scoring results for all criteria.
Study process and criteria
An evaluation process, illustrated in the following image, was developed to screen all NHS routes down to high-priority mobility locations that can be considered for low-cost, high-benefit mobility solutions.
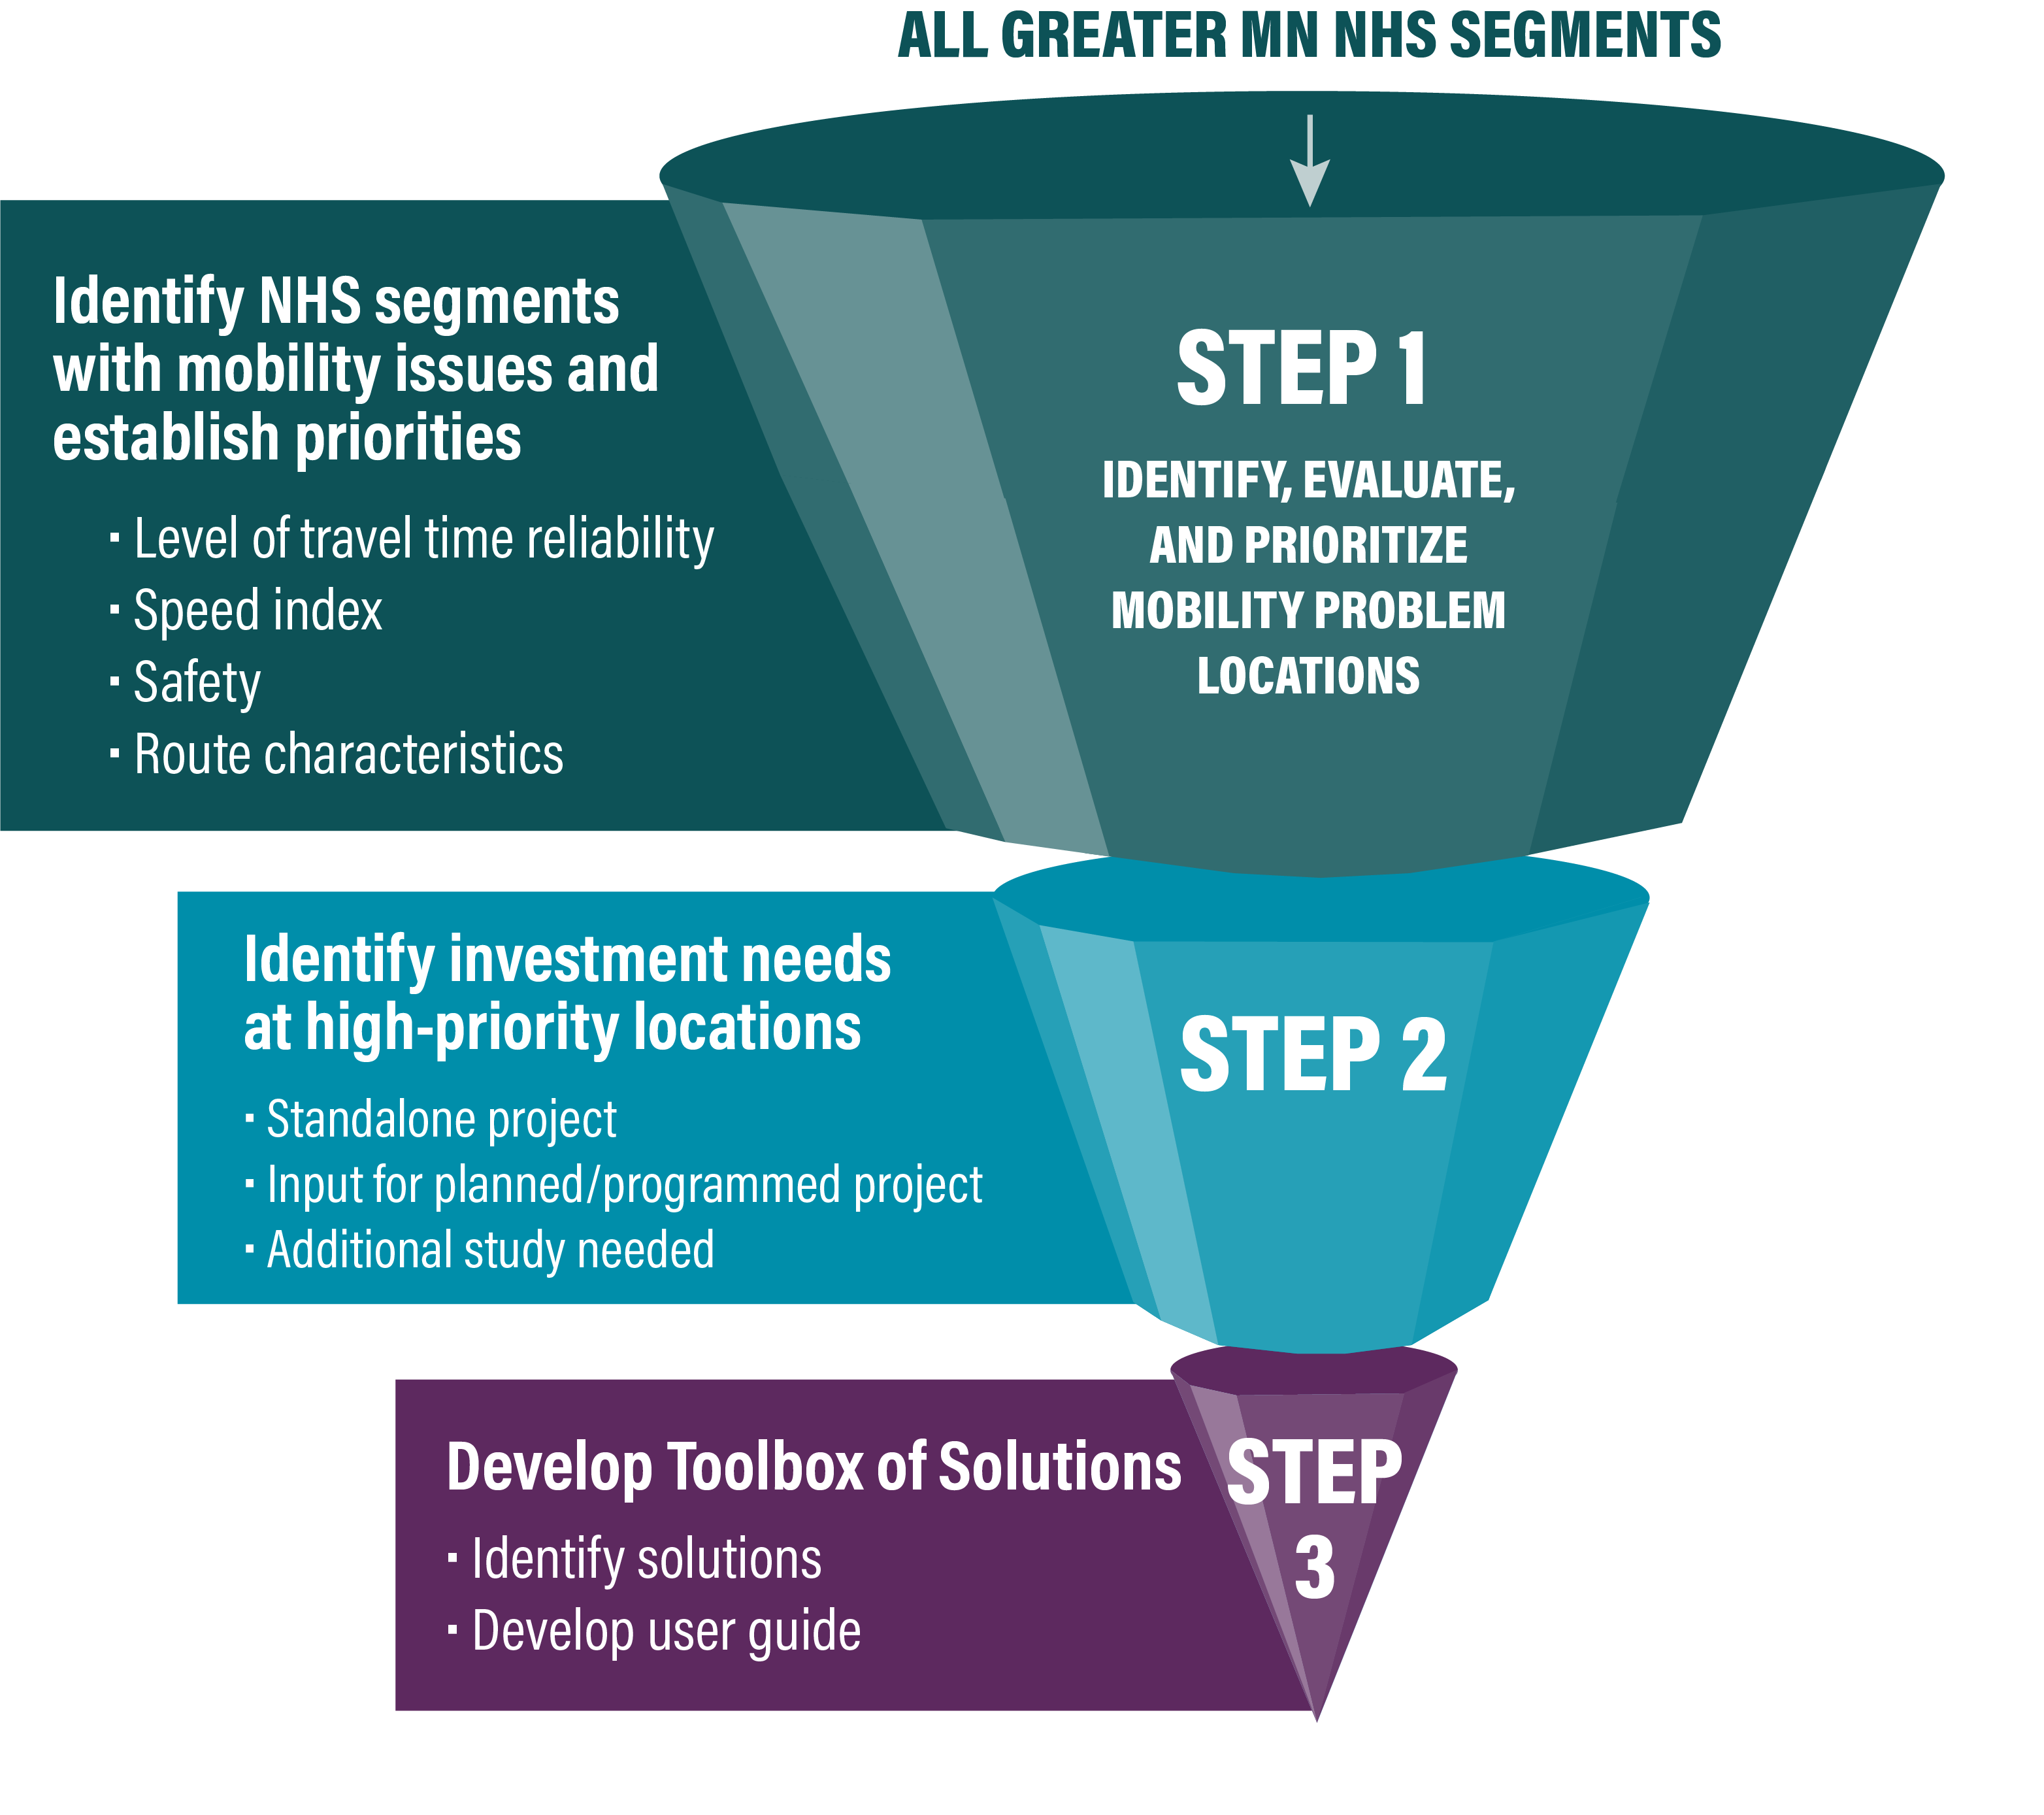
Step 1
Use consistent data across all seven districts to identify and evaluate mobility problem locations in Greater Minnesota and strategically select weighted criteria to prioritize the candidate locations in each district. The study used the National Performance Management Research Data Set from the U.S. DOT along with data from Streetlight and Minnesota crash and speed data and applied it to the entire NHS network in Greater Minnesota.
The Advisory Committee for the study selected and weighted the criteria applied to the locations. The final criteria used are listed below.
Mobility and Reliability: Prioritize locations with high variability in travel times and consistent mobility issues
- Level of Travel Time Reliability - Measures if travel time is reliable from day to day. If it usually takes 10 minutes to get through a stretch of road at noon on a Monday, unexpected changes to that travel time is a reliability issue
- Speed Index - Measures the difference between the posted speed limit and a road segment's historic average speed--what people actually experience
- Mobility Bonus – A combination of both Level of Travel Time Reliability score and and Speed Index score. The location receives a bonus if it exhibits a LOTTR issue AND Speed Index issue.
Safety: Prioritize locations that have a higher number of crashes and traffic volume as compared to other locations throughout the State
- Critical Crash Index: Provides a relative score based on the number of crashes
- Fatal and Serious Crash Index: Provides a relative score based on the number of fatal and serious injury crashes for a location
Additional Criteria
- Truck Volume
- Trip Length
- Rail Crossings
- Tourism
Step 2
Review and verify if the locations identified were in fact areas that exhibited mobility or safety issues. The project team looked to see if issues had been solved by a recently completed project, if a location required further study, or if it should be removed from the list of eligible locations entirely.
Step 3
Develop a toolbox of low-cost solutions that could be implemented for at-grade intersections, grade separated intersections, for segments/corridors, and for conditions where additional right-of way would have to be acquired. See the Toolbox of Solutions for an illustrative list of possible solutions to be implemented.
Funding
The funding will be distributed to the districts by their share of Vehicle Miles Travelled on the NHS across the seven districts. The funding allocated to Greater Minnesota Mobility in MnSHIP is approximately $13 million per year in 2022 and 2023. The allocation of funding is shown in the table below.
District |
NHS VMT |
Share of Greater MN VMT |
Mobility Funds per Year |
|---|---|---|---|
D1 |
1.96 B |
14% |
$1,800,000 |
D2 |
0.77 B |
6% |
$800,000 |
D3 |
3.98 B |
29% |
$3,700,000 |
D4 |
1.57 B |
11% |
$1,400,000 |
D6 |
2.89 B |
21% |
$2,700,000 |
D7 |
1.53 B |
11% |
$1,400,000 |
D8 |
1.09 B |
8% |
$1,000,000 |
Total |
13.79 B |
100% |
$12,900,000 |
Study highlights
One of the main outputs of the study was a district-by-district priority list of locations that were identified using the criteria along with district and stakeholder input. An example of this list can be seen below, with the full list of the 106 candidate locations can be found here.
Next steps
The results of the Greater Minnesota Mobility study will be used to select projects on the state highway system and will inform the next update of MnSHIP. Locations selected for funding will be listed in the STIP or CHIP.
The Greater Minnesota Mobility study is a repeatable process that can be periodically updated with new data. The advisory committee preferred to treat the two years of funding (2022-2023) as pilots for implementing this study.
MnDOT district staff also hopes to use these data sets to measure the effectiveness of completed projects. The Office of Transportation System Management will track these projects periodically to analyze changes to mobility, reliability, safety, and impact at the project locations.