
3.1 Transportation Safety
This section provides guidance for addressing Transportation Safety in the assessment of existing and future corridor conditions using the methods below. The assessment focuses on MnDOT’s goal of reducing fatal and serious injury crashes, in alignment with the Safe System Approach.
- Qualitative Input. Guidance to prompt input and discussion from partner agencies and the public in addition to the technical analysis.
- Technical Input. Guidance for collecting and reporting technical information on the following subtopics:
- Documented Crashes: Locations which exceed critical crash rates (particularly for fatal and serious injury crashes), are hotspots for vulnerable roadway user crashes, or which have other concerning crash patterns. MnDOT’s primary focus is on fatal and serious injury crashes.
- Crash Risk: Safety concerns based on crash risk rankings or assessments.
- Healthy Equitable Communities. Guidance and questions to help foster healthy and vibrant places that reduce disparities and promote healthy outcomes for people, the environment, and the economy.
The Transportation Safety section draws on multiple MnDOT guidance sections as cited below. It is more detailed than other Guidebook sections due to the more precise requirements and absence of a single guidance source for safety analysis in corridor planning.
See Appendix C: Plan Type Data Matrix for a summary of Step 3 data items as they relate to the different plan types (Corridor Project Plan, Corridor Vision Plan, and Regional Corridor Vision Plan) and adjust efforts as needed.
Policy Goals
The guidance in this section is framed by the following policy goals:
- The Statewide Multimodal Transportation Plan (SMTP) articulates the Transportation Safety objective as: “Safeguard transportation users as well as the communities the system travels through. Apply proven strategies to reduce fatalities and serious injuries for all modes. Foster a culture of transportation safety in Minnesota.”
- MnDOT’s Safe System Approach Implementation Plan (SSAIP) defines transportation safety as “elimination of the number and/or risk of fatal and serious injury crashes.”
- Minnesota Statute 174.01, Subd. 2, identifies 16 goals for the state transportation system. Of those, the following goal is relevant to transportation safety:
- (1) to minimize fatalities and injuries for transportation users throughout the state
In this document, “safety” is intended primarily to mean transportation safety; see discussion of personal safety under Other Topics for Consideration.
The questions in this section are intended to prompt input and discussion beyond the technical data considered below. People familiar with the study corridor can provide a depth of understanding that is not always captured in the technical analysis. Response themes or highlights from each should be summarized in the qualitative input section of the existing conditions report.
Agency Engagement
Coordinate with the project team to ask appropriate public agency staff questions such as these. Summarize responses. Consider all modes, particularly vulnerable users.
- Are there intersections known to have recurring transportation safety issues? Who is most impacted by them?
- Are there segments known to have recurring transportation safety issues? Who is most impacted by them?
- What concerns you when it comes to your own safety traveling in this corridor? What concerns you about how you see other people traveling in this corridor?
- Do community members let you know about transportation safety concerns along this corridor? If so, where, and what issues are they experiencing?
- Who might have safety concerns that you are not hearing from?
- Are there locations where motorist travel speeds feel unsafe or inappropriate for the context? Locations where travel speeds change?
- Are there areas where the road design encourages speeding, unsafe pedestrian crossings, or other unsafe behaviors?
- Are there locations where a significant cross section or context change would support a change in posted speed limits or travel speeds?
- Are you aware of any unique or informal vehicle or pedestrian / bicycle traffic patterns that we should review or consider in our corridor study? Examples could include convenience store across from an apartment complex; informal path leading to/from a neighborhood and school; large employer at beginning and end of shifts; school arrival/dismissal.
Public Engagement
Coordinate with the project team to incorporate questions such as these into public engagement activities. Summarize responses or themes as appropriate.
- Have you been involved in a crash or had a near-miss along this corridor? How did this change your life? How did it change how you travel?
- Do you know anyone who has been involved in a crash along this corridor?
- How safe do you feel when driving this corridor compared to others in the area?
- What is your experience with safety when walking or biking along this corridor? What is your experience with crossing the corridor?
- What would make you feel safe while traveling through or across this corridor?
- Are there locations where motorist travel speeds feel unsafe for the context? Locations where travel speeds change?
- Do you have concerns about your personal safety when driving, walking, biking, or taking transit in this corridor?
- What would you tell your child if they were a new driver along this corridor?
- Are there locations in your community where you or your family members would like to walk or bike, but you don't feel safe?
The table below shows the technical topic measurements and data to be included in the existing and future conditions analysis for Transportation Safety. See Appendix C: Plan Type Data Matrix for direction on level of detail and items that may be optional based on corridor plan type. The items below also may be modified by the scope of work for an individual corridor plan.
Table 7. Transportation Safety Technical Topics and Data
Topic |
Measurement |
Data Source |
Documented Crashes |
Critical index for fatal and serious injury crashes (intersection and segment) |
|
Presence on Ped/Bike High-Injury Network |
|
|
Critical index for all crashes (intersection and segment) |
|
|
Concerning crash patterns |
|
|
Crash Risk |
Locations of High Crash Risk |
|
Vehicle Speeds |
|
The sections below outline how to collect data and perform analyses for each of the Documented Crashes measurements. Prior to completing any analysis, Guidebook users should reach out to the appropriate MnDOT District Traffic Engineer and request crash history data and crash rates for all segments and intersections. If this information is available and determined to be sufficiently recent, Guidebook users may utilize those results and document each measurement as outlined in the “Summary” sections below. Full calendar years are typically used in the crash rates that can be provided by the District Traffic Engineer; prior year data typically is not available until June of the following year. If the data available from MnDOT is not determined to be sufficient, Guidebook users may complete the analysis following instructions below.
Critical Index for Fatal and Serious Injury Crashes
Published research on transportation and traffic safety has demonstrated a positive correlation between crash frequency on a roadway and the traffic volume on that roadway; roadways with higher traffic volumes typically experience more crashes than similar roadways with lower volumes. Calculating crash rates is one method of measuring the number of crashes while controlling for this traffic exposure. Crash rates at specific locations can be compared to statewide average or typical values for an intersection or roadway of the same type. However, a location that has a crash rate exceeding the average crash rate for similar locations should not necessarily be interpreted as having a safety issue. Instead, critical crash rates provide a statistical threshold for screening sites.
The critical rate is calculated by weighting the average crash rate for similar intersections or segments across Minnesota by the existing traffic volume. The critical rate for total crashes is calculated at a 99.5% confidence interval and the critical rate for fatal and serious injury crashes is calculated at a 90.0% confidence interval. A critical index is reported as the ratio of the observed crash rate to the critical crash rate. A critical index exceeding 1.00 indicates there may be a safety concern at the site. When analyzing the critical index, a value at or below 1.00 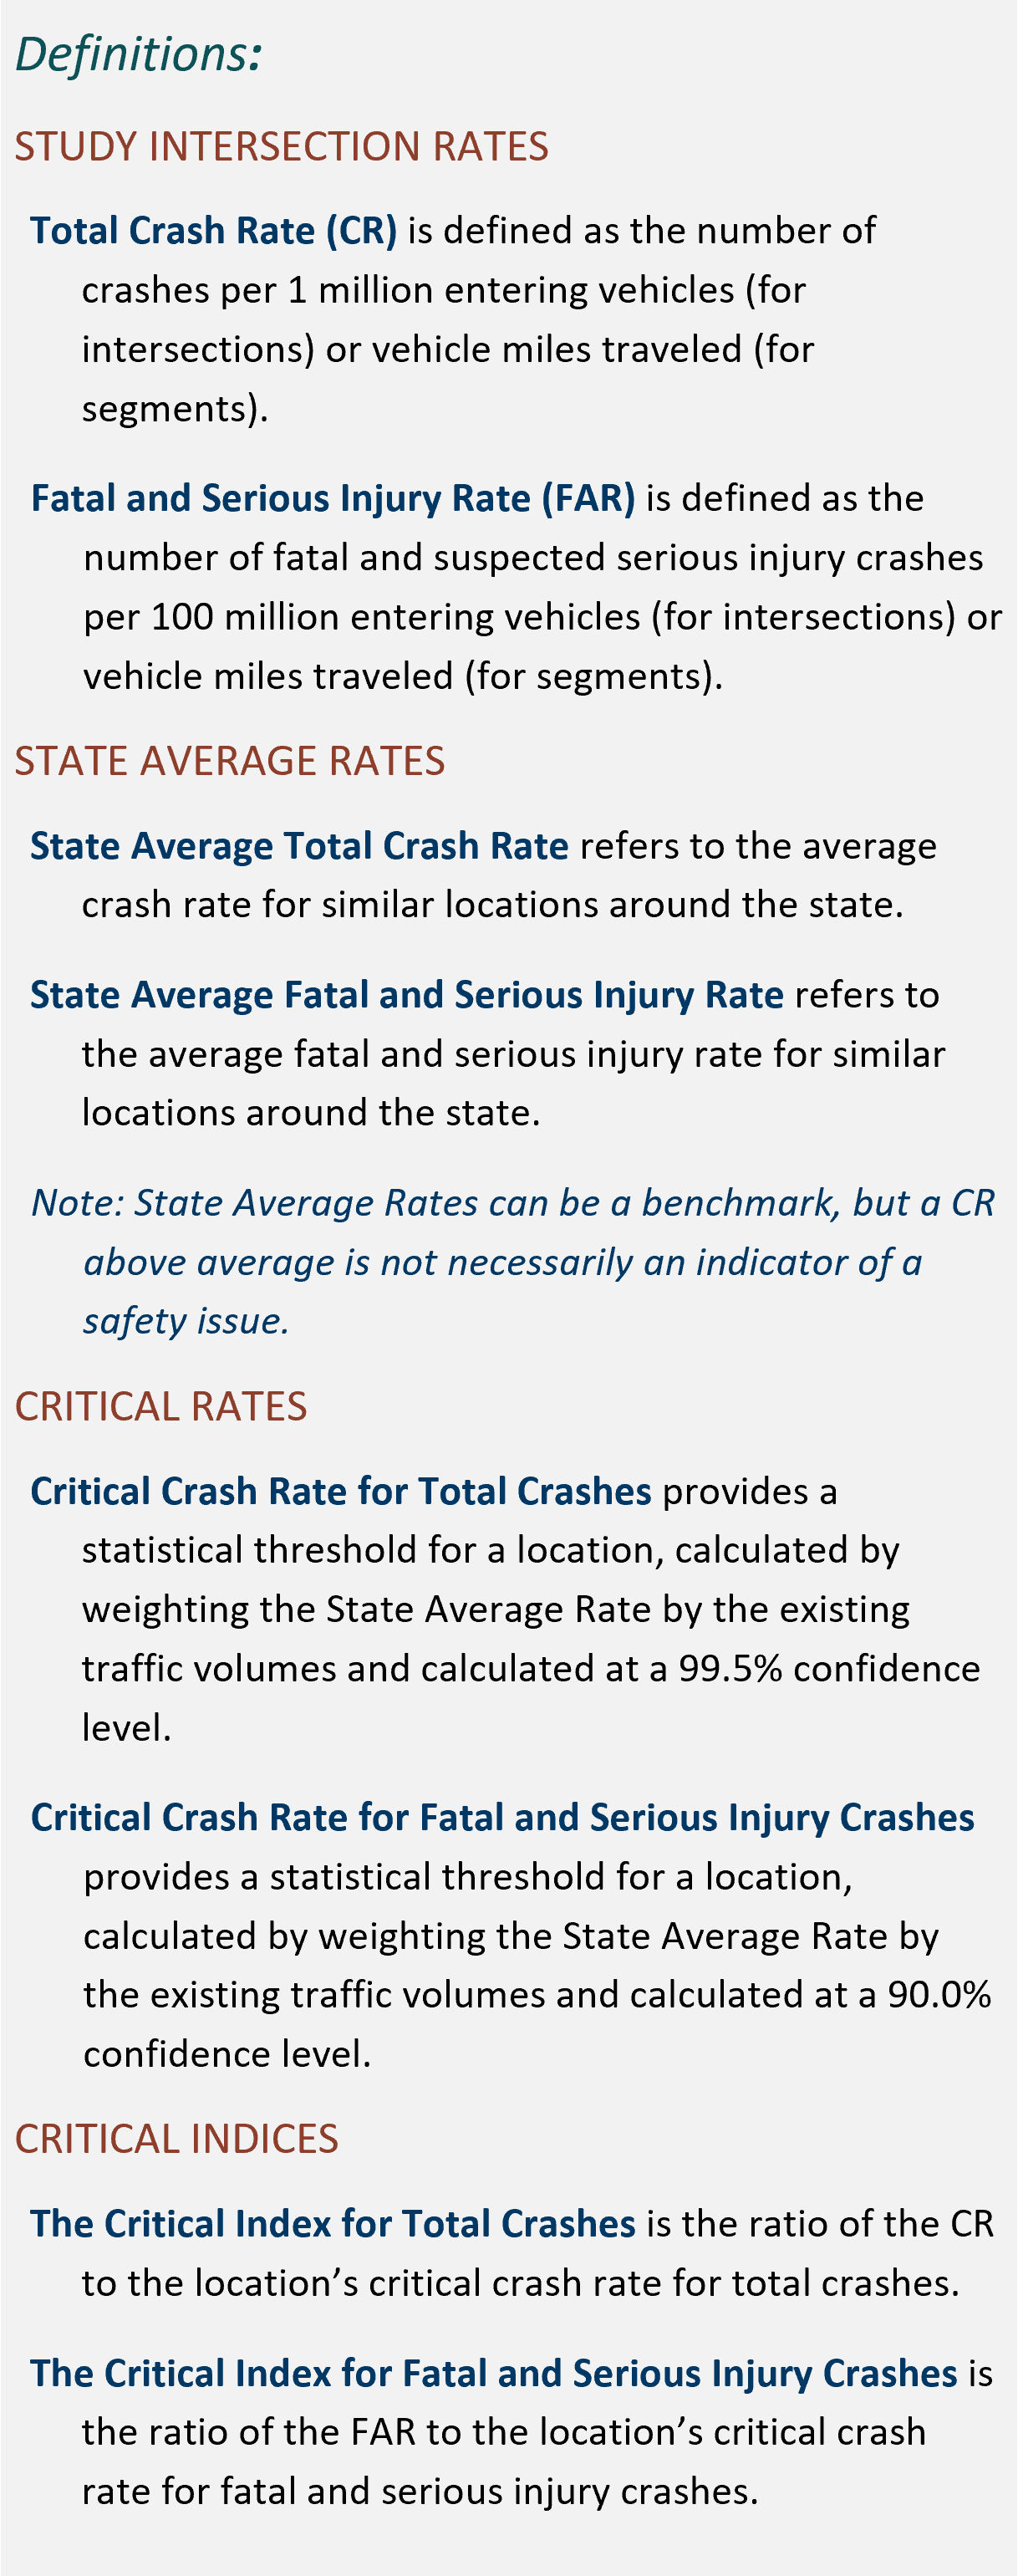 implies that the site does not deviate significantly from statewide trends; that is, it is performing within expectations.
This required measurement focuses on the critical index for fatal and serious injury crashes.
Data
The data needed to document critical crash locations includes the following, with instructions included below:
- Historical Crashes. Obtain crash data from the most recent 5 years by requesting it from the appropriate MnDOT District Traffic Engineer. If also calculating the measurement “Critical Index for Total Crashes,” you may request all data at this time. If only calculating the critical index for fatal and serious injury crashes, you may request to receive only that data.
- Note: five years may not be enough history for low volume roads or may provide too much data for high-volume roads. Guidebook user judgement can dictate a 10-year or 3-year analysis period instead if determined appropriate. However, the toolkits referenced in the Analysis section below assume a 5-year analysis period; any analysis completed with a 10- or 3-year analysis period must be calculated without the toolkit by a qualified professional.
- Historical Vehicle Volumes. Obtain historical vehicle volumes using MnDOT’s Traffic Count Database System (TCDS). Document all historical Annual Average Daily Traffic (AADT) volumes for each segment and each leg of intersection evaluated, during the years that crash data was obtained.
This analysis is performed using the Office of Traffic Engineering (OTE) screening toolkit spreadsheets, which can be downloaded at MnDOT's Traffic Safety webpage.
- Step 1. Review crash descriptions for fatal and serious injury crashes. If not already done, sort by intersection and segment.
- Step 2. Populate relevant input cells in the “Calculator” tab of the toolkits, utilizing separate spreadsheets for each intersection and segment.
- Step 3. Identify intersections and segments along the corridor with a Critical Index above 1.00 for Fatal & Serious Injury Crashes.
The critical index should be treated as a binary result; either it is above 1.00 indicating a statistically significant safety issue at a location or it is at or below 1.00 indicating there is not a statistically significant safety issue at the location. When comparing locations, the critical index should not be treated as an order of magnitude ranking of location safety due to the location-specific nature of critical crash rates. For example, a location with a critical crash rate of 2.20 does not necessarily have twice as many safety issues as a site with a critical crash rate of 1.10. Note that segments are identified based on land use context, volume, and number of lanes, and Guidebook users may further segment out sections as needed based on context. The analysts may report segment crashes with or without junctions included based on context and discussion with the project team. More information on this analysis, including background and calculations performed within the Toolkit, can be found in Chapter 11 of MnDOT’s Traffic Engineering Manual.
Documentation
Summarize the critical crash location analysis using a table and provide a brief summary statement. If also calculating the critical index for total crashes, the tables may be combined. The example table below shows the basic information that should be reported; additional information (table columns) may be needed based on the project and identified crash issues.
Example Summary: Critical Index for Fatal and Serious Injury Crashes
Location |
Type/Traffic Control |
Fatal & Serious Injury Crashes |
|
Count |
Critical Index |
||
Intersection A |
Signal |
1 |
0.44 |
Intersection B |
Through-Stop |
1 |
1.21 |
Intersection C |
Roundabout |
0 |
0.00 |
Segment A |
Urban |
1 |
0.53 |
Segment B |
Rural |
0 |
0.00 |
Takeaways: Intersection B has a fatal and serious injury rate above critical
Presence on Ped/Bike High-Injury Network
Vulnerable road users (VRU) are defined as any pedestrian, bicyclist, or other non-motorist involved in a motor vehicle crash. This would also include freight or delivery drivers when out of their vehicle making a delivery. Note that motorcycles are typically included the motor vehicle category. As documented in MnDOT’s Vulnerable Road User Safety Assessment (VRUSA), VRUs are disproportionately likely to be killed or seriously injured on the transportation system. MnDOT’s High Injury Networks (HINs) identify existing high crash corridors for VRUs.
Data
To document whether a corridor is present on a HIN, Guidebook users should look the corridor up on MnDOT’s VRUSA Data Dashboard. Using the dashboard, navigate to the “Where” tab, and zoom in to the corridor to see if it is highlighted. If highlighted, note which category. You may click on the segment for additional details. Note that the VRUSA was incorporated into the most recent Strategic Highway Safety Plan (SHSP) and that this dashboard is updated every five years as a part of the SHSP. To view the most recent pedestrian and bicycle crashes, review the crash history.
Documentation
Summarize safety issues using a map or a table. An example of a table is shown below.
Example Summary: Presence on Ped/Bike High-Injury Network (HIN)
Segment |
HIN Status |
Segment A |
Metro Bike HIN |
Segment B |
Metro Bike & Metro Ped/Other HIN |
Segment C |
Metro Ped/Other HIN |
Segment D |
Non-HIN |
Critical Index for All Crashes
This measurement is calculated in a similar way as the critical index for fatal and serious injury crashes. This is not necessary for all corridor studies but should be included if an Intersection Control Evaluation (ICE) is being prepared alongside or as a part of the corridor plan, or sometimes if other specific needs are anticipated. Note that if an ICE report is being completed, Guidebook users should reference MnDOT’s ICE Manual for requirements and guidance related to ICE reports.
Data
The data needed to document critical crash locations is described above for the Critical Index for Fatal and Serious Injury Crashes.
As with the critical index for fatal and serious injury crashes, this analysis is performed using the Office of Traffic Engineering (OTE) screening toolkit spreadsheets, which can be downloaded at MnDOT'sTraffic Safety webpage.
- Step 1. Review all crash descriptions and if not already done, sort by intersection and segment.
- Step 2. Populate input cells in the “Calculator” tab of the toolkits, utilizing separate spreadsheets for each intersection and segment.
- Step 3. Identify intersections and segments along the corridor with a Critical Index above 1.00 for Total Crashes.
Documentation
Summarize the critical crash location analysis using a table. This may be combined with the summary of critical index for fatal and serious injury crashes. Provide summary or takeaway statements.
Example Summary: Critical Index for All Crashes
Location |
Type/Traffic Control |
Total Crashes |
Fatal & Serious Injury Crashes |
Ped/Bike Crashes (Count) |
||
Count |
Critical Index |
Count |
Critical Index |
|||
Intersection A |
Signal |
96 |
1.37 |
1 |
0.44 |
1 |
Intersection B |
Through-Stop |
11 |
2.79 |
1 |
1.21 |
2 |
Intersection C |
Roundabout |
25 |
0.98 |
0 |
0.00 |
0 |
Segment A |
Urban |
61 |
1.17 |
1 |
0.53 |
0 |
Segment B |
Rural |
20 |
0.38 |
0 |
0.00 |
1 |
Takeaways:
- Intersections A & B and Segment A have total crash rates above critical
- Intersection B has a K/A rate above critical
- Intersections A & B and Segment B have documented pedestrian or bicycle crashes
Concerning Crash Patterns
 Even when crash rates for fatal and serious injuries are not above critical, there may be concerning patterns in the historical crash data. For example, angle crashes and pedestrian/bicycle crashes always have a higher likelihood of being fatal or causing serious injury and a pattern of these crashes can be concerning and in rural areas, lane departure and head-on crashes have a higher likelihood of being fatal or causing serious injury. This measurement is a qualitative evaluation of crash patterns.
This analysis is not necessary for all corridor plans but should be included if an Intersection Control Evaluation (ICE) is being completed alongside or as a part of the corridor plan, or sometimes if other specific needs are anticipated. Note that if an ICE report is being completed, Guidebook users should reference MnDOT’s ICE Manual for requirements and guidance related to ICE reports.
Data
Historical crash data is needed to document concerning crash patterns and is described above for the Critical Index for Fatal and Serious Injury Crashes. When requesting data, specify that crash reports are desired.
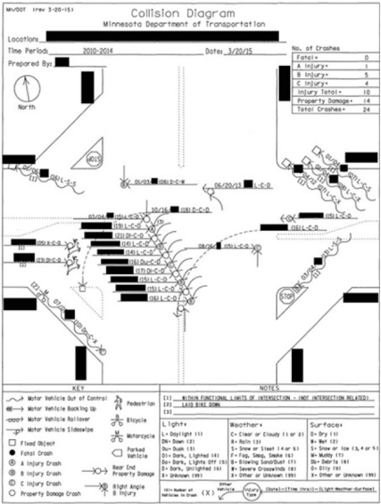
Ideally, this analysis relies on intersection collision diagrams, a tool used to graphically represent crashes at a specific intersection (see example diagram). Collision diagrams help identify crash patterns and may help identify potential problem areas. If a less-detailed evaluation is determined to be appropriate, a brief summary of crash types may be used.
Using crash reports, draw a symbol using the collision diagram key for each recorded crash located near where the crash occurred in relation to the intersection. Each symbol should include details on crash type, injury, light, weather, surface, day, and time. An example collision diagram is shown here, and more information can be found in Chapter 11 of MnDOT’s Traffic Engineering Manual.
Documentation
Summarize findings with a brief narrative describing concerning crash patterns.
The sections below outline how to collect data and perform analyses for each Crash Risk measurement.
Vehicle Speeds
This measurement focuses on vehicle speeds and speed issues associated with crash risk.
Data
The following data are needed to document vehicle speeds and associated issues:
- Existing Speed Limit. Obtain existing posted speed limits via online map preview or during a corridor field review.
- Existing Vehicle Speeds. Obtain existing vehicle speeds using field-collected data. This can be accomplished using equipment such as a handheld radar, mounted radar, or tube collectors. It can also be done using connected device data, which can be obtained through a platform such as ClearGuide or StreetLight.
Documentation
Summarize data using tables. Understanding existing speed data will be key for alternatives evaluation and recommending improvements that align with the Safe System Approach’s Safe Speeds element. Conditions related to speed that are considered issues could include a high speed limit, vehicles traveling over the speed limit, or otherwise unsafe speeds for the roadway context.
Identify the following items, for daily as well as peak hour traffic:
- Range of vehicle speeds
- Average vehicle speeds
- 85th percentile speeds
- Percentage of vehicles found to be speeding
Locations of High Crash Risk
To complete this analysis, Guidebook users should contact the appropriate MnDOT District Traffic Engineer and request the District Safety Plan (DSP) as well as the full list of risk scores for the corridor in the DSP geodatabase. This may be done at the same time that Guidebook users are requesting historical crash data. District Traffic Engineers will provide relevant sections of the DSP and geodatabase at their discretion.
MnDOT’s DSPs identify Sustained High-Crash Locations (SHCLs), which include roadway segments, curves, and intersections, as well as an analysis of systemic safety. This section of the Guidebook focuses on a summary of systemic safety of a corridor as reported in the DSP, with less emphasis on the SHCLs as the in-depth historical crash analysis is described above. In the 2025 DSP update process, the systemic risk analysis is described as a proactive, data-driven approach to enhance roadway safety, which identifies and prioritizes safety deficiencies on roads based on the risk of a future severe crash instead of focusing solely on locations where crashes have already taken place.
Data
As noted above, data needed for this measurement is included in the DSP and the related geodatabase. The following data is included in this measurement:
- List of locations identified for projects, and “next up” high priority locations, if applicable
- Intersection risk scores
- Segment risk scores
- Curve risk scores
- The MnDOT VRUSA Data Dashboard should also be consulted for information on crash risk (see the Areas of Greater Potential for Risk for VRU Collisions data layer).
Documentation
Review the DSP and geodatabase and VRU Data Dashboard for the information identified above related to the study corridor and summarize the crash risk data using a map or a table.
This section identifies topics that are typically relevant only to select corridors or locations. They should be considered and included if determined to be relevant by the project team.
Railroad Safety
Evaluating railroad safety may be relevant for a corridor that includes rail crossings or has a rail line running parallel or nearby. Potentially relevant concerns related to railroad crossing safety include trespassing, safe crossings for pedestrians, railroad cargo theft, trucks getting stuck at humped crossings, land use encroachment on railroads, hazardous material movements on trains, geometric design and sight distances for crossing sites.
The MnDOT Rail Crossing Safety Action Plan identifies key safety issues and opportunities, and encourages that corridor planning staff coordinate with the Railroad Safety Project Managers as a first resource for any projects that may need railroad coordination or if there are safety issues or concerns.
Topic |
Measurement |
Potential Data Sources/Resources |
Railroad Information |
Reference data (railroad name, railroad owner/operator, speed data) |
|
Potential Concerns |
Risk factors |
|
Historical Crash Data |
Crash trends over time (including type of crash, type of crossing safety equipment, risk factors present during a past crash) |
Personal Safety
In discussing transportation safety with community members, the topic of personal safety – for example, concerns about being harmed by other people while using or accessing the transportation system (walking in the dark, waiting for a bus) – is often raised. These concerns may or may not be able to be addressed within the scope of the corridor study; however, the concern may still be relevant and the project may provide an opportunity for coordination with other agencies.
Near-Miss Data
There may be some intersections and corridors that lack a crash history or do not show up as a high-risk location in the documentation outlined above but experience many “near-miss” incidents where crashes are narrowly avoided. This is usually a sign of a safety issue and crashes waiting to happen. Guidebook users may discover instances of near-miss crashes during the public and agency engagement process when asking qualitative questions about where corridor users feel unsafe. Guidebook users may also consider accessing “big data” sources which identify patterns of hard braking to identify locations with near-miss incidents, though it should be noted that this is an emerging practice and data may be costly.
Multiple strategies may be used in a safety analysis aimed at fostering healthy and vibrant places that reduce disparities and promote healthy outcomes for people, the environment, and the economy. Guidebook users should prepare a summary of how healthy equitable communities were considered and include it in the memorandum or report that documents the safety assessment.
Healthy Equitable Communities
Use a combination of demographic information (Step 2), technical input and input from community members and agency staff to provide responses or observations related to the questions below.
- Are corridor crashes higher in underserved communities than in the region as a whole?
- Are there disproportionate transportation safety risks for people who regularly walk, use a mobility device, bike, or use other means of non-motorized travel? Are there related concerns about personal safety using the transportation system?
- Are there safety issues present that prevent roadway users from shifting from motorized to non-motorized modes? (This is different from the walking and biking note above as it is about the choice to travel via non-motorized modes.)
- Are there traffic safety issues that discourage people from visiting businesses and other destinations along the corridor?
Cross-References
See related guidance in the section(s) listed below:
- Step 3: Critical Connections: Pedestrian, Bicycle, and Transit to understand crash patterns related to schools or other high pedestrian/bicycle land uses