This graphic represents the hierarchy of traffic data collection methods in the Traffic Forecasting & Analysis section. At the top of the pyramid, Weigh-In-Motion (WIM) sites collect four types of data at the fewest number of sites. At the bottom of the pyramid, thousands of sites statewide are used to collect one type of data, traffic volume. View larger version
Traffic data on all traffic volume products is represented as Annual Average Daily Traffic or AADT. This is an estimate of the total number of vehicles using a length of road (in both directions) on any given day of the year. This estimate represents the total number of cars per year divided by 365 days. The AADT are developed using factors that adjust for season, day of the week, and vehicle type.
AADT values are subject to variability. Historical AADT’s should be referenced along with the most current information. Traffic counts are scheduled before a project starts or after it is completed, but some construction effects are unavoidable when collecting traffic data. Construction affects traffic patterns on the entire road network, another reason why users should reference historical traffic volumes.
Roadways Counted for AADT:
Trunk Highways are major roadways:
Interstate
US Highway
MN State Highway
Local system roads are lesser roadways:
County State Aid Highway
Municipal State Aid Street
Other additional roadways as needed for federal reporting, such as:
Annual reporting of VMT and AADT to the Federal Highway Administration (FHWA) for federal travel analysis and funding (code of federal regulations: 23 CFR Part 500 Subpart B and 23 CFR 420.105)
One of many factors in annual funding of the County and Municipal State Aid road systems
Component of rail crossing safety reviews, speeds and crash rate analysis
Facilitating decision making for planners, engineers, forecasters, businesses, and the general public
The traffic volume program is funded in two parts. Data collection activities are funded by the MnDOT district or responsible agency. Processing, review and publication are financed by federal funds. If time and/or resources in any given count season become limited the priorities of the program will be Trunk Highway and HPMS counts, followed by CSAH and MSAS.
The traffic volume program produces AADT values for approximately 40,000 count locations and traffic segments. A traffic segment is a section of roadway where a single AADT value or traffic volume is applied. The traffic volumes along segments may vary within a range called the Acceptable Percent Change.
There are several ways to collect data for determining AADT:
Workers installing continuous count sensors on a roadway
At least 34,000 are short duration counts (typically 48 hours). These sites only collect traffic volume and make up the majority of all count locations.
At least 2,000 are sites where data comes from the Regional Traffic Management Center. These sites collect volume data from sensors or loop detectors which is extracted by MnDOT central office and converted to an AADT.
At least 1,500 are Vehicle Classification sites. These collect traffic volume and vehicle type.
At least 180 are an Automatic Traffic Recorder, ATR. These are continuous devices with loops in the pavement that collect traffic volume. Some sites also collect vehicle classification and/or speed data.
At least 20 are a Weigh in Motion System, WIM. These are continuous sites that collect vehicle weight, type, speed and volume.
How and Where Counts are Taken
Most traffic data is collected by MnDOT District staff. Many counties and cities in the Metro submit their own count data. MnDOT provides a yearly schedule of locations to count.
Most traffic counting occurs between April and October. More details about field activities are available in our MnDOT Traffic Counting Handbook. MnDOT was recently given FWHA approval to use mobile sourced AADTs where they meet validation metrics. To learn more please contact Traffic Forecasting and Analysis at MnDOT and/or review the overall workflow for how mobile sourced AADTs will be used: MnDOT Mobile Source AADT Workflow Summary.
Raw counts may be submitted to MnDOT at any time, but may not be used if submitted past the annual reporting deadline. Please contact the Traffic Volume Section for how to submit data. AADT values are determined in the fall/winter. The Official AADT values, or Traffic Volumes, are then published the following spring/summer (Data Products).
Interstates, US highways and MN state highways scheduled every three years and local system (CSAH and MSAS) roads every six years. Requests for data collection more often than the count schedule should be taken to the State Aid Office and/or the Count Manager. AADT is published for the year the data is collected. Ramps and other counts in both greater MN and the metro area which are needed for FHWA reporting are scheduled on a six year cycle per the HPMS Field Manual. AADT is published for the year the data is collected.
Data Screening and Recounts
Factoring of Incoming Short Count Data
Raw short duration volume traffic counts are factored.
ADT – Average Daily Traffic (raw data, unadjusted/non-factored data)
Seasonal Factors – These day of week and month of year factors are used to correct for bias according to the time of year the count is taken.
Axle Factors – These factors adjust axle counts into vehicle counts
Seasonal factors are applied to raw volume counts to correct for differences between weekday and weekend traffic as well as month-to-month changes in traffic volumes. Raw volume counts, unless collected with vehicle detection equipment, are based off axle hits. Each set of two axles generally means one vehicle. To correct for vehicles with more than two axles an Axle Factor is applied.
Seasonal factor groups were created using a hierarchical clustering procedure with the Ward’s method. This method and additional analysis resulted in four types of travel patterns called cluster groups. Each cluster group has a set of seasonal factors.
Similar Weekdays and Weekends (11)
High Weekends and/or High Summer (4)
Higher Weekdays/Commuter (9)
Moderately High Weekends and/or Moderately High Summer (17)
Axle factor groups are based on the Functional Class and Urban/Rural coding of the roadway. Seasonal Class factors are based on the bin scheme and the urban or rural designation of the roadway. These factors are only applied to classification or length-based counts.
All short count sites are assigned a Seasonal and Axle group. The 48 hour short counts are typically set for data collection on a Monday, Tuesday or Wednesday. Seasonal factors are developed each year using information from the Continuous Collection devices throughout the state. Please contact the Traffic Counts/AADT unit for a complete list of available factors.
Prior to 2020 the Axle factors, created from past short-term class counts, were only applied to Interstates, US Highways and MN State Highways.
Screening of Incoming Short Count Data
Traffic observation for manual short counts
The 24 hour adjusted count is compared to the most recent AADT for the same location. If the adjusted count falls within the Acceptable Percent Change criteria, then it is used to determine an AADT. If not then the count history is reviewed and if needed a recount is requested from the responsible agency. Specific count comments about the route, such as new housing, business closed, or roadway no longer a thru street, are very helpful and could eliminate the need for a recount.
Determining AADT
AADT values are determined throughout the count season once acceptable data and/or recounts have been collected.
Methods to determine AADT are based on the following conventions:
Adjusted counts at any location are highly variable.
Adjusted counts at any location vary around an average that is relatively constant through time.
Historic adjusted counts can be used to verify current count information.
AADT can change from its historic pattern when conditions change. Examples include new development, closure of a large employer, long-term construction, or changes in the roadway alignment.
Process
All traffic counts are reviewed using an AADT decision process and the Acceptable Percent Change table. If the count and/or field observations indicate a change in traffic pattern further analysis is done before the count data is used for AADT. As a rule a new AADT will not be published if the site does not have valid data collected in that season. For a small number of locations where an accurate traffic count is not possible the count is postponed or the site is estimated. When there is a new count location and no data is available, an AADT may be determined if required for HPMS. This is done using the surrounding counts, location input, or the trip generation method from the Institute of Transportation Engineers manual. The Official AADT's after Draft Review are posted to the website when available (Data Products).
Draft Review Process and Timeline
Local agencies can comment on their traffic volumes before they are officially published.
All Draft AADT comments should include the following information. Comments will be reviewed in a timely manner and a response will be sent as soon as possible.
Route Name
Location ID
Draft AADT
Explanation of why the Draft AADT should be changed. Additional documentation such as traffic counts and construction/detours can also be submitted for consideration.
MnDOT construction crew working on a highway project
The goal of AADT estimation is to represent “typical” traffic for the current count cycle. These estimates are used for a number of years, so it is necessary to represent “normal” conditions. In order to limit construction effects on AADT, we have adopted the following policies:
Traffic counts scheduled in areas affected by construction should always be taken before or after a construction project. This includes count locations in the surrounding area, especially detour routes.
If a project lasts the entire count season, the counts should not be taken and the AADT will not be updated for that count cycle, unless special circumstances are identified.
If the construction project lasts several years, then the resulting effect can be considered “typical” for that count cycle within approval of the local agencies. Traffic data can be collected and AADT values will reflect these changes.
The Crosstown Reconstruction Project, completed in 2010, heavily influenced AADT on I-35W and nearby roads.
Overall Program Administration: Raw count data processing, local agency field collection, program procedures, count location management, AADT estimates, draft AADT comments and official AADT reporting.
MnDOT District Count Contact: MnDOT field collection, coordination of state and local activities that impact data collection (construction, detours, mowing and street cleaning).
District
County
Contact
Email
D1 - Duluth
Carlton, Cook, Itasca, Koochiching, Lake, Pine, Saint Louis
Counties and cities in the metro area take their own traffic counts on County State Aid Highways, County Roads and Municipal State Aid Streets. These counts are submitted to the Traffic Volume Program for processing. AADT from these counts are shown on the official MnDOT traffic volume maps. Some metro agencies have their own counting practices. These agencies may not use the same methods outlined above. More information may be available, including more recent count data. Contact the Total Volume Program at MnDOT for the latest metro contacts: /tda/contacts.html
Minnesota’s vehicle classification program is designed to gain an understanding of the volume and type of heavy commercial vehicles that utilize Minnesota’s portion of the National Highway System as well as Interstates, US Highways, Minnesota Highways and select local roadways throughout the state. This is being accomplished through an integrated system of data collection devices that includes both continuous and short-duration counting methods. Vehicle classification data is collected from weigh-in-motion sites (WIM), continuous classifiers (ATR), pneumatic tube counters, and manual counts; and the data is archived in a database for analysis and reporting purposes. Heavy commercial annual average daily traffic (HCAADT), which is the theoretical estimate of the total number of heavy commercial vehicles using a specific segment of roadway (in both directions) on any given day of the year, is derived from these counts. This estimate represents the total number of heavy commercial vehicles per year divided by 365 days and is developed using factors to adjust for season. Heavy commercial vehicles are defined as all trucks with at least two axles and six tires.
1700+ active locations (approx. 95% tube, 5% manual) that are each scheduled every 2 years
Special counts (project related)
2900+ Parent/Child heavy commercial relationships established for all trunk highway traffic segments where no classification has taken place; all major segments have at least one vehicle class count for HCAADT determination.
All vehicle classifiers collect data on axle spacing for thirteen classes of vehicle types (Vehicle Classification Scheme) that are stored in the database by hour. Body type data is available for all data collected manually. Tube counts are set for 48 hours and manual counts are taken for six hours (generally from 8 AM to 2 PM), both during weekdays and between the months of April and October. The short duration classification counts are adjusted to AADT volumes by using factors developed from the continuous counters. These factors take into account the variations of truck volumes by month and day of week. The parent/child relationships developed enable us to automate the process for the production of heavy commercial vehicle type volumes and estimated loadings at all HPMS segments.
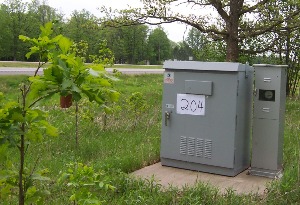
Automatic traffic recorders are permanent devices in the pavement surface that continuously and automatically collect traffic data. Currently, there are 155+ active devices maintained by MnDOT throughout the state: 75+ in the seven-county metro area and 80+ in greater Minnesota. All stations produce vehicle volume data. However, some ATR stations collect additional types of data depending upon their equipment and sensors. ATR's equipped with multiple axle sensors per lane collect vehicle classification data to distinguish between motorcycles, cars, and trucks, and some ATR’s use permanent loop or Piezo sensors to record vehicle speed. After the data polling and processing is complete, this information can be aggregated to report vehicle volume, speed, and vehicle classification characteristics.
Located along US 169 near Onamia, ATR 204 collects volume, speed, and classification data.
ATR data is used by the Traffic Forecasting & Analysis Unit to estimate statewide VMT trends, calculate design hour volumes (K factors), directional splits (D factors), and seasonal adjustment factors. K and D factors affect decisions made when designing roads, and Seasonal Adjustment Factors modify 48-hour weekday traffic counts that are used to produce AADT estimates for roads throughout the state. The data also contributes to our understanding of design hour volumes which, in turn, affect decisions made in the design of roads. Since ATR stations report continuously but sometimes fail to record data, the data record for each station is augmented with contextually determined and historically valid estimates. These estimates help to eliminate bias that could be introduced by non-reporting. When estimation is not possible, an ATR is determined to be unusable or "inactive" and will not be used in reporting. ATR’s that have been affected by weather (snowfall, heavy rain, fog, etc.), construction, detours, or other forms of traffic disruption that represent "atypical" data are noted not included in factoring efforts.
There is a wealth of ATR data available on the Data Products page, a majority of which can also be found in monthly and annual reports. The ATR Monthly Volume Station Reports examine variations in monthly average daily travel (MADT), monthly average weekday/weekend travel (MAWDT/MAWET), and total volume at each ATR with the use of data tables, graphs, and qualification notes. The annual Continuous Traffic Recorder Report provides data and analysis for all ATR and WIM sites for an entire year. The data provided includes AADT and MADT figures, Station Location maps, 10-Year and Year-to-Year Percent Change of AADT maps, Highest Hourly Volume reports, and Truck Volume graphs.
Using radar technology, SmartSensor HD devices have the capability of detecting up to ten lanes of traffic at a time.
SmartSensor HD is MnDOT’s newest non-intrusive automatic traffic counting device. The SmartSensor HD from Wavetronix LLC uses radar technology to collect volume, speed, vehicle length, and length based classification. This unit has a detection range of 250 feet with the ability to detect up to ten lanes of traffic concurrently. After installation SmartSensor HD requires little or no on-site maintenance, and are very economical when compared to other Automatic Traffic Recorders.
The Office of Maintenance along with the Office of Transportation System Management (OTSM) have been working together to deploy SmartSensor HD to collect traffic data throughout the state.
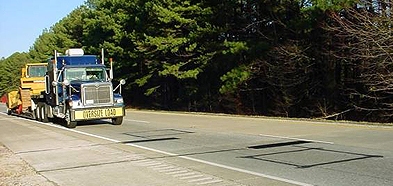
In addition to collecting the type of data that ATR's capture (volume, classification, speed), weigh-in-motion (WIM) devices collect axle loadings, vehicle and axle configuration, and truck volume characteristics.
When a vehicle passes over a WIM site, a sensor emits an analog signal whose strength is directly proportional to the axle weight of the vehicle, and the approximate weight is recorded.
A truck with an "Oversize Load" sign approaches a weigh-in-motion site
After the volume, class, speed, and weight data from all WIM sites is processed and analyzed, the WIM Monthly Station Reports are posted online and data is submitted to the FHWA. Analysis of annual trends in the data can lead to a better understanding of changing truck fleet characteristics and truck weights.
Gross vehicle and axle weight monitoring is useful for a wide range of reasons, including:
Traffic forecasting is the production of future traffic volumes and loads on a specific roadway segment. The projections are derived by trending historic vehicle classification data and considering the effects that future changes in the socioeconomic factors and traffic trends will have on the particular segment.
Traffic forecasting plays a major role in determining infrastructure capacity. It can help predict how much traffic to expect on highways twenty years from now.
The most common requests for traffic forecasts in the TFA Unit are:
Base and design year annual average daily traffic (AADT)
Base and design year heavy commercial annual average daily traffic (HCAADT)
Design hour volumes (DHV) with associated directional distribution (DD)
20- and 30-year cumulative Equivalent Single Axle Loads (ESALs)
A basic element of roadway design is the estimation of ESALs, which are numeric factors that represent the effect axles in different configurations and weights have on pavement performance as compared to the effect of a single 18,000-pound axle. The estimates are calculated by forecasting the traffic the road will be subjected to over its design life, then converting the traffic to a specific number of ESALs based on the composition of that traffic. This helps to develop structural and pavement design options for future roadways.
The MnESAL Traffic Forecasting Tool is an Excel program that uses AADT/HCAADT and vehicle class data to forecast 20-year BESALs and 35-year CESALs.
The following are examples of how traffic forecasting is used in transportation policy, planning, and engineering:
Calculations of infrastructure capacity (e.g., how many additional lanes will be added to an interstate highway)
Estimations of financial and social viability of projects (e.g., how a new trunk highway route will affect a suburban area)
Calculations of environmental impacts (e.g., how the air and noise pollution from a future airport will affect surrounding neighborhoods)

.png)