Environmental process | Environmental review | Greenhouse Gas Analysis
Greenhouse Gas Analysis process
- Greenhouse Gas Analysis Standard Attachment for Categorical Exclusion Projects (Word)
- Minnesota Infrastructure Carbon Estimator (MICE) tool
- MICE 2.1 User Guide (PDF)
For any questions regarding the Greenhouse Gas Analyses process, please email MICEanalyses.DOT@state.mn.us or contact the MnDOT Greenhouse Gas Specialist Daniel Saunders at daniel.saunders@state.mn.us.
Email your final Greenhouse Gas Analysis to MICEanalyses.DOT@state.mn.us"
Background
Minnesota’s position near the center of North America subjects us to an exceptional variety of extreme weather. During the course of a single year, most Minnesotans will experience both blizzards and heatwaves, windstorms, strong thunderstorms, and heavy rains.
In 2007, the state passed the bi-partisan Next Generation Energy Act (NGEA) that established goals for the state to reduce greenhouse gas (GHG) emissions by 15% below 2005 levels by 2015, 30% by 2025, and 80% by 2050. However, the state did not meet our 2015 goal and we are not on track to meet our future goals. The 2017 update to the Minnesota Statewide Multimodal Transportation Plan applied the Next Generation Energy Act goal to the transportation sector and set a target to reduce GHG emissions from transportation to 29.5 million tons by 2025.
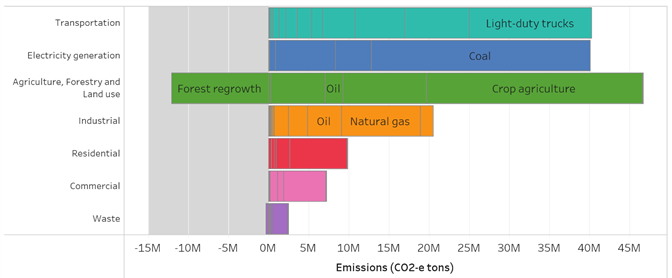
The most recent greenhouse gas (GHG) emissions inventory from the Minnesota Pollution Control Agency (MPCA) showed that transportation overtook the electricity generation sector as the number one source of GHG emissions in Minnesota in 2016. This data is consistent with trends in other states, and changes in both sectors and trends (electricity is decreasing, transportation is increasing) are expected to continue in the future. Emissions from electricity generation have decreased almost 30 percent between 2005 and 2018, largely due to the reduced use of coal and increased use of renewable energy and natural gas, which are more cost effective and have lower carbon emissions. Transportation emissions decreased seven percent from 2005 to 2018, due to federal fuel efficiency standards. However, the market trends towards purchasing larger vehicles and more miles traveled have prevented reductions that are more significant. See the following figure for more information.
In 2019, MnDOT worked with other state agencies to explore ways to reduce GHG emissions from the transportation sector. This process resulted in the Pathways report, which contains a number of actions that MnDOT committed to take and recommendations for other state agencies and the Governor to consider. MnDOT committed to analyze GHG emissions from transportation projects as part of the environmental review process starting on January 7th, 2020.
The FHWA does not currently have any requirements for GHG or climate impacts analysis for highway projects. This guidance is for the MnDOT requirement, but it applies to state and federally funded projects. This analysis is not a pass/fail criterion (like transportation conformity for air quality) or a selection criterion for choosing a preferred alternative, but is for disclosure purposes only.
Threshold criteria
This guidance applies a tiered approach that focuses on evaluation of the projects that have the greatest potential GHG emissions and does the following:
- Bases the level and type of analysis (qualitative/quantitative) on the data available, as determined by the environmental documentation (e.g., there is more data available for projects with a required quantitative mobile source air toxics (MSAT) analysis)
- Applies more effort on projects with a greater potential for substantial GHG emissions
Follow this guidance to all state and/or federally funded projects on MnDOT facilities that require a Categorical Exclusion (CATEX), Environmental Assessment (EA), Environmental Assessment Worksheet (EAW), and Environmental Impact Statement (EIS) with the following exceptions:
- Projects that have an Early Notification Summary Memo for the environmental document
- Projects with a total construction cost of less than $1,000,000 (See the current MnDOT State Transportation Improvement Program (STIP) or use the current cost estimate)
- Project types that are not included in the Minnesota Infrastructure Carbon Estimator (MICE) tool.
MICE is a spreadsheet tool that estimates the lifecycle energy and GHG emissions from the construction, operations, and maintenance of the transportation facilities. It is a Minnesota-specific version of FHWA’s Infrastructure Carbon Estimator (ICE), incorporating Minnesota-specific vehicle emissions rates, the capability for build/no-build analysis, and other enhancements. The MICE2.1 User Guide contains detailed instructions for using the tool.
Examples of projects that MICE covers are:
- Bridges and overpasses (new construction or reconstruction)
- Bus rapid transit
- Culverts and storm sewers
- Light and heavy rail
- Lighting
- Parking
- Pathways (trails and sidewalks)
- Roadways
- Roadway Resurfacing and Reconstruction
- Signage
Examples of projects that MICE does not cover are:
- Bridge maintenance and repair activities
- Custom pavements
- Fencing
- Guardrails and cable barriers
- Landscaping
- Noise walls
- Pavement overlay projects (e.g., chip seal)
- Projects under negotiated maintenance contracts
- Ramp metering
- Traffic signals/replacements
- Variable message signs
- WIM and other truck monitoring infrastructure
Detailed requirements
MnDOT evaluates operational and construction/maintenance GHG emissions.
Operational emissions
For most projects that affect traffic volumes and/or speeds, MnDOT requires you to estimate the operational GHG emissions using MICE for the preferred project and no-build alternative. The MICE tools uses simple inputs of daily vehicle miles traveled (VMT) and daily average speed, if available. MnDOT only requires you to use traffic data that have already been developed as part of project planning documents; you are not required to conduct special traffic studies or modeling to develop new traffic data just for GHG analysis. Also, operational emissions only need to be included for projects that affect traffic volumes and/or speeds, not all projects. For example, rebuilding a bridge with the same number of lanes would not impact volumes or speeds, and you are not required to estimate operational emissions.
If MnDOT’s TPDP Air Quality guidance requires you to perform an Quantitative MSAT emissions analysis for the project, MnDOT requires the analysis of operations MSAT emissions using the most current version of the Environmental Protection Agency (EPA) Motor Vehicle Emission Simulator (MOVES) model for each project alternative. In this case, since you are already using MOVES to estimate MSAT emissions, MnDOT also requires you to use MOVES to estimate operational GHG emissions, instead of using the MICE tool to estimate these emissions. (MICE is still used to estimate construction and maintenance emissions, including land use emissions.)
Construction and maintenance emissions
MnDOT requires you to estimate the specific construction and maintenance GHG emissions using the MICE tool for the preferred alternative on each project. The MICE User Guide contains detailed instructions for using the tool. GHGs for both construction and maintenance are expressed in terms of carbon dioxide equivalent (CO2e). This unit metric combines the climate effects of various GHGs as if they were all CO2. MOVES and MICE both report operational emissions in units of CO2e.
Even though the No Action alternative normally does not include any construction, it may still result in some maintenance emissions (due to the need to maintain the existing roadway network in the project area). The MICE user guide explains how to estimate these emissions for No Action (where applicable) and Build alternatives. Estimating maintenance emissions is not required for projects that do not change the amount of infrastructure in place, such as roadway rehabilitation projects (repaving or reconstruction of an existing road), or rebuilding a bridge with the same length and number of lanes.
All MICE results (what you report in the environmental document) should be emailed to MICEAnalyses.DOT@state.mn.us when complete. Also include the State Project number, roadway (IE TH 65), month and year of letting, and the city where the project is located in or nearby. A copy of the MICE run(s) should be included within the project file as determination by MnDOT’s retention policy.
Considerations for environmental document preparation
If you have an EA, EAW, or EIS for the project, include the GHG analysis in the text of that document. Include GHG analysis in the CATEX documentation package that you submit to MnDOT and FHWA.
For efficiency, you can group together and analyze similar types of small projects as a group. For example, if you plan to resurface 60 total lane miles of roadway at five different locations, group all five of these projects and analyze them as a single project. Cite this grouped analysis in the environmental documentation for each individual project.
Because other sources of information on emissions from the transportation network are readily available, there is no need to conduct a project-specific cumulative GHG emissions analysis for the cumulative effects discussion in an EIS. The MPCA prepares a GHG emissions inventory for the entire transportation sector in Minnesota every odd-numbered year. You can reference the most recent on-road vehicle portion of the inventory for comparison to operational GHG emissions from a single project. Depending on project location, the local metropolitan planning organization (MPO) may have a more refined local inventory with future emissions projections that includes the emissions from the proposed project along with all other planned projects in the area. MnDOT’s annual Sustainability Reports also include information on MnDOT’s progress meeting GHG emissions targets. You can use any of this information for a GHG discussion without conducting project-specific cumulative effects analysis.
Class I Actions (EIS Projects)
Conduct an early assessment of magnitude and significance of potential GHG emission impacts for the Scoping Documents (SD).
Include a background discussion of climate change and GHG emissions in the Draft EIS (DEIS) and Final EIS (FEIS) with the results from MICE. If you use the MOVES model for operational emissions, include those results. See below for examples of how to use MICE results to create tables for the EIS.
Include a summary statement on climate change and GHG emissions in the draft Record of Decision (ROD).
Use (and customize if necessary) the following language in the Air Quality section of the EIS:
Minnesota’s position near the center of North America subjects us to an exceptional variety of extreme weather. During the course of a single year, most Minnesotans will experience both blizzards and heatwaves, windstorms, strong thunderstorms, and heavy rains.
The conditions, however, have changed rapidly, and an overwhelming base of scientific evidence projects that Minnesota’s climate will see additional significant changes through the end of the 21st century. Over the last several decades, the state has experienced substantial warming during winter and at night, with increased precipitation throughout the year, often from larger and more frequent heavy rainfall events. These changes alone have damaged buildings and infrastructure, limited recreational opportunities, altered our growing seasons, impacted natural resources, and affected the conditions of lakes, rivers, wetlands, and our groundwater aquifers that provide water for drinking and irrigation. The years and decades ahead in Minnesota will bring even warmer winters and nights, and even larger rainfalls, in addition to other climatic changes not yet experienced in the state.
In the years and decades ahead, winter warming and increased extreme rainfall will continue to be Minnesota’s two leading symptoms of climate change. Climate models used in the 2017 National Climate Assessment also project that Minnesota will have a greater tendency toward extreme heat, especially by the middle of the 21st century. The future drought situation in Minnesota is less clear and appears to depend on how much greenhouse gas emissions increase by mid-century.
Greenhouse gases (GHGs) are gases that warm the atmosphere and surface of the planet. Human activity has been increasing the amount of GHGs in the atmosphere, leading to changes in the earth’s climate. The primary GHGs are carbon dioxide (CO2), nitrous oxide (N2O), methane, (CH4), sulfur hexafluoride (SF6), and two classes of compounds called hydrofluorocarbons (HFCs) and perfluorocarbons (PFCs).
The most recent GHG emissions inventory from the Minnesota Pollution Control Agency (MPCA) showed that transportation overtook the electricity generation sector to become the number one source of GHG emissions in Minnesota starting in 2016. This is consistent with trends in other states, and changes in both sectors and trends (electricity decreasing, transportation increasing) are expected to continue in the future.
Table _____ Analysis result
| Operational emissions (base year and design year) | CO2e (metric tons per year) |
|---|---|
| Base year (year) | |
| No action alternative (year) | |
| Build alternative (year) | |
| Difference build vs. no build | |
| Cumulative difference over project lifetime (20 years) | |
| Construction CO2e emissions (total over construction period) | CO2e (total metric tons) |
| Build alternative | |
| No build (maintenance of existing system) |
If the project was analyzed as a group or similar projects, state this and clarify that the results in the table are for the entire group.
The GHG analysis above illustrates that the project will result in a decrease in GHG emissions compared to the Base Year. The analysis also shows that the project will (increase/decrease/have no effect on) GHG emissions compared to the No Action Alternative.
Use the following language to summarize the GHG discussion:
This document summarizes the GHG emissions associated with construction of the proposed project (and vehicle traffic associated with the project, if analyzed). It does not include an assessment of the potential climate effects of those emissions. In the case of GHGs and climate change, climate is driven by global cumulative changes of GHG concentrations in the atmosphere; the changes in emissions from one individual project are simply too small to justify calculation of resulting changes in temperature, sea level, precipitation, and other significant cumulative climate effects, however, estimation of emissions is still useful to the public and decision makers so that they can understand whether projects are contributing to progress in mitigating climate change.
Assessing GHG emissions from transportation projects is one of several strategies that MnDOT is pursuing to address the issue of climate change. Other strategies that MnDOT is pursuing include intermodal transportation, electric vehicle incentives and infrastructure, clean vehicle standards, and alternative fuels. The agency is also developing a process for evaluating flood risk to MnDOT bridges, large culverts, and pipes. Studying the performance of infrastructure under predicted extreme events will help MnDOT gain knowledge and better assess the impacts of climate changes to plan, design, build, and maintain assets for resilience. More information regarding MnDOT’s efforts to address climate change can be found at Sustainability at mndot.gov/sustainability.
Class II Actions (CATEX Projects)
Include a brief discussion of whether traffic changes because of the project with the results from MICE in the CATEX. If the project does not change traffic flow, use the following language:
MnDOT evaluates greenhouse gas (GHG) emissions from projects due to concerns about current and future impacts of climate change in Minnesota. GHGs from transportation (carbon dioxide, methane, and nitrous oxide) contribute to warming of the atmosphere, which leads to effects in Minnesota that include increased heavy precipitation, increased flooding, and more episodes of extreme heat.
Because the project will not change traffic, operational GHG emissions are not expected to change. Construction GHG emissions will result from production and transportation of construction materials and from fuel used in construction equipment.
Table_____ Analysis result
| Construction of CO2e emissions (total over construction period) | CO2e (total metric tons) |
|---|---|
| Build alternative | |
| No build (maintenance of existing system) |
(If the project was analyzed as a group of similar projects, state this and clarify that the results in the table are for the entire group.)
If the project will change traffic volumes or speed, use the following statement:
MnDOT evaluates greenhouse gas (GHG) emissions from projects due to concerns about current and future impacts of climate change in Minnesota. GHGs from transportation (carbon dioxide, methane, and nitrous oxide) contribute to warming of the atmosphere, which leads to effects in Minnesota that include increases in heavy precipitation, increased flooding, and more episodes of extreme heat.
The project is expected to ____ traffic flow, which should _____ operational greenhouse gas emissions. (Provide a very short explanation of how the project causes this effect on traffic flow, e.g., the project reduces congestion or increases traffic volumes without a corresponding improvement in speeds, or the project reduces design speed in order to improve safety) Construction greenhouse gas emissions will result from production and transportation of construction materials and from fuel used in construction equipment.
Table _____ Analysis result
| Operations emissions (base year and design year) | CO2e (metric tons per year) |
|---|---|
| Base year (year) | |
| No action alternative (year) | |
| Build alternative (year) | |
| Difference build vs. no build | |
| Cumulative difference over project lifetime (20 years) | |
| Construction CO2e emissions (total over the construction period) | CO2e (total metric tons) |
| Build alternative | |
| No build (maintenance of existing system) |
If the project was analyzed as a group or similar projects, state this and clarify that the results in the table are for the entire group.
Class III Actions (EA and EAW Projects)
For the EA, follow the same guidance for the Scoping document, DEIS, and FEIS.
Include a summary statement on climate change and GHG emissions in the Finding of No Significant Impact (FONSI).
Use (and customize if necessary) the following language in the Air Quality section of the EIS:
Minnesota’s position near the center of North America subjects us to an exceptional variety of extreme weather. During the course of a single year, most Minnesotans will experience both blizzards and heatwaves, windstorms, strong thunderstorms, and heavy rains.
The conditions, however, have changed rapidly, and an overwhelming base of scientific evidence projects that Minnesota’s climate will see additional significant changes through the end of the 21st century. Over the last several decades, the state has experienced substantial warming during winter and at night, with increased precipitation throughout the year, often from larger and more frequent heavy rainfall events. These changes alone have damaged buildings and infrastructure, limited recreational opportunities, altered our growing seasons, impacted natural resources, and affected the conditions of lakes, rivers, wetlands, and our groundwater aquifers that provide water for drinking and irrigation. The years and decades ahead in Minnesota will bring even warmer winters and nights, and even larger rainfalls, in addition to other climatic changes not yet experienced in the state.
In the years and decades ahead, winter warming and increased extreme rainfall will continue to be Minnesota’s two leading symptoms of climate change. Climate models used in the 2017 National Climate Assessment also project that Minnesota will have a greater tendency toward extreme heat, especially by the middle of the 21st century. The future drought situation in Minnesota is less clear and appears to depend on how much greenhouse gas emissions increase by mid-century.
Greenhouse gases (GHGs) are gases that warm the atmosphere and surface of the planet. Human activity has been increasing the amount of GHGs in the atmosphere, leading to changes in the earth’s climate. The primary GHGs are carbon dioxide (CO2), nitrous oxide (N2O), methane, (CH4), sulfur hexafluoride (SF6), and two classes of compounds called hydrofluorocarbons (HFCs) and perfluorocarbons (PFCs).
The most recent GHG emissions inventory from the Minnesota Pollution Control Agency (MPCA) showed that transportation overtook the electricity generation sector to become the number one source of GHG emissions in Minnesota starting in 2016. This is consistent with trends in other states, and changes in both sectors and trends (electricity decreasing, transportation increasing) are expected to continue in the future.
Table _____ Analysis result
| Operational emissions (base year and design year) | CO2e (metric tons per year) |
|---|---|
| Base year (year) | |
| No action alternative (year) | |
| Build alternative (year) | |
| Difference build vs. no build | |
| Cumulative difference over project lifetime (20 years) | CO2e (total metric tons) |
| Construction CO2e emissions (total over construction period) | CO2e (total metric tons) |
| Build alternative | |
| No build (maintenance of existing system) |
If the project was analyzed as a group or similar projects, state this and clarify that the results in the table are for the entire group.
The GHG analysis above illustrates that the project will result in a decrease in GHG emissions compared to the Base Year. The analysis also shows that the project will (increase/decrease/have no effect on) GHG emissions compared to the No Action Alternative.
Use the following language to summarize the GHG discussion:
This document summarizes the GHG emissions associated with construction of the proposed project (and vehicle traffic associated with the project, if analyzed). It does not include an assessment of the potential climate effects of those emissions. In the case of GHGs and climate change, climate is driven by global cumulative changes of GHG concentrations in the atmosphere; the changes in emissions from one individual project are simply too small to justify calculation of resulting changes in temperature, sea level, precipitation, and other significant cumulative climate effects, however, estimation of emissions is still useful to the public and decision makers so that they can understand whether projects are contributing to progress in mitigating climate change.
Assessing GHG emissions from transportation projects is one of several strategies that MnDOT is pursuing to address the issue of climate change. Other strategies that MnDOT is pursuing include intermodal transportation, electric vehicle incentives and infrastructure, clean vehicle standards, and alternative fuels. The agency is also developing a process for evaluating flood risk to MnDOT bridges, large culverts, and pipes. Studying the performance of infrastructure under predicted extreme events will help MnDOT gain knowledge and better assess the impacts of climate changes to plan, design, build, and maintain assets for resilience. More information regarding MnDOT’s efforts to address climate change can be found at Sustainability at mndot.gov/sustainability.
Use the MICE Summary Results tables to fill in the CATEX/EA/EAW/EIS tables as shown below:
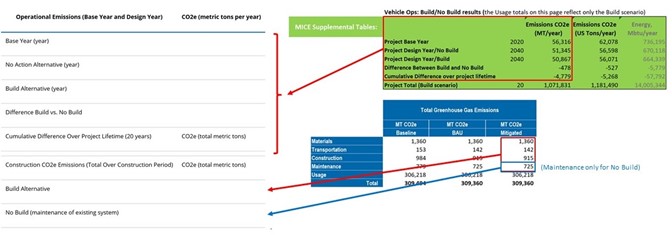
For construction emissions in a Build scenario, use the total of Materials, Transportation, Construction and Maintenance; for a No Build scenario, use the Maintenance emissions only.
Mitigation
MnDOT has identified several practices that can help reduce emissions from projects. These practices directly reduce emissions through decreased fuel use, or indirectly through materials reuse (i.e. less processing and transport of new materials). When a project is in the project development phase, the plans are approximately 30% complete [note correct % if known], so your ability to use the listed mitigation practices may depend on further development. Emissions reductions for most of these measures can be estimated using the MICE tool, by adding measures to the Mitigation tab in the tool and/or entering negative land use inputs on the Project Inputs tab. If the project is planning to include any of these practices, note them in the response:
The emissions reductions (per mile) for all of these practices has not yet been determined [or, insert estimated reductions calculated using the MICE tool]. That said, this project is planning to implement the following: [insert list of planned actions from the list below].
List of practices that may reduce emissions during a project:
- Full Depth Reclamation (FDR)
- Cold In-Place Recycling (CIR) and Cold Central Plant Recycling (CCPR)
- Warm-mix asphalt
- Recycled concrete aggregate
- Increase in overall wetlands, tree cover, or planted area
Agency involvement
The following external agencies are involved with GHG analysis:
- MPCA: The MPCA develops Minnesota GHG emissions inventories and can provide inputs for MOVES modeling
- FHWA: The FHWA approves federally funded highway projects
- MPO: The MPOs conduct regional emissions modeling and can provide inputs for MOVES modeling
- Federal Transit Authority (FTA): The FTA approves federally funded transit projects
Glossary
Carbon Dioxide Equivalent (CO2e): The emissions of multiple GHGs expressed in terms of their relative emissions if they were all carbon dioxide.
Greenhouse Gas (GHG): A gas that causes atmospheric warming. Transportation-related greenhouse gases include carbon dioxide, methane, nitrous oxide, and hydrofluorocarbons (air conditioning gases).
Metric Tons (MT): Common unit for reporting GHG emissions; a metric ton is 1,000 kilograms, or about 2200 US pounds.
Minnesota Infrastructure Carbon Estimator (MICE): Minnesota-specific version of FHWA’s Infrastructure Carbon Estimator
Motor Vehicle Emissions Simulator (MOVES): An EPA model for estimating GHG and other emissions from motor vehicles.
Mobile Source Air Toxics (MSAT): The 188 air toxics identified in the Clean Air Act, also known as hazardous air pollutants. FHWA has issued guidance and frequently asked questions for addressing MSATs in the NEPA process, and these FAQs are a helpful resource for analyzing GHG emissions with the MOVES emissions model, if that approach is used.
Minnesota Pollution Control Agency (MPCA): The agency that administers and enforces all federal and state laws relating to air pollution in Minnesota.
Metropolitan Planning Organization (MPO): The forum for cooperative decision making and the organization designated, together with the state, as being responsible for conducting the continuing, cooperative, and comprehensive planning process under 23 U.S.C. 134 and 49 U.S.C. 5303.
National Environmental Policy Act (NEPA): Environmental policy law:
Title I of NEPA contains a Declaration of National Environmental Policy. This policy requires the federal government to use all practicable means to create and maintain conditions under which man and nature can exist in productive harmony.
Section 102 in Title I of the Act requires federal agencies to incorporate environmental considerations in their planning and decision-making through a systematic interdisciplinary approach. Specifically, all federal agencies are to prepare detailed statements assessing the environmental impact of and alternatives to major federal actions significantly affecting the environment. These statements are referred to as Environmental Impact Statements (EIS) and Environmental Assessments (EA).
Title II of NEPA established the President’s CEQ to oversee NEPA implementation. The duties of CEQ include:
- Ensuring that federal agencies meet their obligations under NEPA
- Overseeing federal agency implementation of the environmental impact assessment process
- Issuing regulations and other guidance to federal agencies regarding NEPA compliance