Environmental process | Environmental review | Greenhouse Gas Analysis
Greenhouse Gas Analysis prepared statements
Class I Actions (EIS Projects)
Conduct an early assessment of magnitude and significance of potential GHG emission impacts for the Scoping Documents (SD).
Include a background discussion of climate change and GHG emissions in the Draft EIS (DEIS) and Final EIS (FEIS) with the results from MICE. If you use the MOVES model for operational emissions, include those results. See below for examples of how to use MICE results to create tables for the EIS.
Include a summary statement on climate change and GHG emissions in the draft Record of Decision (ROD).
Use (and customize if necessary) the following language in the Air Quality section of the EIS:
Minnesota’s position near the center of North America subjects us to an exceptional variety of extreme weather. During the course of a single year, most Minnesotans will experience both blizzards and heatwaves, windstorms, strong thunderstorms, and heavy rains.
The conditions, however, have changed rapidly, and an overwhelming base of scientific evidence projects that Minnesota’s climate will see additional significant changes through the end of the 21st century. Over the last several decades, the state has experienced substantial warming during winter and at night, with increased precipitation throughout the year, often from larger and more frequent heavy rainfall events. These changes alone have damaged buildings and infrastructure, limited recreational opportunities, altered our growing seasons, impacted natural resources, and affected the conditions of lakes, rivers, wetlands, and our groundwater aquifers that provide water for drinking and irrigation. The years and decades ahead in Minnesota will bring even warmer winters and nights, and even larger rainfalls, in addition to other climatic changes not yet experienced in the state.
In the years and decades ahead, winter warming and increased extreme rainfall will continue to be Minnesota’s two leading symptoms of climate change. Climate models used in the 2017 National Climate Assessment also project that Minnesota will have a greater tendency toward extreme heat, especially by the middle of the 21st century. The future drought situation in Minnesota is less clear and appears to depend on how much greenhouse gas emissions increase by mid-century.
Greenhouse gases (GHGs) are gases that warm the atmosphere and surface of the planet. Human activity has been increasing the amount of GHGs in the atmosphere, leading to changes in the earth’s climate. The primary GHGs are carbon dioxide (CO2), nitrous oxide (N2O), methane, (CH4), sulfur hexafluoride (SF6), and two classes of compounds called hydrofluorocarbons (HFCs) and perfluorocarbons (PFCs).
The most recent GHG emissions inventory from the Minnesota Pollution Control Agency (MPCA) showed that transportation overtook the electricity generation sector to become the number one source of GHG emissions in Minnesota starting in 2016. This is consistent with trends in other states, and changes in both sectors and trends (electricity decreasing, transportation increasing) are expected to continue in the future.
Table _____ Analysis result
| Operational emissions (base year and design year) | CO2e (metric tons per year) |
|---|---|
| Base year (year) | |
| No action alternative (year) | |
| Build alternative (year) | |
| Difference build vs. no build | |
| Cumulative difference over project lifetime (20 years) | |
| Construction CO2e emissions (total over construction period) | CO2e (total metric tons) |
| Build alternative | |
| No build (maintenance of existing system) |
If the project was analyzed as a group or similar projects, state this and clarify that the results in the table are for the entire group.
The GHG analysis above illustrates that the project will result in a decrease in GHG emissions compared to the Base Year. The analysis also shows that the project will (increase/decrease/have no effect on) GHG emissions compared to the No Action Alternative.
Use the following language to summarize the GHG discussion:
This document summarizes the GHG emissions associated with construction of the proposed project (and vehicle traffic associated with the project, if analyzed). It does not include an assessment of the potential climate effects of those emissions. In the case of GHGs and climate change, climate is driven by global cumulative changes of GHG concentrations in the atmosphere; the changes in emissions from one individual project are simply too small to justify calculation of resulting changes in temperature, sea level, precipitation, and other significant cumulative climate effects, however, estimation of emissions is still useful to the public and decision makers so that they can understand whether projects are contributing to progress in mitigating climate change.
Assessing GHG emissions from transportation projects is one of several strategies that MnDOT is pursuing to address the issue of climate change. Other strategies that MnDOT is pursuing include intermodal transportation, electric vehicle incentives and infrastructure, clean vehicle standards, and alternative fuels. The agency is also developing a process for evaluating flood risk to MnDOT bridges, large culverts, and pipes. Studying the performance of infrastructure under predicted extreme events will help MnDOT gain knowledge and better assess the impacts of climate changes to plan, design, build, and maintain assets for resilience. More information regarding MnDOT’s efforts to address climate change can be found at Sustainability at mndot.gov/sustainability.
Class II Actions (CATEX Projects)
Include a brief discussion of whether traffic changes because of the project with the results from MICE in the CATEX. If the project does not change traffic flow, use the following language:
MnDOT evaluates greenhouse gas (GHG) emissions from projects due to concerns about current and future impacts of climate change in Minnesota. GHGs from transportation (carbon dioxide, methane, and nitrous oxide) contribute to warming of the atmosphere, which leads to effects in Minnesota that include increased heavy precipitation, increased flooding, and more episodes of extreme heat.
Because the project will not change traffic, operational GHG emissions are not expected to change. Construction GHG emissions will result from production and transportation of construction materials and from fuel used in construction equipment.
Table_____ Analysis result
| Construction of CO2e emissions (total over construction period) | CO2e (total metric tons) |
|---|---|
| Build alternative | |
| No build (maintenance of existing system) |
(If the project was analyzed as a group of similar projects, state this and clarify that the results in the table are for the entire group.)
If the project will change traffic volumes or speed, use the following statement:
MnDOT evaluates greenhouse gas (GHG) emissions from projects due to concerns about current and future impacts of climate change in Minnesota. GHGs from transportation (carbon dioxide, methane, and nitrous oxide) contribute to warming of the atmosphere, which leads to effects in Minnesota that include increases in heavy precipitation, increased flooding, and more episodes of extreme heat.
The project is expected to ____ traffic flow, which should _____ operational greenhouse gas emissions. (Provide a very short explanation of how the project causes this effect on traffic flow, e.g., the project reduces congestion or increases traffic volumes without a corresponding improvement in speeds, or the project reduces design speed in order to improve safety) Construction greenhouse gas emissions will result from production and transportation of construction materials and from fuel used in construction equipment.
Table _____ Analysis result
| Operations emissions (base year and design year) | CO2e (metric tons per year) |
|---|---|
| Base year (year) | |
| No action alternative (year) | |
| Build alternative (year) | |
| Difference build vs. no build | |
| Cumulative difference over project lifetime (20 years) | |
| Construction CO2e emissions (total over the construction period) | CO2e (total metric tons) |
| Build alternative | |
| No build (maintenance of existing system) |
If the project was analyzed as a group or similar projects, state this and clarify that the results in the table are for the entire group.
Class III Actions (EA and EAW Projects)
For the EA, follow the same guidance for the Scoping document, DEIS, and FEIS.
Include a summary statement on climate change and GHG emissions in the Finding of No Significant Impact (FONSI).
Use (and customize if necessary) the following language in the Air Quality section of the EIS:
Minnesota’s position near the center of North America subjects us to an exceptional variety of extreme weather. During the course of a single year, most Minnesotans will experience both blizzards and heatwaves, windstorms, strong thunderstorms, and heavy rains.
The conditions, however, have changed rapidly, and an overwhelming base of scientific evidence projects that Minnesota’s climate will see additional significant changes through the end of the 21st century. Over the last several decades, the state has experienced substantial warming during winter and at night, with increased precipitation throughout the year, often from larger and more frequent heavy rainfall events. These changes alone have damaged buildings and infrastructure, limited recreational opportunities, altered our growing seasons, impacted natural resources, and affected the conditions of lakes, rivers, wetlands, and our groundwater aquifers that provide water for drinking and irrigation. The years and decades ahead in Minnesota will bring even warmer winters and nights, and even larger rainfalls, in addition to other climatic changes not yet experienced in the state.
In the years and decades ahead, winter warming and increased extreme rainfall will continue to be Minnesota’s two leading symptoms of climate change. Climate models used in the 2017 National Climate Assessment also project that Minnesota will have a greater tendency toward extreme heat, especially by the middle of the 21st century. The future drought situation in Minnesota is less clear and appears to depend on how much greenhouse gas emissions increase by mid-century.
Greenhouse gases (GHGs) are gases that warm the atmosphere and surface of the planet. Human activity has been increasing the amount of GHGs in the atmosphere, leading to changes in the earth’s climate. The primary GHGs are carbon dioxide (CO2), nitrous oxide (N2O), methane, (CH4), sulfur hexafluoride (SF6), and two classes of compounds called hydrofluorocarbons (HFCs) and perfluorocarbons (PFCs).
The most recent GHG emissions inventory from the Minnesota Pollution Control Agency (MPCA) showed that transportation overtook the electricity generation sector to become the number one source of GHG emissions in Minnesota starting in 2016. This is consistent with trends in other states, and changes in both sectors and trends (electricity decreasing, transportation increasing) are expected to continue in the future.
Table _____ Analysis result
| Operational emissions (base year and design year) | CO2e (metric tons per year) |
|---|---|
| Base year (year) | |
| No action alternative (year) | |
| Build alternative (year) | |
| Difference build vs. no build | |
| Cumulative difference over project lifetime (20 years) | CO2e (total metric tons) |
| Construction CO2e emissions (total over construction period) | CO2e (total metric tons) |
| Build alternative | |
| No build (maintenance of existing system) |
If the project was analyzed as a group or similar projects, state this and clarify that the results in the table are for the entire group.
The GHG analysis above illustrates that the project will result in a decrease in GHG emissions compared to the Base Year. The analysis also shows that the project will (increase/decrease/have no effect on) GHG emissions compared to the No Action Alternative.
Use the following language to summarize the GHG discussion:
This document summarizes the GHG emissions associated with construction of the proposed project (and vehicle traffic associated with the project, if analyzed). It does not include an assessment of the potential climate effects of those emissions. In the case of GHGs and climate change, climate is driven by global cumulative changes of GHG concentrations in the atmosphere; the changes in emissions from one individual project are simply too small to justify calculation of resulting changes in temperature, sea level, precipitation, and other significant cumulative climate effects, however, estimation of emissions is still useful to the public and decision makers so that they can understand whether projects are contributing to progress in mitigating climate change.
Assessing GHG emissions from transportation projects is one of several strategies that MnDOT is pursuing to address the issue of climate change. Other strategies that MnDOT is pursuing include intermodal transportation, electric vehicle incentives and infrastructure, clean vehicle standards, and alternative fuels. The agency is also developing a process for evaluating flood risk to MnDOT bridges, large culverts, and pipes. Studying the performance of infrastructure under predicted extreme events will help MnDOT gain knowledge and better assess the impacts of climate changes to plan, design, build, and maintain assets for resilience. More information regarding MnDOT’s efforts to address climate change can be found at Sustainability at mndot.gov/sustainability.
Use the MICE Summary Results tables to fill in the CATEX/EA/EAW/EIS tables as shown below:
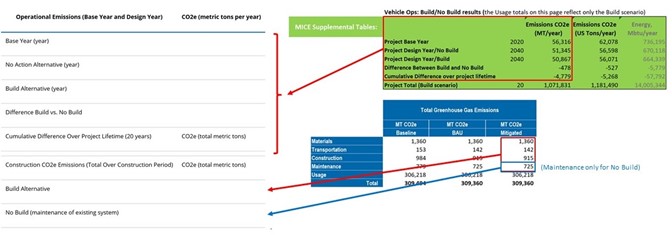
For construction emissions in a Build scenario, use the total of Materials, Transportation, Construction and Maintenance; for a No Build scenario, use the Maintenance emissions only.